Hans
J.M.
Van
Grinsven
a,∗,
Aaldrik
Tiktak
a,
Carin
W.
Rougoor
baPBLNetherlandsEnvironmentalAssessmentAgency,POBOX30314,2500GHTheHague,TheNetherlands bCLMResearchandAdvice,POBOX62,4100ABCulemborg,TheNetherlands
a
r
t
i
c
l
e
i
n
f
o
Articlehistory:Received9November2015
Receivedinrevisedform20February2016 Accepted17March2016
Availableonline22March2016 Keywords:
Nutrientpolicies Targetachievement Costsandbenefits Nitrogen Phosphorus Surfacewater Groundwater
a
b
s
t
r
a
c
t
DutchnutrientpoliciesforagriculturearegenerallyimplementationsofEuropeanenvironmental Direc-tives,i.e.theNitratesDirective(ND),theWaterFrameworkDirective(WFD)andtheNationalEmission CeilingsDirective(NECD).Wepresentanevaluationofthesepolicieswithrespecttotarget achieve-ment,effectiveness,costsandbenefits.ImplementationoftheNitratesDirectivedecreasednutrient surplusesandimprovedgroundwaterquality.However,thenitratetargetof50mg/lwasstillexceeded ingroundwaterinhalfofthesandregion.Ecologicalqualityofsurfacewatersimprovedslightly,but thisimprovementwasmainlyduetomeasuresfortheWFDandnottoreducednutrientlossesfrom agriculture.TheNECDreducedemissionsofammoniaeffectively,butcriticalloadsofnitrogenwere stillexceededinthemajorityofecosystems.Healthbenefitsofreducingtheconcentrationsof ammo-niaaerosolswerehoweversubstantial.Overall,nutrientpolicieshavegeneratednetbenefitsforDutch society:Annualcostswereestimatedtobe500millioneurosandsocietalbenefitswereestimatedto bebetween900and3700millioneuros.Withpoliciescurrentlyinplace,thegeneralprotectiongoals oftheDirectiveswillnotbemet.Reachingmoretargetsinacost-effectivewaywouldfirstrequire bet-tercoordinationofpoliciestoimplementthethreeDirectives.Forexample65%ofphosphorusinputto surfacewatersiscausedbyagriculturebuttheDutchimplementationoftheWFDhardlycontainsany measurestoreducenutrientloadsfromagriculturalsoils.Inadditiontomorestrictnationalpolicies thatarebetterenforced,regionallydifferentiatedmitigationoptionswouldbeneeded.Themostrobust optionwouldbeminingofsoilphosphorusbyzeroP-applicationinagriculturalsoilsthataffectsensitive aquaticecosystems.Wheretargetachievementcannotbecombinedwithcompetitiveagriculture, polit-icalchoiceswouldhavetobemadebetweenecologyandagriculture,orforfinancialcompensationof affectedfarmers.Akeyfactorforimplementationwouldberedistributingofcostsandbenefitsbetween specificgroupsoffarmersorregions.ThiswouldimplybetterintegrationoftheCommonAgricultural Policywithenvironmentaldirectives.
©2016TheAuthors.PublishedbyElsevierB.V.onbehalfofRoyalNetherlandsSocietyforAgricultural Sciences.ThisisanopenaccessarticleundertheCCBY-NC-NDlicense(http://creativecommons.org/ licenses/by-nc-nd/4.0/).
Contents
1. Introduction...70
2. Materialsandmethods...70
3. Environmentallegislation...71
3.1. Europeanlegislation ... 71
Abbreviations:CAP,CommonAgriculturalPolicy;EC,EuropeanCommission;EQR,EcologicalQualityRatio;FADN,FarmAccountancyDataNetwork;ND,NitratesDirective; IHW,InformationHouseWater;LMM,MineralsPolicyMonitoringProgramme;MINAS,MineralAccountingSystem;MNLSO,MonitoringProgrammeforSurfaceWaters PredominantlyAffectedbyAgriculture;NECD,NationalEmissionsCeilingDirective;PRTR,DutchPollutantReleaseandTransferRegister;RBMP,RiverBasinManagement Plan;WFD,WaterFrameworkDirective;WTP,WillingnesstoPay.
∗Correspondingauthor.
E-mailaddress:[email protected](H.J.M.VanGrinsven). http://dx.doi.org/10.1016/j.njas.2016.03.010
1573-5214/©2016TheAuthors.PublishedbyElsevierB.V.onbehalfofRoyalNetherlandsSocietyforAgriculturalSciences.ThisisanopenaccessarticleundertheCC BY-NC-NDlicense(http://creativecommons.org/licenses/by-nc-nd/4.0/).
3.2. Thenitratesdirective...71
3.3. Thewaterframeworkdirective(WFD)...72
3.4. Thenationalemissionsceiling(NEC)directive...72
3.5. Overlap,synergyandtrade-offsbetweenEUnutrientdirectives...72
3.5.1. RelationbetweenthenitratesdirectiveandtheNECD-NH3...73
3.5.2. RelationbetweenthenitratesdirectiveandtheWFD...73
3.6. FertiliserandmanurepoliciesintheNetherlands...73
3.6.1. Implementationofthenitratesdirective...73
3.6.2. Implementationofthewaterframeworkdirective...74
3.6.3. ImplementationoftheNECdirectiveforammonia ... 75
4. Resultsanddiscussion...75
4.1. Evaluationofachievementofspecificenvironmentalobjectives...75
4.1.1. Nutrientinputsandsurpluses ... 75
4.1.2. Groundwater...75
4.1.3. Surfacewater...76
4.1.4. Ammoniaemission...76
4.1.5. Compliancewithmanureregulations ... 77
4.1.6. Interactionbetweeneffectsofpoliciesandpollutionswapping...78
4.2. Achievementofgeneralprotectiongoals...78
4.2.1. Aquaticecosystems ... 78
4.2.2. Terrestrialecosystems ... 78
4.2.3. Humanhealthimpactsofnitrateindrinkingwater...79
4.2.4. Humanhealthimpactsofammoniainair...79
4.3. Costsandbenefits...80
4.3.1. Coststocomplywithfertiliserandmanurepolicies ... 80
4.3.2. Benefitsofnutrientpolicies...80
4.4. Prospectsfortargetachievement...80
5. Optionsforpoliciestoimprovetargetachievement...81
6. Conclusions...82
Acknowledgements ... 82
References...82
1. Introduction
Dutchpolicies toreduce losses of nitrogen and phosphorus fromagriculturetotheenvironmenthavebeeninplaceforthree decades.Thesepoliciesaregenerallyimplementationsofcommon directivesinstigatedbytheEuropeanCommission(EC).In1991 theNitratesDirectivetoreducenitrateemissionsfromagriculture wasacceptedfollowedin2000bytheWaterFramework Direc-tive(WFD),whichaimsatagoodecologicalstatusofwatersand,in 2001,theECNationalCeilingsdirective(NECD)toreduceammonia emissions[1].Nationalimplementationofthesedirectivesinthe Netherlandshalvedthesurplusofnitrogensinceitspeakof250kg perhectareindemid-1990sandconsiderablyreducedthe con-centrationofnitrateingroundwater.However,exceedanceofthe 50mg/lNO3targetinshallowgroundwaterunderagriculturalland
inthesandregionsandexceedanceofecologicalNandPthresholds inlakesandstreamsisstillcommon.Thisraisesquestionsabout theeffectivenessandthecostsandbenefitsofcurrentpoliciesand theproportionalityofadditionalpoliciesandmeasurestotackle remainingpollutionimpacts,relativetotrade-offstoagricultural productionandcompetitivenessoffarms.
The25thanniversaryoftheNitratesDirective(ND)couldbea goodopportunitytoevaluatetheachievementsoftheNDandof nutrientpoliciesingeneral.Theobjectiveofthisarticleisto eval-uatetheachievementofgoals,effectivenessandefficiencyofthe Dutchimplementationofnutrientpoliciesforagriculture,forwhich therelevantquestionsare:
•TowhatextentdidtheNetherlandsachievethespecific objec-tivesandthegeneralprotectiongoalsofnutrientpolicies? •Whatistheeffectivenessofthesepolicies? Howstrongisthe
relationwiththeeffectsonnutrientsconcentrationsinwaterand airandtheirimpactsonecosystemsandhumanhealth? •Whatarethesocietalcostsandbenefitsofthesepolicies?
•Whataretheprospectsofmeetingthegeneralprotection objec-tives of the directives in the future, taking into account the effectivenessandcostsandbenefitsofcurrentpolicies?
We focus on fertiliser and manure policies in the period 1990–2012takingintoaccount linkageswiththeWFD andthe NECDforammonia(NECD-NH3)andthebroadercontextof
aspi-rationsfor sustainableagriculture.Thisevaluation mayprovide usefulinsightsforfutureimplementationsoftheNDandimproved linkagewiththeWFDandNECD-NH3.Thispaperisbasedon
previ-ousevaluationsoftheDutchfertiliserandmanurepoliciesbyRefs. [2–6].Further,theDutchexperiencecanbeinstructiveforotherEU regionswithhighlivestockdensitieslikeDenmark,Flanders, Brit-tany,Catalu ˜na,thePovalleyandtheNorthernpartofGermanyand Poland.
2. Materialsandmethods
ResultsaremainlybasedonWillemsetal.[6]andtheunderlying detailedreportsfortheformalevaluationoftheDutchfertiliserand manureregulation.Prospectsforfuturetargetachievementwere takenfromascenariostudybyVanGaalenetal.[7]andunderlying reports.Thefollowingprimarydatasourceswereused:
•TheFarmAccountancyDataNetwork(FADN)[8],whichcontains dataontheuseoffertilisersandmanure,measuresandnutrient budgetsatthefarmlevel;
•TheMinerals PolicyMonitoringProgramme (LMM)[8,9].This programmemeasuresthenitrateandphosphateconcentrations inshallowgroundwateranddrainwater on437farms.These farmswereselectedusingastratifiedsamplesothatfarmswere evenlydistributedamongstregions,farmtypesandfarmsize; •Themonitoringprogrammeforsurfacewatersdominantly
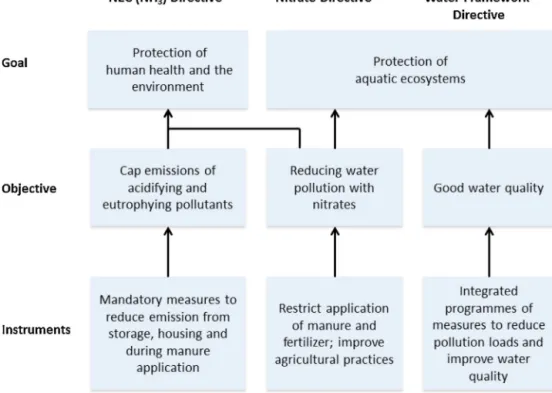
Fig.1. Goals,objectivesandinstrumentsofthedifferentDirectivesrelatedtocontrolofnutrientloadsfrommanureandfertiliser.
•The Limnodata Neerlandica and Informatiehuis Water (IHW) databases,whichcontainmonitoringdataforNandPinditches, lakesandstreams[11];
•TheDutchPollutantReleaseandTransferRegister(PRTR;www. emissieregistratie.nl),whichcontainsdataonemissionsof indus-trialandagriculturalemissions.
ThecalculationoftheeconomicvalueofreducedN-pollution wasbased onRef. [12] usingstandard economic concepts and methodsforvaluationofhealthimpactsortorestoreorprotect ecosystems.
DatainfiguresweretakenfromtheDutchEnvironmentalData Compendium(www.clo.nl)unlessstatedotherwise.
3. Environmentallegislation
3.1. Europeanlegislation
Nationalpoliciestoreducenutrientlossestotheenvironment aregenerallyimplementationsofEuropeandirectives.Most nutri-entrelatedEU-directiveswereadoptedinthe1980sand1990sand typicallyaddressemissionsofspecificcompoundsfromindividual sectors,liketraffic,wastewaterandagriculture[2].Thisapproach wasnecessarytoreducecomplexityoftheissuesandnegotiations, butalsocreatesriskofinefficiency(Section3.5).Themost impor-tantEuropeandirectivesaredescribedhereafter.
Inenvironmentalregulationsvarioustermsareusedtoexpress thepurposeoftheregulationandthelegalrequirementfor coun-tries,enterprisesorpersonstosatisfytheseregulations.Wewill usethreeterms(basedonRef.[13]):
•Environmentalgoal:thisisthegeneralprotectiongoalandthe relevantpurposeoftheregulationforsociety,ofteninthefuture, e.g.safewaterforeverycitizen;
•Environmentalobjective:thisisamorespecificprotectiongoal andoftenanofficiallyagreedquantitativepurpose,butstillat anabstractionlevelthatisrelevantandunderstandabletothe
generalpublic,e.g.halvingthenutrientloadtocoastalseasin someyearrelativetoareferenceyear;
•Environmentaltarget: anobjectivethat isexactlyspecifiedin technicalterms:e.g.atargetconcentrationforaspecific com-ponentinaspecificcompartment.
3.2. Thenitratesdirective
The formal objective of the ND (EC, 1991) [14] is reducing water pollutioncaused orinducedby nitratesfromagricultural sourcesandpreventingfurthersuchpollution,againstthe over-archingenvironmentalgoaltoprotectdrinkingwater resources andaquaticecosystemsbyreducingwaterpollutionwithnitrates fromagriculturalsources(Fig.1).TheNDwasacceptedin1991and thefirstnationalactionprogrammewasimplementedinthelate 1990s.TheintroductionoftheNDwasaresponsetothe recog-nitioninthe1980sthattheincreaseduseofmanurefromafast growinglivestocksectorhadnegativeeffectsonwaterqualityand ecosystems.Applicationoflargevolumesofslurrytoboth grass-landandarable landledtoeutrophicationoflakesandstreams fedbyrunoffandleaching.Hoodaetal.[15]attributedthisimpact tothemovefrommixedarable-livestockfarmingtowardsgreater specialisation,togetherwiththegeneralintensificationof agricul-tural production.In theNetherlands highlandprices enhanced intensification[16].
Asafirststepofimplementationmemberstateswereaskedto identifywaterbodiesthatwereeutrophic,orthatwereatriskto becomeeutrophicinthefuture.Allknownareasoflandthatdrain intothesewatershadtobedesignatedasNitrateVulnerableZones. LandandwaterarestronglyinterconnectedintheNetherlandsand thereforetheNetherlandsdesignateditsentireterritoryasNitrate VulnerableZone.Measureshadtobeformulatedinnationalaction programmesforallNitrateVulnerableZoneswherethenitrate con-centrationinsurfaceand/orgroundwaterexceededthetargetof 50mg/lforuseasadrinkingwaterresource,orwherefreshand marinewaterswereeutrophicoratriskofbecomingeutrophic.
Fig.2.HierarchyofindicatorsfortheobjectivesandgoalsofthedifferentDirectives(basedonRef.[3]).
TheNDincludesrulesfortheuseofanimalmanureandchemical fertilisers.Akeymeasureisthatmemberstatesshouldguarantee thatannualapplicationofNbyanimalmanureatthefarmlevel doesnotexceed170kg/ha.Ahigherratemaybeallowedwhenit canbedemonstratedthattheobjectivesoftheDirectivewillstill berealised.
3.3. Thewaterframeworkdirective(WFD)
TheenvironmentalgoaloftheWFDistoestablishagoodstatus ofallsurfacewatersbytheyear2015[17].Forsurfacewaters,the goodstatuscomprisesagoodchemicalstatusandagoodecological status.Goodchemicalstatusrequiresthatcertainsubstancesdonot exceedathresholdconcentration.Goodecologicalstatusdemands thattheassemblageofalgae,fish,waterplantsandmacrofauna shouldonly“slightlydeviate”fromacertainreference,whichisthe statusexpectedinpristinewatersofthesametype.TheWFD fur-therrequiresthatnutrientconcentrationsdonotexceedthelevels establishedsoastoensurethefunctioningoftheecosystemandthe achievementofthevaluesspecifiedaboveforthebiologicalquality elements.
ImplementationofmeasuresfortheWFDstartedin2009when memberstateswererequiredtodesignriverbasinmanagement plans(RBMPs).Thegoals,objectivesandmeasuresoftheWFD over-lapwiththoseoftheND,particularlyaftertheintroductionofthe GroundwaterDirectivein2006,whichspecifiesthegroundwater qualitytargetsforNandP.Phosphorusisoftenthelimiting nutri-entinstagnantfreshwatersandtheprimecauseofblooms,but therearealsomanysystemsthatarenitrogenlimitedorwhere bothnutrientsarelimiting.Restorationofagoodecologicalstatus thereforegenerallyrequiresreductionofbothNandP[18–20].
3.4. Thenationalemissionsceiling(NEC)directive
TheenvironmentalgoaloftheNECDirective[21]istoprotect theenvironmentandhumanhealthagainstpollutantsresponsible
foracidification,eutrophicationandground-levelozonepollution (sulphurdioxide,nitrogenoxides,volatileorganiccompoundsand ammonia).ForthistheNECDsetsceilingsforeachmemberstate forthetotalemissionsofthefourpollutants.Ceilingsaresetfor specifiedperiods,providingastepwiseapproachtomeetthe over-arching environmentalgoals for EU air quality policies.In this paperweonlydiscustheNECDforammonia(NECD-NH3).Possible
measurestoreduceammoniaemissionsfromagriculturalsources arelaid downinanadvisorycode ofgood agriculturalpractice (AnnexIXofGothenburgProtocolECE/EB.AIR/WG.5/2011/3; see Ref.[22] fora summary).Largelivestockoperationsmust com-plywiththeIndustrial EmissionsDirective[23],which requires these operations to apply best available techniques to control emissions.
3.5. Overlap,synergyandtrade-offsbetweenEUnutrient directives
AgeneralobjectiveofEUenvironmentaldirectivesistohaltthe increaseofpollutionandtoreversetrendstoeventuallyachieve thefinalgoalofmaximumprotectionofecosystemsandhumans atproportionalcostsforsociety.Goals,objectives,targetsand mea-suresoftheND,NECD-NH3andWFDareclearlylinked(Fig.2).The
instrumentalpolicyapproachis,however,different.TheNDisa ‘means-orientedregulation’,prescribingamixofcompulsoryand voluntarymeasuresandinstruments.TheWFDisgoal-oriented; memberstatesmustensurethatgoodecologicalstatusofall sur-facewatersisreachedby2027buthavemorefreedomtochoose andplantheirmeasures.TheNECD-NH3directivetakesan
inter-mediateposition,whereceilingsandrecommendedmeasuresare ameanstoimproveachievementofenvironmentalgoals. Further-more,measuresfortheWFD areoftenregionally differentiated, while those for the ND and the NECD are more generic with applicationstandardsfordifferentcropsandsoilsintheND,and recommended NH3 reduction measures for livestocktypes and
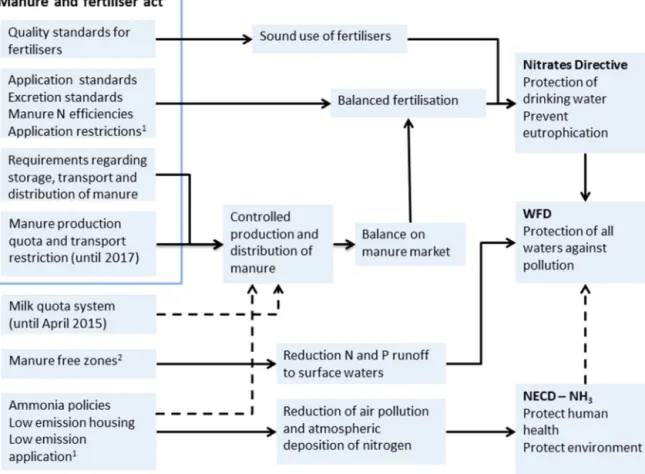
Fig.3. InstrumentsoftheDutchmanureandfertiliseractinrelationtoinstrumentscontrollingagriculturalemissionofnutrientsinotherpolicies,theireffectonnational policyobjectivesandthegoalsofEUdirectives.1)mandatorylowemissionapplicationofmanureispartofthesoilprotectionactandcontributestoobjectivesofboththe NDandtheNECD.2)ManurefreezonesarebothrequiredforimplementationoftheNDandWFD.Dashedarrowsindicatepotentialco-benefitsofpolicies.
3.5.1. RelationbetweenthenitratesdirectiveandtheNECD-NH3
ThecontributionofnitrogendepositiontothetotalNinputof freshwateraquaticecosystemsisapproximately20–25%[12]both intheNetherlandsandonaverageintheEU.Ammoniaemissions fromagricultureareamajorsourceforNdeposition.Thiscreates arelationbetweenimplementationsoftheNDandtheNECD-NH3.
ApossibleconflictbetweentheimplementationoftheNDandthe NECD-NH3isthatmeasurestoreduceammonialossesfrom
hous-ing,storageandduringapplicationofmanurewillincreasetheN contentinmanureandbythatincreaseNsurplusesandenhance nitrateleaching,ifnotaccompaniedbyanoverallreductionofN inputsoradditionalmeasures[1].Ontheotherhandapplication restrictionsformanurewillleadtoamore evendistributionof manureNonagriculturalland,whichmaypromoteemissionof ammonia.
3.5.2. RelationbetweenthenitratesdirectiveandtheWFD
TheintroductionoftheWFDin2000alsocreatedsynergiesand trade-offs.AmajorgoaloftheWFDisrestorationofagood ecologi-calstatusinallwaters,whichincludesthegoaloftheNDtoprotect wateragainsteutrophication(Fig.1).Thereare,however,two pos-sibleconflictsbetweentheWFDandtheND,i.e.(i)forachieving agoodecologicalstatusalowerNconcentrationof0.9–5.0mg/lis neededthanthetargetthatisusedintheND(11.3mg/l)and(ii)the NDdoesnotaddressothersourcesofnutrientssuchas wastewa-tertreatmentplants.Forthesereasons,theEuropeanCommission increasinglysuggestsastrongerlinkagebetweenimplementation oftheNDandWFD,forexamplebyusingwaterpricingfor agri-cultureasafutureelementofgreeningtheCommonAgricultural Policy[24,25].
3.6. FertiliserandmanurepoliciesintheNetherlands
Since1984nationalmeasureshavebeentakentoreducethe environmentalimpactofmanureandfertilisers.ThecurrentDutch approachisacombinationofmeasurestocontroltheproductionof manureandmeasurestoreducetheloadstosoilsandwater(Fig.3). Since1991theManureandFertiliserActbasicallyisthenational implementationoftheND.
3.6.1. Implementationofthenitratesdirective
TheNetherlandshassuccessfullyappliedforanallowanceofN inputsfrommanuretoamaximumof250kgperha(‘derogation’) ondairy farmswhereatleast70%oflandisinuseasgrassland [26].ThisderogationappliestoalmosthalfoftheDutchagricultural landandisthemostextensivederogationintheEU[27].Inviewof insufficientimprovementofwaterquality,theEuropean Commis-sionlimitedthisderogationfrom2015onwardsbyincreasingthe requiredpercentageoflandinuseasgrasslandto80%and reduc-ingthemaximummanureNinputto230kg/haforsandandloess regionsinthecentreandsoutheastoftheNetherlands.
Currently,thecoreoftheManureandFertiliserActisasystem ofsoilandcropspecificapplicationstandardsforNandP.Tomeet theenvironmental targetsof theND,the applicationstandards weregraduallyloweredsinceitsintroductionin2006(Table1). TheDutchapplicationstandardsincludestatutoryfertiliser equiv-alenciesforNinmanure,whicharerelativelystrictcomparedto otherEUmemberstates[27].Therefore,statutory equivalencies wereincreasedformanureNongrazedgrassland (from35%in 2006to45%since 2009), forpigslurryN onsandyarableland (from60%in2006to80%since2014)andforcattleslurry(from
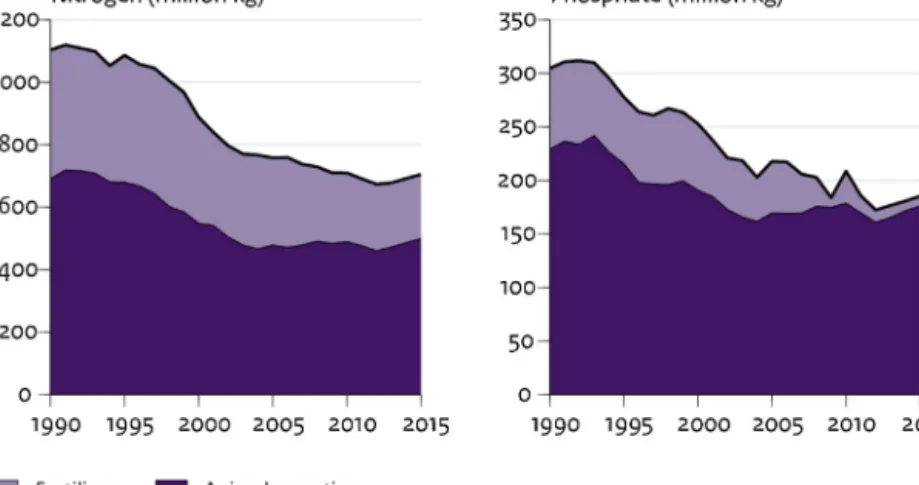
Fig.4.Nationalexcretionandfertiliseruseofnitrogenandphosphate.
Table1
Applicationstandardsfortotal(fertiliserpluseffectivemanure)nitrogenand phos-phatein2006,2009and2015(inkgNandkgP2O5/ha)forgrassand(asanexample)
forwarepotatoes.
2006 2009 2015
Ngrassa 290–385 260–340 250–385
Nwarepotatoesb 240–300 225–275 210–275
P2O5grass 110 100 80–100c
P2O5crops 85(+10)d 85 50–75c
aRangecausedbydifferentiatingbetweengrazing,mowingandbetweensoil
type.
b Rangecausedbydifferentiatingbetweensoiltypes.
c Rangecausedbydifferentiatingbetweendifferentphosphatestatusesofthe
soil.
d Anadditional10kg/haPmaybegivenasmineralfertiliser.
45%in2006to60%since2010).Thecurrentsystemreplacedthe mineralaccountingsystem(MINAS),whichaimedatachieving bal-ancedfertilisationatthefarmlevelbysettingasmallsetofNandP lossstandards.However,theEUcourtofJusticejudgedthatMINAS wasnotacorrectimplementationoftheND,becauseitimplicitly allowedexceedanceofthelegalEUlimitvalueof170kg/haNin manureandbecauseitwasaretrospectivecheckratherthanana prioricontrolsystematthestartoftheseason[3,28].This under-linesadrawbackof theinstrumental approachoftheNDbeing ameans-orienteddirectiveratherthanagoal-orienteddirective (Section3.5).
Tocontrolproductionofmanure,asystemoftradablemanure production quota was introduced for pigs (1998) and poultry (2001).Thissystemincludedregionalbarriers,buying-upschemes andcompulsoryskimmingforeverytradeevent(until2002).The productionquotareducedtheexcretionofPby15%between2000 and2003[4].However,theambitionoftheDutchparliamentis toabolish thissystembytheyear2017,when thecurrentfifth ActionProgramme ends. Onereason for abolishment is that in April2015themilkquotasystemfordairyended.Maintaininga quotasystemforpigs andpoultrycouldcreateanimbalancein competivenesswiththedairysectorwhencompetingfordisposal contractofsurplusmanuretoarablefarmers.Notethatunlikethe productionquotaforpigsandpoultry,themilkquotasystemof 1984isnotanutrientpolicy;however,itlimitedmanure produc-tionindirectly.Inresponsetothefastgrowthofthedairysectorin anticipationoftheabolishmentofthemilkquotasystem,theDutch governmentannounced newpoliciesin 2014and 2015 to pre-ventintensificationandmanuredisposalproblemsfordairyfarms andtoslowdowntheincreaseofthePexcretion.Thelatterwas
necessarytoavoidtheriskofexceedanceofthenationalP excre-tionceiling,whichisaconditionformaintainingthederogation [27].
Givenatrendtostricterapplicationstandards(Table1)thereis anincreasingriskthatnationalorregionalproductionofmanure exceedsthecapacityofagriculturallandtoadsorbtheassociated amountofNandP.Therefore,since2014theNetherlandshasa pol-icyforcompulsorymanureprocessingforafractionofthemanure surplusatthefarmlevel.FortheSouthoftheNetherlandsthis frac-tionincreasedfrom30%in2014–55%in2016,fortheEastfrom15% to35%, and forother partsof theNetherlands from5% to10% (https://www.rijksoverheid.nl/documenten/kamerstukken/2015/ 12/10/kamerbrief-over-percentages-verplichte-mestverwerking-2016).Manureprocessingwill increasethecostof manure dis-posal,butimprovesexportabilityofmanureproducts.Further,the feedindustry isdevelopingcovenantswithlivestockfarmingto reducemanureandPexcretionbyreducingthePandproteinin compoundfeed.
3.6.2. Implementationofthewaterframeworkdirective
TheWFDhastheoptionforphasingtargetachievementuntil theyear 2027 and theDutch governmentapplied this exemp-tionto86%ofDutchsurfacewaterbodies.Theyarguedthatfully achievingtheWFDobjectivesby2015wouldnotbepossibleand wouldalsonotbepragmatic,feasibleoraffordable.Measuresfor theWFDaredescribedinRiverBasinManagementPlans(RBMPs). ThefocusintheDutchRBMPsisonmeasuresimprovingthe hydro-morphological status of surface waters. The ratio betweenthe actuallyobservedecologicalqualityandthereferenceiscalledthe EcologicalQualityRatio(EQR),IntheNetherlands,thetargetvalue forgoodecologicalstatushasbeensetto0.6[29].Notethatthe targetvaluediffersbetweenmemberstatesandisoftennotbased onthresholdsrelevanttotheecosystem[30].IntheNetherlands mostwaterbodiesareclassifiedasheavilymodifiedorartificial. Forthesewaterbodies,alowertargetvaluemaybedefined.
TheformalDutchinterpretationinthefifthActionPlanforthe ND is that this ActionPlan is partof theWFD programmes of measuresand musthelptoensurethat emissionsfrom agricul-turalsourcesdonotstandinthewayofWFDgoals.Further,an amendmentin2007byDutchparliamenthasruledthatadditional measurestoreducepollutionbynutrientsfromagriculturalsources maynot increase thetotal cost offarmers for takingmeasures requiredfortheND.Hence,theonlynutrientrelatedmeasurein thefirstgenerationofRBMPswasabanonfertiliserandmanure applicationclosetowaterbodieswithahighnaturevalue.
Fig.5. FarmlevelsoilNandP2O5surplussesforthedairysectorandforthearablesector.
3.6.3. ImplementationoftheNECdirectiveforammonia
Legalregulationsfor reduction of ammoniaemission during manureapplicationwerealready introducedin1991toprotect ecosystemsfromeffectsofacidificationandNdeposition. Regula-tionstoreduceemissionsfrommanurestorageandhousingwere graduallyintroducedsince1994andemissionsstandardsper live-stockunittoachievetheEUNECD-NH3emissionsceilingscame
intoeffectin2008.Theceilingfortheperiod2010–2019is128 ktonNH3andnewceilingarecurrentlynegotiatedfortheperiod
2020–2024at13%,andfortheperiod2025–2029at25%belowthe emissionlevelof2005[31].
4. Resultsanddiscussion
4.1. Evaluationofachievementofspecificenvironmental objectives
4.1.1. Nutrientinputsandsurpluses
Thetotalconsumptionofnitrogenfertiliserhasdecreasedby 50%since 1990andthat ofphosphatefertiliserby 85%(Fig.4). Nationalanimalexcretiondecreasedby40%forbothnitrogenand phosphate.Inthefollowingsectionwewillexplorethecausesand consequencesofthislargereductionofNandPinputs.
Improvementofgroundwaterandsurfacewaterqualityby cur-rentfertiliserandmanurepolicyisprimarilydeterminedbythe gradualloweringofapplicationstandardsfortotalNandP(Table1). Themaineffectofloweringthesestandardsisadecreaseoftotal inputtothesoilandadecreaseoftherelativeproportionof syn-theticfertiliserintotalNandPinput.Asaresultthephosphate inputsonagriculturallandnowalmostcompletelyrelyonuseofP inmanure,andsoonnationalimportsofphosphateinfeed.
Thesurplusofnitrogenandphosphateinthesoilbalanceisan indicatoroftheefficiencybywhichthemineralsappliedaretaken upbycropsandbythatofthepotentiallossestotheenvironment. Sincethestartofthemanureandfertiliserpolicyboththenitrogen andthephosphatesurplusesinthesoilbalancehavedecreased. Phosphatesurpluseshavedecreasedmorestronglythannitrogen surpluses(Fig.5).Themajorcauseisthereductionoftheuseof phosphatefertiliser,whichdecreasedfrom75millionkilogramin 1990–10millionkilogramsin 2014(Fig.4).Reducedinputsand improvedmanagementofnitrogenindairyfarmingaremajor rea-sonsforastrongdecreaseoftheNsurplusinthelate1990s,while Nsurplusesinarablefarminghardlydecreased.
4.1.2. Groundwater
Nitrate. Thenitrateconcentrationsinshallowgroundwaterhave decreased since 1992 in all regions (Fig. 6). Concentrations
Fig.6.Nitrateintheuppergroundwaterinagriculturalareasforthetotaland south-easternsandregionandfortheclayregion.
decreasedmoststronglyinthefirstdecadeofadoptionoftheND duetothecombinedeffectofimprovedawarenessoffarmersand regulationslaiddowninMINAS.Commonunderstandingisthat particularlydairyfarmersbecameawarethatthetotalNapplied asmanureandsyntheticfertiliserbyfarexceededplantdemand. Thisstimulatedfarmerstoreducechemicalfertiliserinputsbeyond legalrequirementsyet[5].Sothedecreaseofnitratebefore2005 wasbothadirectandindirecteffectoflegislation,withlowfinancial costforfarmers.
In the clay region the mean nitrate concentration doesnot exceedthetargetvaluesince2005.However,inthesandregion theaveragevalueisabovethetargetvalue,especiallyinthe south-ernpartoftheNetherlands(Fig.6).Thiswasthemajorreasonthat in2014thederogationfordairyfarminginthesandregioninthe southoftheNetherlandswasloweredfrom250to230kg/haNin manureandthestatutoryfertiliserequivalencyforpigmanurewas increasedfrom70%to80%.Thesandregionishighlyrelevant;it coversnearlyhalfofthetotalagriculturalareaofthecountry.In 2012morethanhalfofthedairyfarmsinthesandyregion com-pliedwiththenitrate-Ntargetof50mg/lofnitratebutlessthana quarterofthearableandintensivelivestockfarmsdid(Table2).
Whenconcentrationsarecorrectedfordifferencesin precipita-tionbetweenyears,thereisastrongcorrelation(Fig.7,R2=0.82)
between the decrease of the nitrate concentration in shallow groundwaterinthesandregionandthedecreaseoftheNsurplus, particularlyondairyfarms[32].Onaverage,thenitrate concen-trationdecreasesby 0.6mg/lper kilogramof decreaseoftheN surplus.Thisindicatesthatreductionofnitrogensurpluslikelyisan
Table2
Area,averagenitrateconcentrationandpercentageoffarmsbelowthetargetvalueof50mg/lorlessduringtheperiod2007–2010inthesandregion(source:Willemsetal. [6]).
Area(percentageofsandregion) Averagenitrateconcentration(mg/l) Percentageoffarmsbelowtargetvalue(50mg/l)
Dairyfarms 47.5% 51 55%
Arablefarms 16.2% 78 21%
Intensivelivestock 5.7% 130 23%
Other 24.2% 70 41%
Fig.7.NitrateconcentrationinthesandregioninshallowgroundwaterandN sur-plusperhectareinthesandregion.Theyearofthenitrateobervationisshifted backwardbyaboutoneyeartomakeitcorrespondtoistheyearofNsurplusthat causedtheleaching[32].
Fig.8.TrendsofP2O5surplusandPconcentrationintheuppergroundwaterinthe
sandregion.ThehighPconcentrationsin1994and1995werecausedby exception-allyhighgroundwatertables.
effective strategy to decrease nitrogen in groundwater. How-ever,thecorrelationseemstodecreaseafter2008.Thecontinued decreaseofnitrateconcentrationscouldbeadelayedresponseto thedecreaseoftheN-surplusbefore2008[33].
Phosphate. Despite the strong decrease of the P surplus
(Figs. 5 and 8), since 1992 the phosphorus concentration in groundwaterdoesnotshowacleartrendovertime(Fig.8).This confirms findings thatthe Pconcentration ingroundwater is a functionof theP saturationdegree rather thanof the actualP
surplus[33].TheNetherlands is anextremecase regardingthe phosphoruscontent of soils.Chardonand Schoumans [34] and Tóthetal.[35]showedthatmorethan50%ofsoilsamplesfrom theNetherlands(collectedusingstandardisedprocedures)fellin thehighestcategory,indicatingthatnoadditionalPfromfertiliser isneeded.However,thephosphorusinputsperhectarebymanure andfertiliseronagriculturallandintheNetherlandsarestillthe highestvalueswithintheEU[36,37].
4.1.3. Surfacewater
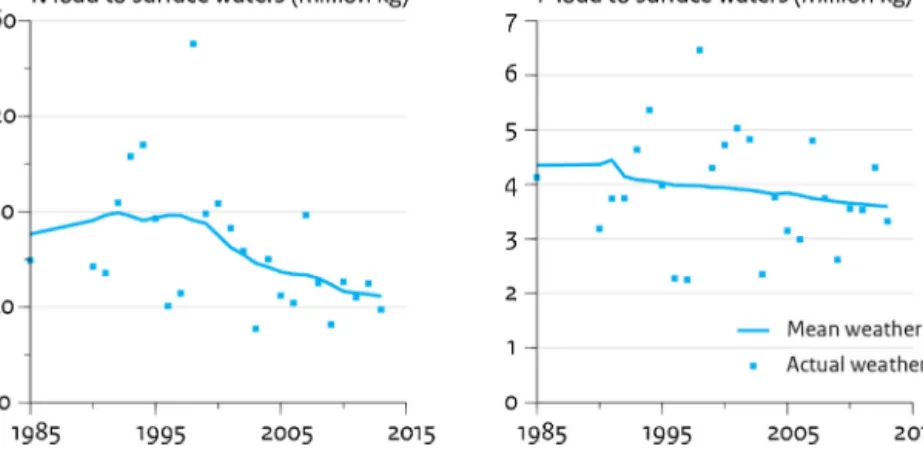
In theperiod1990–2013,agriculturalinputs ofN tosurface watersdecreasedby37%andthoseofPby17%(Fig.9).Inthesame period,nutrientinputsbywastewatertreatmentplantsdecreased by80%duetoimprovedtreatmentefficiency.Asaresult,diffuse inputsofNandPfromagriculturewerethedominantsourceof nutrientinputsin2013(approximately60%ofthetotalloadforN andP[7]).Duetovariabilityofprecipitationbetweentheyears, thediffusenutrientloadsinFig.9showconsiderablevariability betweentheyears.Thisimpliesthatlong-termtrendscannotbe establishedbasedondatafromindividualyears.
ThedecreaseofnutrientloadsfromagriculturallandinFig.9is primarilycausedbygenericfertiliserandmanurepolicies.Regional mitigationmeasuresincludedintheWFDandtheND(inparticular fertiliserandmanurefreezones,wetbufferzonesalongstreams andrestricteddrainage)hardlycontributedtothedecreaseof agri-culturalnutrientinputstosurfacewater.Theirpotentialtoreducing nutrientloadsis,however,large:Whenfertiliserandmanurefree zoneswouldbeinstalledalongallwaterbodies,NandPloadsfrom agriculturewouldbereducedbyabout20%[39].Current imple-mentationofbufferzonesonagriculturallandislessthan3%of whatwouldbepossibleandthereforehardlyreducestotalnational nutrientloads.
In2010,Nconcentrationswereonaverage1.5timesabovethe qualitystandard andPconcentrations wereonaverage3times abovethequalitystandard(Fig.10).Nitrateconcentrationsinfresh surfacewatersarelowcomparedtootherEuropeancountriesand Dutchrivers are relatively hypertrophic. Dutch lakes are often eutrophic due tohighP levelsand salinewater due toN [40]. Phosphorus showeda strongerdecrease than nitrogen, primar-ilybecauseofimprovedwastewatertreatment.VanderBoltand Schoumans[41]concludedthattheregionalmeanconcentrationof NandPdecreasedmorestronglythantheregionalmedian concen-trationofthesenutrients.Thissuggestsarelativelystrongdecrease ofpeakconcentrations,whichislikelyduetorestrictionson apply-ingmanureoutsidethegrowingseason,onsteepslopes,onfrozen soilsandnearwatercourses.Abouthalfofthesamplingsitesin regionalsurfacewatersystemscompliedwiththeconcentration targetsforeitherNorPinsurfacewaters[7].
4.1.4. Ammoniaemission
Regardingammoniameasures,theeffectofpolicyisreflected mostclearly in thenational ammonia emission inventories for varioustypesof manurestorage,livestockhousingand manure applicationtechniques.Theseinventoriesshowthatthe contribu-tionofagriculturalsourcestothenationalammoniaemissionswas 85%.Agriculturalemissionsdecreasedby70%since1990,mainly
non-correctedNandPloads.
Fig.10.RatioofPandNconcentrationsandtheirrespectivequalitystandards averagedoverallWFDsurfacewaterbodies.
Fig.11.Trendsofemissionsandconcentrationsinambientairofammonia.
duetomandatorylowemissionapplicationofmanuresince1991 (Fig.11).Thecontributionofemissionfromsyntheticfertiliserin 2013was13%.Inspiteofthe50%reductionofsyntheticfertiliser use(Fig.4),the2013emissionof13.6ktonNH3wasclosetothe
level in 1990due toa gradual replacement of calcium ammo-niumnitratebyureatypefertiliser.Inthesameperiod,however,
measuredammoniaconcentrationsonlyslightlydecreased.There areseveralexplanationsforthisdiscrepancyoftrends[42].First, thedecreaseofemissionsmighthavebeenoverestimateddueto lackofcompliancewithregulationsforammoniaemissionsfrom housingand duringmanureapplication (Section4.1.5).Second, thenumberofsiteswhereammoniaconcentrationsaremeasured mightbetoolowtocapturethehighspatialvariabilityofammonia concentrationstypicalforagriculturalemissions.Finally,NH3
con-centrationsmayhaveincreasedbecauseofthestrongdecreaseof SO2inresponsetoacidificationpolicies,whichreducesformation
anddepositionofairborneammoniaaerosols.Huijsmansetal.[43] reconfirmedin2015theearlierconclusionthatforgrassland low-emissiontechniqueseffectivelyreducethelossofammoniawhile increasingtheavailabilityofNforgrassproduction.
4.1.5. Compliancewithmanureregulations
Thecurrentmeanannualcostforpigorpoultryfarmerto dis-posetheirmanureis15eurospertonwithseasonalpeaksupto25 eurosperton[44].Thiscanmakemanurefraudaprofitablepractice. Allfarmshavetokeepmineralaccounts.Compliancewith applica-tionstandardsiscontrolledforanannualsampleofabout385farms andfocusedonfarmsatriskofviolation.Finesforexceedanceof applicationstandardsarebetween7and11europerkgNorP. Therearebothstatisticalandobservationalindicationsfor viola-tions.Forexample,in2009,15–20%ofintensivelivestockfarms didnotcomplywithlegalrequirementsregardingNorP applica-tionstandards[6].Dataforproductionandexportofmanurebased onfarmaccountstotheauthoritiesindicatethatthelegalspaceto applyNandPfromanimalmanureiscommonlyexceededinthe sandregionsoftheNetherlands(Fig.12).Insomemunicipalities, applicationstandardsareexceededbymorethan35%forPand25% forN.ThiscorrespondstoexceedanceofNapplicationstandards of60–100kg/haandofP2O5applicationstandardsof25–35kg/ha.
However,partofthisexceedancemaybeduetoerrorsin allocat-ingmanureproductionandtransporttospecificmunicipalities,and notnecessaryistheresultofviolationofregulations.
Anempiricallyestablishedrelationbetweenthenitrate concen-trationinuppergroundwaterandNsurplus(Section4.1.2)implies that theexceedance ofapplication standardscorresponds toan increaseofNO3concentrationsby30–50mg/l.Thiscouldexplain
theobservedexceedanceofthenitratestandardinshallow ground-waterinthesandregionsincludingthesouth(Fig.6).Thissuggests thatstricterenforcementofmanureregulationscanincreasethe effectivenessofmanureandfertiliserpolicies.Overallcompliance offarmswiththemanurepolicieshasincreasedsince2006toalevel ofmorethan90%in2010,buttheeffectofthenon-complianceon theenvironmentisnotclear[6].
Fig.12.UtilisationofNandPfromanimalmanurerelativetothelegalspaceatmunicipalitylevel(2013).DataarebasedoncensusdataforproductionandnetexportofN andPinmanure(source:CBS-statline).
Therearealsocomplianceproblemswithregulationsfor reduc-tion of ammonia emissions from housing and during manure application.In200811%ofslurryapplicationongrasslandwasnot inaccordancewithregulation.Furthermore,in2012,about75%of mandatoryairscrubbersonanimalhousingforpigsandpoultry didnotmeetlegalrequirements.Shortcomingsincludedabsence ofregisteredairscrubbersandairscrubbersthatwerenotin oper-ationbecausefarmerswantedtosaveenergy.Closersurveillance waseffectiveandin2014only15%ofpigandpoultryfarmswasin violation.
4.1.6. Interactionbetweeneffectsofpoliciesandpollution swapping
ImplementationofDirectivessince1990hasclearlychangedN flowsin agriculture,and insomeoccasionstheactualtimingof changesofthemanureandfertiliserpolicyisreflectedintrends (Fig.13).Forexample,theintroductionofproductionquotaforpigs in1998sloweddowntheincreaseofmanureproduction. Further-more,theintroductionofthemineralaccountingsystem(MINAS) in1998resultedinanimmediatedecreaseoftheuseofNfertiliser [3].Therewasalsoanalmostimmediateeffectoftheintroduction ofmandatorylowemissionmanureapplicationin1991on ammo-niaemissions.However,thedrawbackoftheseapplicationrulesis anincreaseofNcontentinmanureandtheapplicationofmanure NsloweddownreductionofNleachingduetoreduceduseof syn-theticNfertiliser(Fig.13;Section3.5).Nitrateleachingdidnotstart todecreaseuntilaftertheintroductionofMINASin1998.
4.2. Achievementofgeneralprotectiongoals
Itisdifficulttodeterminetowhatextentthegoalsofthethree Directives regarding humanhealth and ecosystem health have
beenachievedbecausethereis nosimple, univocalrelationship betweenwaterandairchemistryontheonehandandimpactson humanhealthandecosystemhealthontheotherhand. Further-more,ecosystemhealthislesssystematicallymonitoredthanwater andairquality,andhumanhealthimpactscanonlybeinferredfrom epidemiologicalstudies.
4.2.1. Aquaticecosystems
IntheWFD,theoccurrenceoffourspeciesgroups(algae,water plants,fishesandmacrofauna)isusedasanindicatorofecological quality(Section3.3).Ecologicalqualityisevaluatedtobegoodif allindicatorspeciesarepresentintherightamount.Monitoring dataof2013collectedbyregionalwaterboardsindicatesthatthe numberofwaterbodiesthatisevaluatedas“good”wasabout20% forwaterplantsandmacrofaunaandalmost40%forfishandalgae (Fig.14).
Only5%ofwaterbodiesscored“good”forallfourspeciesgroups (“one-out,all-out” principle).Thenumber ofwater bodies with agoodbiologicalstatusforoneoftheWFD-groupsincreasedby 4–12%in the period 2009–2013 (Fig. 14). These changes were primarilydue tomeasures improvingthe hydro-morphological qualityof surfacewaters[7].Notice,however, thatpercentages reportedarebasedontargetsforheavilymodifiedwaters,usinga lowerreferencequalityascanbefoundinpristineaquatic ecosys-temsofthesametype(Section3.3).
4.2.2. Terrestrialecosystems
Eutrophicationisalsoamajorcauseofdegradationof terres-trialecosystemsand wetlands (Figure15).In theseecosystems nutrientinputismainlybydeposition.In2010thecriticalN depo-sitionwasexceededon75%ofDutchareasprotectedundertheEU BirdsandHabitatDirective[45].Approximately40%ofthetotalN
Fig.13.TrendofNflowsinagricultureintheNetherlands(1990=100)inrelationtothetimingofchangesofnutrientpolicies.
Fig.14.Numberofsurfacewaterbodieswithagoodbiologicalstatusforeachof thebiologicalindicatorsoftheWFD.Awaterbodyisconsideredtobeingoodstatus iftheEcologicalQualityRatio>0.6(seeSection3.3).
depositionisfromagriculturalNH3emissionsandthereforetheNE
C-NH3Directiveisimportanttoreduceexceedanceofcritical
depo-sitionloadsfortheseecosystems.Indeed,more thanhalfofthe decreaseofnitrogendepositionbetween1990and2013wasthe resultofmeasurestoreducetheammoniaemissionfromDutch agriculturesuchasmandatorylowemissionmanureapplication andtheintroductionoflowemissionhousingsystems.
DespitethereductionofNdeposition,thepresenceof charac-teristicplantspeciesandqualityofthehabitatsisstillunfavourable in80%oftheNatura2000areas[46].Thereasonisthattheother stressfactorssuchashabitatfragmentationanddesiccationhave notbeentakenaway[46].
4.2.3. Humanhealthimpactsofnitrateindrinkingwater
ThepercentageofDutchconsumersexposedtodrinkingwater exceedingthelegal EUthreshold valueof 50mg/l is negligible. Morethan99%ofDutchconsumersareconnectedtopublic drink-ingwatersupplyforwhichitisillegaltosupplywaterexceeding thenitratethreshold[47].However,thisthresholdisabovethe no-effectconcentrationforvariouspossiblehealtheffectsofnitrate
Fig.15.Therelativeimportanceofeutrophicationasacauseofdegradationof ecosystemsintheNetherlands(2012).
indrinkingwater,andanitratetargetof25mg/lisprobablymore appropriate[48].VanGrinsvenetal.[47]estimatedthatin2005 about3.5%oftheDutchpopulationwasexposedtodrinkingwater fromgroundwaterresourcesexceeding25mg/l.Theoretically,this exceedancewouldincreasetheincidenceofcoloncancerby100 casesperyear(1%oftotalnewpatients).Inviewofthissmall con-tributiontothetotalincidenceofcoloncancer,itis,however,not possibletoconfirmthesetheoreticalnumbersbyempirical evi-dence.
4.2.4. Humanhealthimpactsofammoniainair
Theabsenceofa decreaseofNH3 concentrationssince 2005
(Fig.11)questionstheeffectivenessofammoniameasureswith respecttohumanhealth.Ammoniais,however,alsoaprecursor forsecondaryaerosols,whichisacomponentofpotentially harm-fulparticulatematter(PM).In2005theaveragelifeexpectancyin theNetherlandsduetoPMexposurewasreducedby7–13months, representinganationalwelfarelossof5–25billioneuroperyear [49].Between1992and2013PM10concentrationsdecreasedby about50%inbothurbanandruralareas.ThetrendofPM2.5,which ismorerelevantforhumanhealth,showedasimilartrendasPM10. Secondaryinorganiccomponentsaremainlyaerosolsofammonia, nitrateandsulphateandammoniaaerosolscontributeabouthalfto
thetotalmassofthe2.5mPMfraction[50].Inabsenceof ammo-niatheseaerosolswouldnotbeformed.Asthereisnoevidence thatsecondaryPMislessharmfulthanotherPMcomponents[51], itcanbeinferredthatammoniacontributesalmosthalftothetotal healthimpactofPM.
4.3. Costsandbenefits
4.3.1. Coststocomplywithfertiliserandmanurepolicies
Around2005themeanannualcostfortheagriculturalsectorto complywithfertiliserandmanurepolicieswasapproximately500 millioneuro(Table3).Themajorityofthesecostswasforthe live-stocksectorandconstituted5%ofitsgrossturnoverandabout50% ofitsaddedvalue.Forthedairysectorcostswerepartly compen-satedbyannualsavingsonfertiliserof150millioneuro,butthese savingswereunequallydistributedbetweendifferentfarmtypes andregions.Costsconsistofadministrativecosts(includingthe costsofyearlymineralaccountingbythefarmeroranaccountancy agency),costsformanuredisposalandcostsfore.g.depreciationof investments(Fig.16).Costformanuredisposalincreasedafter2006 byabout70millioneurowhenMINASwithasystemofnutrient lossstandardswasreplacedbyasystemofapplicationstandards (Fig.16).Costincreased particularlyfor intensivedairy farmers whohadtostartdisposingmanuretocomplywiththe applica-tionstandardof250kg/haofNinmanureatfarmlevel.However, administrativecostsdecreasedbecausethesystemofapplication standardswaseasiertoimplementforfarmers.Costsformanure disposalincreasedsomewhatin2011and2012.In2012thetotal grosscost was278millioneuro,of which 44million eurowas acompensationofpigfarmerstoarable farmerstoaccepttheir manure[44].
4.3.2. Benefitsofnutrientpolicies
Van Grinsven et al. [12] estimated the marginal benefits of reducedemissionof NfortheEUbylinkingtheseemissionsto theactualimpactsandtheWillingnesstoPay(WTP)ofpeopleto preventtheseimpacts.Thesemarginalbenefitsareusedhereto estimatethecostsandbenefitsofmanureand fertiliserpolicies intheNetherlands(Table3).Thetotalannualbenefitsforfarmers andsocietyofreducedemissionsofnitrateandammoniaare esti-matedtobe2400millioneurosperyearfortheperiod2000–2008 (Table3).These calculationsare,however, highlyuncertain(its range is 900–3700 million euros per year). The most impor-tantuncertainfactorsare [12,52](i)thedoseresponserelation betweenemissionsandimpacts,(ii)therelative contributionto
Fig.16.Costofimplementationoffertiliserandmanurepoliciesfortheagricultural sector.Costsformanuredisposalarenetcostswhicharecorrectedforpayments oflivestockfarmerstoarablefarmersforacceptanceofmanure.Administrative costsincludecostforfarmerstokeepnutrientaccount,legalcostsand administra-tivecostfortransferoftradablemanurequota.Othercostsincludedepreciationof investmentsinequipmentforstorageandtreatmentofmanure.
theseimpactsofpollutionbyvariousNandPcompounds,and(iii) theWTP.
Despite these uncertainties and not explicitly considering impacts of phosphate pollution, the resultsof this cost-benefit analysisshowthatitislikelythatreducedNpollutionbyDutch fertiliser,manureandammoniapolicieshavegeneratedsubstantial benefitsforsocietybutalsoincreasedproductioncostsforfarmers. Thesecostsareexpectedtoincreaseinthecomingyears,dueto increasingcostsoftransporting,processingandexportingmanure productstocomplywithreducedapplicationstandardsforNandP (Table1)andincreasingmanureproductioninthedairysectordue toabolishmentofthemilkquotasystem.Alsothecostsofadditional measurestoreduceammoniaemissionfromlivestockhousingto complywithloweremissionceilingswillincrease.
4.4. Prospectsfortargetachievement
Inthissectionwepresentanevaluationofcurrentpolicieswith regardtofuturetargetachievement.Focuswillbeontheyear2027, becausethisistheyearthatagoodecologicalstatusofallsurface watersshouldbeachievedtocomplywiththeWFD.
Table3
Annualcostsoffertiliser,manureandammoniapoliciesfortheagriculturalsectorintheNetherlandsaround2005.Nfertilisersavingsarerelativetofertiliserusein2000 andfertiliserpricesin2008.Environmentalbenefitsarebasedonreductionofammoniaandnitratepollutionbetween2000and2008andmonetisationisbasedonWTPto preventimpactsofNpollution.
Annualcosts Millioneuros Annualbenefits Millioneuros
Costsforfarmers Benefitstofarmers
Manuretransport 200(130–250) Fertilisersavings 150
Manureadministration 125(90–170)
Manurestorage 70
Manurelowemissionapplication 60(40–80) HousingNH3reduction 50(15–80)
Yieldreduction 0
Totalcostsforfarmers 505(350–650) Totalbenefitstofarmers 150
Costsforsociety Benefitstosociety
Controlcosts 30 Nrunoffaquaticecosystems 1250(250–2000)
NO3pollutionhumanhealth 10(0–20) NH3pollutionecosystems 300(100–500) NH3pollutionhumanhealth 700(350–1000) Totalcosts(rounded) 530(400–700) Totalbenefits(rounded) 2400(900–3700)
Modelcalculationsindicatethatthenumberofwater bodies withagoodecologicalstatuscouldincreasefromthecurrent4–12%
to35–50%in2027whentheproposedpackageofWFD-measures
wouldbe fullyimplemented[7]. Theexpectedimprovement in
ecologicalqualitywouldmainlybetheresultofthewidespread implementationofmeasuresimprovingthehydro-morphological conditionsof water bodies, suchastheconstruction of nature-friendlyriverbanksand fishladders,and there-meanderingof streams.Toreachagoodecologicalstatusinallsurfacewater bod-ies,the Nand P loads tosurface watersshould bereduced by approximately50%[39].MeasuresinthefifthNitrateAction Pro-gramme,however,willnotreducenutrientloadsfromagricultural soilstosurfacewaters.Duetoimprovementsinwastewater treat-ment,nutrientconditionsareexpectedtoimproveonlyslightly. However,insomeregions,nutrientconditionsmaydeterioratedue totheincreaseofdairycattleandtheassociatedincreaseofNand Pexcretionsince2012inanticipationontheendofmilkquotain 2015.Thisincreasewillalsoincreaseapplicationofdairymanure andNleaching.
Model calculations furtherindicate that the average nitrate concentrationintheuppergroundwaterofthesandregionwill decreasefrom57to52mg/lin2027andinthesouthernregion from78to68mg/l[53].In2030ammoniaemissionsareexpectedto decreasebyabout10%relativeto2013.Combinedwiththeeffectof reductionofNOxemissionthiswilldecreasethenatureareawhere
criticalNloadsareexceededby7%[54].
Sowithpoliciescurrentlyinplace,theexpectedreductionof pollutionbynutrientswillbesmallcomparedtowhathasbeen achievedduringthepastfewdecades.ThecostsforWFDmeasures are,however,substantial.VanGaalenetal.[7]estimatedthetotal costsofproposedmeasuresfortheWFDtobearound4.1billion eurosfortheperiod2009–2027.Additionalcostsforfarmersare, however,smallbecausetheDutchRBMPshardlycontainany mea-surestoreducenutrientloadsfromagriculture(Section3.6.2).The additionalcostsfortheWFDarethereforeprimarilycoveredby regionalWaterBoardsandhouseholds,whichmayconflictwith thepolluterpaysprinciple[7].
5. Optionsforpoliciestoimprovetargetachievement
Ouranalysisshowsthatconsiderableadditionaleffortisneeded toachieveallenvironmentaltargetsandobjectivesofthethree directives.In this section we describe optionsfor future target achievementandtheircost-effectiveness(i.e.Dperkilogram emis-sionreduction).
ImplementationoftheNitratesDirectivewithrestrictionson theapplicationofNandPwillsignificantlyreduceemissionsto sur-facewatersin2027(Table4).However,thelastNitratesActionPlan (2014–2017)didnotfurthercontributetoreduction ofnutrient emissionstosurfacewatersbecausethisActionPlanwasprimarily
developedtomeetthenitratetargetof50 mg/lingroundwater [[7]; seealso Section4.4]. Restrictionsonapplication are cost-effectivetoreducetheNloadtosurfacewaters,butnotforPin viewoftheslowresponseofPleaching.Tofurtherincreasethe cost-effectivenessofnutrientpolicieswhileminimizingnegative economicimpactsofthesepolicies,applicationstandardscouldbe differentiatedregionally.Criteriafordifferentiationcouldbethe sensitivityofagriculturalsystemstonutrientlossesandproximity ofsensitivehighvalueecosystems.Differentiationofapplication standards may increase the risk of manure fraud. Measures to reducemanurefraudandexceedanceofNandPapplication stan-dardsarethereforenecessary.
To further improve the ecological status of surface waters, a number of additional measures to improve the hydro-morphologicalstatuscouldbetaken.However,VanGaalenetal. [7]concludedthatinmanysurfacewaterbodiesthenutrient sta-tuswillremainthelimitingfactor toachievebiological targets. Measurestoimprovewatertreatmentwouldbeattractivebecause thesearegenerallymorecost-effectivethanmeasurestoreduce nutrient inputs from agricultural fields(Table 4)[39]. Further-more,measurestoreducepointsourcesshowafastresponsewhile responsetomeasurestoreduceagriculturalinputsaregenerally subjecttodelaysofuptodecades.However,measuresin agricul-tureareoftentheonlyoptiontoreducenutrientloadsupstreamor inuplandlakeswherepointsourcesareabsent.
Inadditiontonationalpolicies,regionallydifferentiated miti-gationmeasurestoreducenutrientlossesfromagriculturalsoils couldbeimplemented.Suchoptionscouldincludeinstalmentof bufferzones,miningofphosphorus,(controlled)drainage, preci-sionagricultureandmeasurestoreduceincidentallossesbyrunoff and preferential flow (see Ref. [36] for anoverview of mitiga-tionoptions). Regionalmitigationoptionshave a highemission reductionpotentialandareforphosphorusgenerallymore cost-effectivethangenericrestrictionsonPapplication(Table4).Thisis confirmedinpilotsinitiatedbytheagriculturalsectorinclose co-operationwithregionalauthorities(http://agrarischwaterbeheer. nl/).The challenge is, however, to move from pilot studies to largescaleimplementation.Asmentionedabove,financialsupport could facilitate implementation. Financial incentives are, how-ever,nottheonlykeytosuccess.Awarenessraising,practicability and riskperception areequallyimportant [57].A shifttowards goal-oriented policies that allow farmers greater flexibility in implementingmeasurescouldstimulateinnovationandimprove targetachievement[58,59].
Themostrobustandeffectiveoption forimprovingthe eco-logicalstatusofsurfacewatersinthelongrunisminingofsoil phosphorusbyzeroP-applicationinagriculturalsoilsthataffect sensitivesurfacewaters[60].Thesesoilscompriseabout5–10%of thetotalagriculturalarea[53].Thecostsofminingofsoil phos-phorus are, however, substantial (Table 4).Costs consist of (i)
highercostsformanuredisposalbecausetheareawheremanure can beapplied will be reduced by 5–10%, (ii)lower economic yieldsperhectareduetotheneedtouselowervaluecropsfor miningof soil phosphorus,and (iii) risk of cropyield loss due to soil P-deficiency. These costs are highest for those farmers thathavemanyfieldswithahighsoilPstatusborderingsurface waters.
Thecostsoftheabovemeasuresaresubstantialandmayaffect competivenessoftheagriculturalsector.Onthelongrunpolicies mayneedtobedevelopedtotransferbackpartofthesocietal bene-fitsofreducedNandPemissionstofarmers.Incurrentcommodity andfoodmarketsit is,however,difficulttotransferthecostof cleaneragriculturalproductiontoconsumers.Thequalityofthe finalproductsisnotimprovedbybetternutrientmanagementand consumersaregenerallyunwillingtopayabonus,likethey increas-inglydoforfoodthatwasproducedinananimalfriendlywayorfor organicproducts.Anoptioncouldbetocompensatefarmers; how-ever,financialcompensationschemes,e.g.throughtheCommon AgriculturalPolicyorbynationalregulationrequirelong negotia-tionsandmayconflictwithEUregulationsaboutfaircompetition andopenaccesstomarkets.
Wheretargetscannotbeachievedwithadditionalmitigation optionsorwherefinancialcompensationschemesarenotpossible, politicalchoiceshavetobemadebetweenecologyandfarmingfor theworldmarket.Thiswouldimplythatinregionswhere ecosys-temvaluesarehigh(e.g.Natura2000areas)nutrientinputlevels arelimited byecosystem demands andwill notallow fertilisa-tionratesinaccordancetoagronomicdemand.Intheremaining andlargerpartofregionsnutrientinputsaresetinaccordanceto agronomicdemandandgoodagriculturalpractice.Regionswhere nutrientinputsarelimitedwilldevelopmoreextensiveformsof mixedfarming.Continuationoftheseformsofagricultureismore beneficialforsocietythanstoppingagriculturealtogetherasit pro-videsotherservicesthanfood,suchasregulationofwaterquantity, carbonsequestration and culturalservices [61].A key factorto implementsuchapolicywouldbetoredistributecostsand ben-efitsbetweenspecific groupsof farmers orregions. Thiswould implybetterintegrationoftheCommonAgriculturalPolicywith environmentaldirectives.
6. Conclusions
Implementationof theND hasled to a more balanced fer-tilisationand decreaseofN andPsurpluses. Inresponsetothe decreaseofNsurpluses,alsothenitrateconcentrationinshallow groundwaterdecreased. However,thenitratetarget of 50 mg/l isstill exceededathalfofthemonitoringlocationsinthesand region.DecreasingtrendswerealsofoundforNandPinputsto surface watersbut the number of water bodies where allfour biologicalindicatorsscored“good”wasonly5%.Individual indi-catorsimprovedslightlybutthiswasmostlyduetomeasuresfor theWaterFrameworkDirective(betterperformanceof wastewa-tertreatmentplantsandadjustedhydro-morphology)andnotto reducednutrientlossesfromagriculture.TheNEC-NH3Directive
wasveryeffectivetoreduceemissionsofammoniabutcriticalloads ofnitrogenwerestillexceededinthemajorityofecosystems. How-ever,healthbenefitsofmeasuresreducingtheconcentrationsof ammoniaaerosolsweresubstantial.
Thereisastrongoverlapinecologicalgoalsofthethree direc-tives;however,reductionofdifferentsourcesofnutrientsislaid downinsingleregulatedpolicies.Thispiecemealapproachcauses risksofinefficiencyandstagnationofprogress.Forexample65% ofthecurrentnutrientloadtosurfacewatersiscausedby agri-culturebuttheDutchimplementationoftheWFDhardlycontains measurestoreducenutrientsinputsfromagriculture.Therefore
coordinationofmeasurestoimplementtheND,WFDand NECD-NH3isimportant.
NutrientpolicieshavegeneratednetbenefitsforDutchsociety. Themeanannualcostfornutrientrelatedmeasureswas approxi-mately500millioneuros.Costsweremainlyforthelivestocksector andconsistedofadministrativecosts,costformanuredisposaland costsfordepreciation ofequipment.Annualsocietalbenefitsof ammoniaandnitratepolicieswereestimatedusingawillingness topayapproachandrangedbetween900and3700millioneuro. Theapparentnetbenefitof400–3200millioneurossuggeststhat stricternutrientpoliciesmayhavebeenjustified.
Withpoliciescurrentlyinplace,theexpectedreductionof pol-lutionbynutrientswillbeinsufficienttoreachthegeneralgoalsof thethreedirectives.Theeffectivenessofpoliciescouldbeincreased bybetterenforcementofmanureapplicationstandards.Toreach moretargetsinacost-effectiveway,nationalpolicies(suchas dif-ferentiatedmanureapplicationstandardsandcompulsorymanure processing)should besupplemented by regional measureslike bufferzonesalongwaterbodies,adjusteddrainage,precision agri-cultureand measurestoreduceincidental lossesbyrunoff and preferentialflow.Themostrobustoptionforthelongrunwould beminingofsoilphosphorusbyzeroP-applicationinagricultural soilsthataffectsensitivesurfacewaters.
Wheretargetachievementcannotbecombinedwith competi-tiveagriculture,politicalchoiceshavetobemadebetweenecology andagriculture.Thiswouldimplythatinregionswhere ecosys-temvaluesarehigh(e.g.Natura2000areas)nutrientinputlevels arelimitedbyecosystemdemandsandwillnotallowfertilisation ratesinaccordancetoagronomicdemand.Akeyfactorto imple-ment sucha policywould betoredistributecosts andbenefits betweenspecificgroupsoffarmersorregions.Thiswouldimply betterintegrationoftheCommonAgriculturalPolicywith envi-ronmentaldirectives.
Acknowledgements
We thank theDepartment for Environmental Quality ofthe NationalInstituteforPublicHealthandtheEnvironment(RIVM) fortheuseofresultsoftheMineralsPolicyMonitoringProgramme (LMM) and Arno Hooijboer for his comments. We also thank WageningenUniversityandResearchCentre;MargaHoogeveen, Harrie Luesink and Ton van Leeuwen from the Agricultural EconomicsResearchInstitutefortheuseofdataoftheFarm accoun-tancyDataNetworkandfortheirusefulcomments,andLeoRenaud fromAlterraforprovidingNleachingandrunoffdata.Finally,we thankJohanBouma,emeritusprofessorofsoilscience, Wagenin-genUniversityandourcolleagueSonjaKruitwagenandfortheir suggestionstoimprovethemanuscript.
References
[1]O.Oenema,J.Salomez,C.Branquinho,M.Budnakova,P.Cermak,M.Geupel,P. Johnes,C.Tompkins,T.Spranger,J.W.Erisman,C.Palliere,L.Maene,R.Alonso, R.Maas,J.Magid,M.A.Sutton,H.vanGrinsven,Developingintegrated approachestonitrogenmanagement,in:M.A.Sutton,C.M.Howard,J.W. Erisman,G.Billen,A.Bleeker,P.Grennfelt,H.vanGrinsven,B.Grizzetti(Eds.), TheEuropeanNitrogenAssessment,1sted.,CambridgeUniversityPress, Cambridge,2011,pp.541–550.
[2]O.Oenema,A.Bleeker,N.A.Braathen,M.Budnakova,K.Bull,P.Cermak,M. Geupel,K.Hicks,R.Hoft,N.Kozlova,A.Leip,T.Spranger,L.Valli,G.Velthof,W. Winiwarter,NitrogenincurrentEuropeanpolicies,in:M.A.Sutton,C.M. Howard,J.W.Erisman,G.Billen,A.Bleeker,P.Grennfelt,H.vanGrinsven,B. Grizzetti(Eds.),TheEuropeanNitrogenAssessment,1sted.,Cambridge UniversityPress,Cambridge,2011,pp.62–81.
[3]J.J.Schröder,J.J.Neeteson,NutrientmanagementregulationsinThe Netherlands,Geoderma144(2008)418–425.
[4]H.J.M.vanGrinsven,M.vanEerdt,W.J.Willems,F.Hubeek,E.Mulleneers, EvaluationoftheDutchmanureandfertiliserpolicy1998-2002,in:Evaluating Agri-EnvironmentalPolicies:Design,PracticeandResults,OECDPublishing, Paris,2005,pp.398–410,http://dx.doi.org/10.1787/9789264010116-31-en.
(2014)81–95.
[11]P.J.T.M.vanPuijenbroek,P.Cleij,H.Visser,Aggregatedindicesfortrendsin eutrophicationofdifferenttypesoffreshwaterinTheNetherlands,Ecol. Indic.36(2014)456–462.
[12]H.J.M.vanGrinsven,M.Holland,B.H.Jacobsen,Z.Klimont,M.A.Sutton,W.J. Willems,CostsandbenefitsofnitrogenforEuropeandimplicationsfor mitigation,Environ.Sci.Technol.47(2013)3571–3579.
[13]EFSAPPRPanel,ScientificOpiniononthedevelopmentofspecificprotection goaloptionsforenvironmentalriskassessmentofpesticides,inparticularin relationtotherevisionoftheGuidanceDocumentsonAquaticandTerrestrial Ecotoxicology(SANCO/3268/2001andSANCO/10329/2002),EFSAJ.8(2010) 1821–1876.
[14]EuropeanCommission,DirectiveoftheCouncilofDecember12,1991 ConcerningtheProtectionofWatersAgainstPollutionCausedbyNitrates fromAgriculturalSources(91/676/EEC),EuropeanCommission,Brussels, 1991,pp.1–8.
[15]P.S.Hooda,A.C.Edwards,H.A.Anderson,A.Miller,Areviewofwaterquality concernsinlivestockfarmingareas,Sci.TotalEnviron.250(2000)143–167. [16]W.J.Willems,H.J.M.vanGrinsven,B.H.Jacobsen,T.Jensen,T.Dalgaard,H.
Westhoek,I.S.Kristensen,WhyDanishpigfarmshavefarmorelandandpigs thanDutchfarms?Implicationsforfeedsupplymanurerecyclingand productioncosts(acceptedforAgriculturalSystems01.16).
[17]Anonymous,Directive2000/60/ECoftheEuropeanParliamentandofthe Councilof23October2000establishingaframeworkfortheCommunity actioninthefieldofwaterpolicy,J.Eur.Communities(December(22))(2000) 1–72(Brussels).
[18]C.James,J.Fisher,V.Russell,S.Collings,B.Moss,Nitrateavailabilityand hydrophytespeciesrichnessinshallowlakes,FreshwaterBiol.50(2005) 1049–1063.
[19]J.Geurts,J.Sarneel,B.Willers,J.Roelofs,J.Verhoeven,L.Lamers,Interacting effectsofsulphatepollution:sulphidetoxicityandeutrophicationon vegetationdevelopmentinfens:amesocosmexperiment,Environ.Pollut. 157(2009)2072–2081.
[20]S.M.Gonzales,E.Jeppesen,J.Goma,M.Sondergaard,J.Jensen,T.Lauridsen,F. Landkildehus,Doeshighnitrogenloadingpreventclear-waterconditionsin shallowlakesatmoderatelyhighphosphorusconcentrations,Freshwater Biol.50(2005)27–41.
[21]Anonymous,Directive2001/81/ECoftheEuropeanParliamentandofthe Councilof23October2001onnationalemissionceilingsforcertain atmosphericpollutants,J.Eur.Communities(November(27))(2001)22–30 (Brussels).
[22]S.Bittman,M.Dedina,C.M.Howard,O.Oenema,M.A.Sutton,Optionsfor AmmoniaMitigation:GuidancefromtheUNECETaskForceonReactive Nitrogen,CentreforEcologyandHydrology,EdinburghUK,2014. [23]Anonymous,Directive2010/75/EUoftheEuropeanParliamentandofthe
Councilof24November2010onindustrialemissions(integratedpollution preventionandcontrol),J.Eur.Communities(December(12))(2010)17–119 (Brussels).
[24]EC,Actionstowardsthe‘goodstatus’ofEUwaterandtoreducefloodrisks. CommunicationfromtheCommissiontotheEuropeanParliamentandthe CouncilTheWaterFrameworkDirectiveandtheFloodsDirective,2015. [25]ENDS-Europe,Brusselstellscountriestostepupwaterprotection,BySusanna
Ala-Kurikka(2015)http://www.endseurope.com/39839/.
[26]J.J.Schröder,H.F.M.Aarts,J.C.vanMiddelkoop,R.L.M.Schils,G.L.Velthof,B. Fraters,W.J.Willems,Permissiblemanureandfertilizeruseindairyfarming systemsonsandysoilsinTheNetherlandstocomplywiththeNitrates Directivetarget,Eur.J.Agron.27(2007)102–114.
[27]H.J.M.vanGrinsven,H.F.M.tenBerge,T.Dalgaard,B.Fraters,P.Durand,A. Hart,etal.,Management:regulationandenvironmentalimpactsofnitrogen fertilizationinNorthwesternEuropeundertheNiD;abenchmarkstudy, Biogeosciences9(2012)5143–5160.
[28]S.Wright,C.Mallia,TheDutchapproachtotheimplementationofthenitrate directive:explainingtheinevitabilityofitsfailure,J.Transdiscipl.Environ. Stud.7(2008)1–16.
[34]W.J.Chardon,O.F.Schoumans,Soiltextureeffectsonthetransportof phosphorusfromagriculturallandinriverdeltasofNorthernBelgium,The NetherlandsandNorth-WestGermany,SoilUseManage.23(2007)16–24. [35]G.Tóth,A.Jones,L.Montanarella,TheLUCAStopsoildatabaseandderived informationontheregionalvariabilityofcroplandtopsoilpropertiesinthe EuropeanUnion,Environ.Monit.Asses.185(2013)7409–7425.
[36]O.F.Schoumans,W.J.Chardon,M.E.Bechmann,C.Gascuel-Odoux,G.Hofman, B.Kronvang,G.H.Rubaek,B.Ulén,J.-M.Dorioz,Mitigationoptionstoreduce phosphoruslossesfromtheagriculturalsectorandimprovesurfacewater quality:areview,Sci.TotalEnviron.468-469(468)(2014)1255–-. [37]G.Tóth,R.-A.Guicharnaud,B.Tóth,T.Hermann,Phosphoruslevelsin
croplandsoftheEuropeanUnionwithimplicationsforPfertiliseruse,EurJ. Agron.55(2014)42–52.
[38]L.Renaud,L.Bonten,P.Groenendijk,B.J.Groenenberg,Berekeningvande uit-enafspoelingvannutriëntenenzwaremetalentenbehoevevande emissieregistratie2013.Alterrareport2638.,Alterra,Wageningen,the Netherlands,2014.
[39]W.Ligtvoet,G.P.Beugelink,R.Franken,EvaluationoftheWaterFramework DirectiveintheNetherland;costandbenefits.PBLReport500140004.,PBL, Bilthoven,theNetherlands,2008.
[40]COM,683final,ReportformtheCommissiontotheCouncilandtheEuropean ParliamentontheimplementationofCouncilDirective91/676/EEC concerningtheprotectionofwatersagainstpollutioncausedbynitratesfrom agriculturalsourcesbaseonMemberStatereportsfortheperiod2008–2011. 2013.
[41]F.J.E.vanderBolt,O.F.Schoumans,Ontwikkelingvandebodem-en waterkwaliteit,EvaluatieMeststoffenwet2012:eindrapportex-post. Alterra-rapport2318.,Alterra,Wageningen,theNetherlands,2012. [42]M.A.Sutton,Reviewonscientificunderpinningofammoniaemissionsfactors
andammoniadepositionmodels.(2013)http://www.rijksoverheid.nl/ documenten-en-publicaties/publicaties/2013/05/15/summary-for-the- review-on-scientific-underpinning-of-ammonia-emissions-factors-and-ammonia-deposition-models.html.
[43]J.F.M.Huijsmans,J.J.Schröder,J.Mosquera,G.D.Vermeulen,H.F.M.TenBerge, J.J.Neeteson,Ammoniaemissionsfromcattleslurriesappliedtograssland: shouldapplicationtechniquesbereconsidered?SoilUseManage.(2015), http://dx.doi.org/10.1111/sum.12201.
[44]T.J.deKoeijer,H.H.Luesink,C.H.G.Daatselaar,Synthesemonitoring mestmarkt2006–2012.WettelijkeOnderzoekstakenNatuur&Milieu. WOt-technicalreport18.,2014.
[45]BalansvandeLeefomgeving,PBL.Report500248001.,PBL,TheHague,TThe Netherlands,2012.
[46]AssessmentoftheDutchHumanEnvironment,PBLReport1597.,PBL,The Hague,TheNetherlands,2014.
[47]H.J.M.vanGrinsven,A.Rabl,T.M.deKok,Estimationofincidenceandsocial costofcoloncancerduetonitrateindrinkingwaterintheEU:atentative cost-benefitassessment,Environ.Health9(2010)58.
[48]M.H.Ward,T.M.DeKok,P.Levallois,J.Brender,G.Gulis,B.T.Nolan,J. VanDerslice,Workgroupreport:drinking-waternitrateandhealth-recent findingsandresearchneeds,Environ.HealthPersp.113(2005)1607–1614. [49]W.Smeets,P.Hammingh,J.Aben,DekostenenbatenvoorNederlandvanhet
Commissievoorstelterverminderingvandenationaleemissiesvan luchtverontreinigendestoffenAnalysevanhetvoorstelvan182013,PBL Report1465.,PBL,TheHague,TheNetherlands,2015.
[50]E.P.Weijers,M.Schaap,L.Nguyen,J.Matthijsen,H.A.C.DenierVanDerGon, H.M.tenBrink,R.Hoogerbrugge,Anthropogenicandnaturalconstituentsin particulatematterintheNetherlands,Atmos.Chem.Phys.11(2011) 2281–2294.
[51]EC,ResearchFindingsinsupportoftheEUAirQualityReview. Directorate-GeneralforResearchandInnovation,2013.
[52]C.Brink,etal.,Costsandbenefitsofnitrogenintheenvironment.InEuropean NitrogenAssessment,in:M.A.Sutton,C.M.Howard,J.W.Erisman,G.Billen,A. Bleeker,P.Grennfelt,H.J.M.vanGrinsven,B.Grizzetti(Eds.),Cambridge UniversityPress,Cambridge,U.K,2011,p.612.
[53]P.Groenendijk,L.Renaud,C.vanderSalm,H.Luesink,P.W.Blokland,T.de Koeijer,NitraatenN-enP-uitspoelingbijdegebruiksnormenvanhet5de NAP;ModelberekeningenmetMAMBOenSTONEAlterra-rapport2647., Alterra,Wageningen,TheNetherlands,2015.
[54]PBL,Kostenenbatenvanstrengereemissieplafondsvoor
luchtverontreinigendestoffen.Nationaleevaluatievoordeherzieningvanhet GothenburgProtocol,PBLReport500092002.,PBL,Bilthoven,The
Netherlands,2012.
[55]M.M.vanEerdt,J.Spruijt,E.vanderWal,H.vanZeijts,A.Tiktak,Costsand effectivenessofmeasurestoreduceaqauticrisksfrompesticidesinthe Netherlands,PestManage.Sci.70(2014)1840–1849.
[56]M.P.W.Sonneveld,J.J.Schröder,J.A.deVos,G.J.Monteny,J.Mosquera,J.M.G. Hol,E.A.Lantinga,F.P.M.Verhoeven,J.Bouma,Awhole-farmstrategyto reduceenvironmentalimpactsofnitrogen,J.Environ.Qual.37(2008) 186–195.
[57]M.A.Dolman,M.P.W.Sonneveld,H.Mollenhorst,I.J.M.deBoer,Benchmarking theeconomic:environmentalandsocietalperformanceofDutchdairyfarms aimingatinternalrecyclingofnutrients,J.Clean.Prod.73(2014)245–252. [58]C.vanderSalm,P.Groenendijk,R.F.A.Hendriks,H.T.L.Massop,L.V.Renaud,
OptiesvoorbenuttingvandebodemvoorschoonoppervlaktewaterAlterra Rapport2588.,Alterra,Wageningen,TheNetherlands,2015.
[59]PBL,KwaliteitvoorLater,ExanteevaluatieKaderrichtlijnWater,PBLReport 50014001.,PBL,BilthovenTheNetherlands2008.
[60]PBL,EmissiearmbemestengeëvalueerdPBLReport500155001.,PBL, Bilthoven,TheNetherlands,2009.
[61]A.G.Power,Ecosystemservicesandagriculture:tradeoffsandsynergies, Philos.T.R.Soc.B365(2010)2959–2971.