Lecture 12 Powder Diffraction
Synchrotron powder diffraction
for structural materials science
Eiji Nishibori
Department of Applied Physics, Nagoya University,
Nagoya, Japan
[email protected]
Materials Science
Target Materials.
•Macromolecule,
•Organic molecule,
•Inorganic materials etc,
Materials science is an interdisciplinary field involving the properties of matter
and its applications to various areas of science.
Materials science investigates the relationship between the structure of
materials and their macroscopic properties.
X-ray diffraction crystallography is a method of determining the structure.
X-ray diffraction techniques
•Single-crystal X-ray diffraction
•Powder diffraction
•Thin film & fiber diffraction
Materials Science
Synthesis &
Processing
Property
Performance
Structure
Powder Diffraction
光源 検出器 Electronics ・Condenser ・piezoelectric materials ・semiconductor etc. Thermoelectric materials Laboratory DiffractometerPowder diffraction is an indispensable technique for materials characterization of relatively simple inorganic materials widely used in laboratories.
•Phase identification
•Qualitative structure analysis,
•Measurements of lattice parameters, •Estimation of crystallinity, etc.
The great advantages of the powder diffraction technique:
•
Simplicity of sample preparation
Many materials are readily available for powder diffraction
•
Rapidity of measurement
Collection times can be quite short, since all possible crystal
orientations are measured simultaneously
Powder diffraction is one of the most powerful methods
to identify and characterize new materials
SR Powder diffraction can apply wide variety of materials
Protein Pharmaceuticals Metal organic materials. Nano-carbon materiials Superconductor Semiconductor ThermoelectricsChemistry, Materials Scinece
Acta Cryst. A. 2007 Nature Materials 2004 Phys. Rev. B. 2007 JPSJ. 2001 Nature. 2000 Angew. Chem. 2000,2005 Angew. Chem. 2006 J. Appl. Cryst. 2008
Contents
•
Principle of Powder Diffraction.
•
Advantages of SR powder diffraction.
•
Analytical technique of powder data.
X-ray
X-ray Diffraction from single crystal
Sample
The incident beam coming
from left causes scatter.
Part of the incident beam is deflected,producing a reflection spot in the diffraction pattern like this.
X-ray
X-ray Diffraction from powder crystal
Sample
Detector
aggregate of small single crystals
A set of diffracting beams from crystal planes makes a ring.
Crystals which satisfy the Bragg’s
Powder diffraction data.
If a beam hits a powder sample, we can easily observe a diffraction
pattern by scanning along this line.
2
q
Many rings, actually cones, of diffracted beam are created.
The disadvantages of the powder diffraction technique:
•
Difficult to measure each individual Bragg intensity due to peak
overlap
Many information is lost by the collapse of the 3D space onto a 1D axis.
•
Difficult to measure weak Bragg intensities
such as super lattice & forbidden reflections, reflection in high angle region
Structure determination and Accurate structural analysis from powder diffraction is normally difficult.
Peak Overlap
2
q
This is unavoidable and essential disadvantage of powder diffraction. Peaks are overlapped.
Nb Nc Na
2 1 0 1 0 1 02
exp
Na b c h N k N l crystal Wholei
K
h
a
k
b
l
c
F
K
I
Unit cell a b c g b ac
,
b
,
a
Lattice vectorIntensity from crystal
c
K
sin
c
N
K
sin
b
K
sin
b
N
K
sin
a
K
sin
a
N
K
sin
c
l
b
k
a
h
K
i
exp
a b c N h N k N l a b c
2
2
2
2
2
2
2
2 2 2 2 2 2 2 1 0 1 0 1 0
Intensity from crystal
0.5 1 1.5 0 200 400 600 800 1000 0.5 1 1.5 0 200 400 600 800 1000An Intensity from a crystal proportional to square of the total number of unit cell in the crystal.
Single Crystal : ~100mm Powder Crystal : ~1mm
An Intensity from 1mm powder crystal is much smaller, 1/((100)3)2, than that from
100mm single crystal. Intensity of powder diffraction is much weaker than single crystal diffraction.
Typical size of sample
K
a
Na
K
y
2
sin
2
sin
2 2N
=10
N
=30
2 2K
F
N
I
Wholecrystal
Endohedral Metallofullerene
4 6 8 10 12 0 20 40 601hour @ Lab source
Powder data of novel nano-materials measured at Lab X-ray Source.
Newly synthesized
nano-structured materials are usually obtained in powder form.
two noisy peaks ?
Advantages of SR powder Diffraction
.
High quality powder diffraction data
An X-ray at SR source has great advantages for powder diffraction study. X-ray beam with high-energy resolution and sufficiently high-intensity is available.
Multiple detector system(MDS) at Photon Factory
Each arm has crystal analyzer.
reflection geometry
In the measurement by step scan, it takes much time because of the small step angle. But MDS enables us to measure within rather short time by multiple detectors.
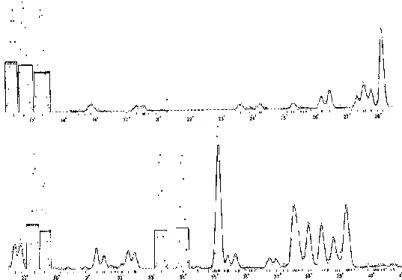
Parts of diffraction patterns of Mg2SiO4
(a) MDS (b) ordinary-type diffractometer
using lab source.
A comparison of three overlapping reflections from Mg2SiO4 , showing a well resolved pattern for the MDS.
ω 2θ Imaging Plate Sample Collimator Shutter X-ray Ion Chamber
SPring-8
Large Debye-Scherrer camera
at SPring-8 BL02B2
Endohedral Metallofullerene
4 6 8 10 12 0 20 40 601hour @ Lab source
3 4 5 6 7
20000 40000 60000
5min @SPring-8
Powder diffraction at SPring-8 has grate advantages in the measurement of small amount of newly synthesized materials.
SR powder diffraction
High quality powder diffraction data
•Phase identification
•Qualitative structure analysis,
•Measurements of lattice parameters, •Estimation of crystallinity, etc.
Quantitative Structure Analysis
• Crystal structure determination • Crystal structure refinement • Charge density StudyStructure Analysis of Powder Diffraction Data
Cell Determination 5 10 15 20 6 1 2 34 8 5 7 9 10 11 12 13 14 Unit CellStructural Refinement Rietveld Method
Structure Determination Direct Method, Direct Space Method
http://home.planet.nl/~rietv025/
Line profiles of neutron powder-diffraction peaks for structure refinement.
H. M. Rietveld,
Reactor Centrum Nederland, Petten, The Netherlands Received 28 July 1966
H. M. Rietveld
Fig. 1. Neutron powder diffraction diagram of WO3 (intensity vs 2q ). The solid line indicates the calculated profile and the dots the measured intensities. The rectangles represent the integrated single-peak intensities, their different heights the agreement between calculated and observed values.
Rietveld method
Acta Cryst. 22, (1967) 151-152
Rietveld refinement is a technique devised by Hugo Rietveld for use in the characterization of crystalline materials. The neutron and x-ray diffraction of powder samples results in a pattern characterized by reflections at certain positions. The height, width and position of these reflections can be used to determine many aspects of the materials structure.
Observed
Calculated Crystal structure
Lattice parameters a, b, c, a, b, g Atomic Coordinates ( xi, yi, zi )
The least-squares refinements are carried out until the best fit is obtained between the entire observed powder diffraction pattern taken as a whole and the entire calculated pattern based on the simultaneously refined models for the crystal structure.
Rietveld method
Fitted
A key feature is the feedback, during refinement, between improving knowledge of the structure and improving allocation of observed intensity to partially overlapping individual Bragg reflections.
Lattice parameters and atomic coordinates are refined using non-linear
least-squares method.
a=5.1335(2)Å b=9.8362(3)Å c=10.6881(3)Å Atom Site x y z B(Å2) Cu 2a 0.794(1) 0.926(5) 0.518(1) 0.9(1) O1 2a 0.779(3) 0.912(2) 0.703(1) 0.8(3) O2 2a 0.139(3) 0.039(1) 0.667(1) 0.8(3) C1 2a 0.943(3) 0.975(2) 0.741(1) 1.4(2) C2 2a 0.920(3) 0.964(2) 0.888(1) 1.4(2) H1 2a 0.752(3) 0.894(2) 0.939(1) 1.4(2) C3 2a 0.853(3) 0.112(2) 0.907(2) 1.4(2) H2 2a 0.000(3) 0.182(2) 0.849(2) 1.4(2) ... ... ...
i i i iy
f
w
S
(
x
)
[
(
x
)]
2Minimize
Example of refiend parameters
The Rietveld refinement plays an central role of the structure study from
powder diffraction.
Protein Pharmaceuticals Metal organic materials. Nano-carbon materiials Superconductor Semiconductor Thermoelectrics Acta Cryst. A. 2007 Nature Materials 2004 Phys. Rev. B. 2007 JPSJ. 2001 Nature. 2000 Angew. Chem. 2000,2005 Angew. Chem. 2006 J. Appl. Cryst. 2008
SR powder diffraction
Small
Large
rough
accurate
Charge density Study
Determination of
Disordered Structure
Ab-initio
SR powder structural studies
•
Accurate charge density study of silicon and
diamond.
•
Structural analysis of high performance
thermoelectrics Zn
4
Sb
3.
Accurate Structural Study
2 2)
2
exp(
)
(
)
(
)
(
F
i
dv
I
Cell Unitr
k
r
k
k
The electron density distribution in materials determines their properties and functions. Many attempts of both experimental and theoretical researches in materials science have been performed to reveal the electron density distributions.
An X-ray is a very good probe of electrons. The structure factors from X-ray diffraction give
information of total electron density distribution including both the core and the valence electrons.
Si
Structure Factors and Charge Density of silicon from SPring-8 Powder Data
•
Powder data
dynamic range, resolution
•
Structure factors
compared with other experimental & theoretical data
•
Valence charge density
compared with theoretical dataPowder data of Silicon measured at SPring-8 BL02B2.
Data Range (2q 0~75.0° 40~105.0°(Maximum)
0
20
40
60
80
0
200000
400000
600000
800000
1000000
40 50 60 70 80 90 0 20000 40000 60000 800002
q
Deg. )
First Data : D1 (Normal Procedure) Second Data: D2 X-ray X-ray IP IP Sample Sample(moving the IP cassette)
14.4 14.6 14.8 15 15.2 2800 3000 3200 3400 2 2 2 Forbidden reflection I(2 2 2) / I(1 1 1) =0.0005 T = 300K = 0.4Å d > 0.31 Å
Comparison between Powder data and Saka&Kato’s data
0 2 4 6 8 10 12 0 0.2 0.4 0.6 0.8 1 1.2 1.4 1.6SPring-8 Powder data (104 bragg reflections) Saka and Kato's data (28 bragg reflections)
Amp litu d e of a tomic sc at terin g fac tor sinθ/λ [Å-1]
HF: Hartree-Fock, LP:LDA(exchange) and Perdew–Zunger(correlation), PW(GGA): Perdew–Wang(exchangeandcorrelation) The Saka & Kato’s Pendellousung data is one of the most accurate data from experiment.
Saka & Kato Acta Cryst. A. (1986)
The values of SPring-8 data well agreed to Saka and Kato’s data
h k l HF LP PW 1 1 1 10.61 (1) 10.622 10.600 10.607 2 2 0 8.39 (1) 8.396 8.408 8.404 3 1 1 7.68 (2) 7.691 7.715 7.710 2 2 2 0.21 (4) 0.196 0.131 0.145 4 0 0 7.00 (3) 7.029 7.011 7.018 3 3 1 6.81 (2) 6.773 6.714 6.731 4 2 2 6.16 (2) 6.151 6.115 6.127 3 3 3 5.81 (4) 5.802 5.787 5.795 5 1 1 5.82 (2) 5.844 5.810 5.822 4 4 0 5.38 (3) 5.382 5.349 5.360 5 3 1 5.11 (2) 5.110 5.085 5.094 6 2 0 4.68 (2) 4.719 4.696 4.704 5 3 3 4.50 (3) 4.508 4.484 4.492 4 4 4 4.18 (4) 4.169 4.149 4.155 5 5 1 3.98 (3) 3.986 3.967 3.972 7 1 1 3.98 (3) 3.981 3.963 3.970 6 4 2 3.69 (2) 3.698 3.682 3.688 5 5 3 3.52 (3) 3.543 3.527 3.533 7 3 1 3.52 (4) 3.543 3.527 3.533 8 0 0 3.23 (5) 3.302 3.287 3.286 7 3 3 3.12 (4) 3.169 3.154 3.154 6 6 0 2.95 (4) 2.960 2.949 2.954 8 2 2 2.95 (3) 2.962 2.949 2.948 5 5 5 2.83 (7) 2.844 2.835 2.838 7 5 1 2.85 (3) 2.848 2.834 2.833 8 4 0 2.67 (3) 2.670 2.659 2.658 7 5 3 2.57 (3) 2.571 2.561 2.559 9 1 1 2.56 (4) 2.573 2.563 2.561 6 6 4 2.43 (3) 2.418 2.410 2.414 8 4 4 2.19 (3) 2.199 2.191 2.189 8 8 0 1.60 (5) 1.564 1.559 1.555 Powder f(h k l) h k l 1 1 1 -60.4 (1) -60.0 (1) -60.13 (5) 2 2 0 -68.3 (1) -67.2 (1) -67.34 (5) 3 1 1 -44.3 (1) -43.4 (1) -43.63 (3) 2 2 2 1.6 (3) 1.6 (3) 4 0 0 -57.7 (2) -56.0 (2) -56.23 (4) 3 3 1 39.7 (1) 38.5 (1) 38.22 (3) 4 2 2 51.3 (1) 49.3 (1) 49.11 (4) 3 3 3 34.5 (2) 32.9 (2) 32.83 (2) 5 1 1 34.5 (1) 32.9 (1) 32.94 (2) 4 4 0 45.5 (2) 43.1 (2) 42.88 (3) 5 3 1 30.7 (1) 28.9 (1) 28.81 (2) 6 2 0 40.3 (2) 37.4 (2) 37.59 (6) 5 3 3 -27.5 (2) -25.5 (2) -25.36 (4) 100K 300K 294K F(h k l)
Powder Powder Saka Kato
The values of structure factors are agreed to Saka&Kato’s data within experimental errors
MEM Imaging
h k l d(Å) Fobs 1 1 1 3.136 60.13(5) 2 2 0 1.920 67.34(5) 3 1 1 1.638 43.63(3) 4 0 0 1.358 56.23(4) 3 3 1 1.246 38.22(3) 4 2 2 1.109 49.11(3) 3 3 3 1.045 32.83(2) 5 1 1 1.045 32.94(2) 4 4 0 0.960 42.88(3) 5 3 1 0.918 28.81(2) 6 2 0 0.859 37.59(6) 5 3 3 0.828 25.36(4) 4 4 4 0.784 33.18(5) 5 5 1 0.761 22.42(3) 7 1 1 0.761 22.37(3) 6 4 2 0.726 29.42(4) 7 3 1 0.707 19.90(3) 5 5 3 0.707 19.98(3) 8 0 0 0.679 26.23(4) 7 3 3 0.664 17.83(3) 6 6 0 0.640 23.48(4) 8 2 2 0.640 23.48(4) 5 5 5 0.627 15.98(2) 7 5 1 0.627 15.98(2) 8 4 0 0.607 21.15(3) 7 5 3 0.596 14.43(2) 9 1 1 0.596 14.46(2) 6 6 4 0.579 19.13(3)Structure Factor for Si
by
Pendellösung
Method
T. Saka and N. Kato Acta. Cryst. A42(1986)MEM
0.1 ~2.0,0.1[e/Å3] step
M.Sakata and M.Sato
Acta. Cryst. A46(1990)
MEM for Diffraction Crystallography.
n
n
n
Unit Cell
Charge & Nuclear
Densities
The unit cell was dividing into the pixels. The density at each pixel is treated as information.
A dimensionless density, 'k, defined as
(1) Qtot :the total charge in the unit cell.
The entropy for the information of density S() is defined as
(2)
The MEM searches for the density distribution k which maximizes the entropy under following condition: FMEM(hj) agree with Fobs(hj) within sj.
(3) FMEM(hj) calculated from the MEM density are given by
(4)
By using Lagrange's method of undetermined coefficients, this problem is reduced to solving simultaneous equations:
(5) tk : the prior density. Equations (3), (4) and (5) are solved iteratively.
tot k k / '
Q
pix N k k k log ' ' -) S( 1 | ) (h F -) (h F | 1 1 ) C( obs j MEM j 2 M 1 j 2 j ref
s ref M ) r ih exp(2 ' VQ ) (h F j k N 1 k tot j MEM pix
k k k k C ' exp ' t Charge Density at Bond mid-point of theoretical valence density
Si
: 0.55
~
0.59eÅ
-3Diamond
:1.53
~
1.69eÅ
-3Valence density based on experimental charge density.
0.56e
Å
-31.64e
Å
-3Yin M. T. And Cohen M. L., PRB26 (1982). Van Camp P. E., et al., PRB34,(1986)., Christensen N. E. et al., PRB36 (1987). , etc.
E. Nishibori et al., Acta. Cryst. A (2007)
The facts can be regarded that the charge densities from SPring-8 powder data are quantitative reliable and can be used to discuss the physical properties of materials.
High performance thermoelectrics Zn
4
Sb
3
s
2TS
ZT
T. Cailat et al, J. Chem. Phys. Solid.(1997)
Tm=670K,(ZT)m=1.3
σ : Electrical conductivity
κ : Thermal conductivity
S : Seebeck coefficient
T : Temperature
Extraordinary low thermal conductivity
site
Sb1 18e Sb(89%)/Zn(11%) Sb2 12c Sb(100%)
Zn 36f Zn(100%)
Structure of Zn4Sb3 by H. W. Mayer et al(1978)
Density 6.21(g cm
–3)
Zn
xSb
3x=4.07
Structural study of Zn
4
Sb
3
Thermoelectric
RI=2.2%
Disorder Structure of Zn Density(gcm-3) 6.37
Atom Site X/a Y/b Z/c Occupancy Zn(A) 36f 0.07915(4) 0.24483(6) 0.40273(5) 0.899(1) Zn(B) 36f 0.1782(8) 0.434(1) 0.030(1) 0.068(1) Zn(C) 36f 0.2391(7) 0.4553(8) 0.2093(3) 0.068(1) Zn(D) 36f 0.131(1) 0.233(1) 0.278(1) 0.033(1) Sb(1) 18e 0.35559(3) 0 0.25 1.0 Sb(2) 12c 0 0 0.13646(2) 1.0 Nature Materials.(2004)
Chemistry - A European Journal (2004).
The structure determined in the present study reveals disordered interstitials as an effective mechanism for low thermal conductivity that makes Zn4Sb3 the highest zT thermoelectric in the 150–400℃ temperature range.
Direct Space Method
Torsion Angle(
t
)
X
Y
t
X
Y
Z
q
f
j
X
Z
Y
Z
t
The structure is defined by a rigid body of molecule.
If the molecular conformation is not known, it is necessary to include a
number of torsion angles as parameters.
Structure Determination from Powder Diffraction data. (SDPD)
SDPD has attracted wide interests for its huge potential to accelerate a design, synthesis, and characterization of the materials in the fields of materials science.
Trial structures are randomly generated in real space at first.
Calculate powder data
x
1
,
y
1
,
z
1
,
q
1
,
f
1
,
1
x
2
,
y
2
,
z
2
,
q
2
,
f
2
,
2
x
3
,
y
3
,
z
3
,
q
3
,
f
3
,
3
Comparison between observed and calculated data
Optimization methods.
•Monte Carlo
•Simulated Annealing
Intermediate Population : (Np+2Nm)
Next Cycle Population : Np Population : Np Mutation : Nx Natural Selection : (Np-Nx) Mating : 2Nm Copy : Np Initial Population:Np
GA for SDPD
( K. D. M. Harris et. al.,)
M. Sakata and E. Nishibori, JP2005-350770, M. Sakata and E. Nishibori, PCT/JP2006/324614
+
Blend cross over(BLX-
a
)
Minimum generation gap(MGG)
Partial minimization
etc.
Prednisolone Succinate, C25H32O8 Space Group I2, Cell Volume 4622.4(2) Å3
Number of molecule in asymmetric unit = 2
Number of atoms[65
×
2]=130
Number of Torsion angle = 7
DOF[(6+7)
×
2-1]=25
SDPD for large systems with more than 100
atoms and 20 degrees of freedom(DOF) is
very difficult.
Final result of Refinements
RWP= 1.29 %
RI= 4.80 %
d > 1.03 Å
There were no unreasonable bond distances and bond angles in the refined structure.
400 K
Complicated molecular structure with more than 20 DOF and 100 atoms can be routinely solved from SPring-8 powder data.
The fittings of whole parts including higher angle region are satisfactory as an accurate structural analysis.
Summary
The structural changes induced by an external field
•Temperature
•Light
•Gas/and Solvent absorption
SR Powder structural study now covers wide area of materials science.