An Analysis Of The Comparative
Predictive Abilities Of Operating
Cash Flows, Earnings, And Sales
Charles E. Jordan, (E-mail: [email protected]), University of Southern Mississippi Marilyn A. Waldron, (E-mail: [email protected]), University of Otago, New Zealand
Stanley J. Clark, (E-mail: [email protected]), University of Southern Mississippi
ABSTRACT
Prior studies (e.g., Greenburg et al., 1986; Murdoch and Krause, 1989) provide evidence that earnings outperforms historical cash flows in predicting future cash flows. Later research (e.g., Barth et al., 2001) demonstrates that the major accrual components of earnings each possess significant explanatory power in predicting future cash flows and that they augment, rather than replace, the predictive ability of aggregate earnings. The current study furthers this work by examining the predictive power of another major component of earnings, i.e., sales. Using share price as the dependent variable and as a proxy for future cash flows, this study compares the predictive abilities of changes in operating cash flows, earnings, and sales. Similar to the findings in prior research, earnings predicts better than operating cash flows. More importantly, however, sales predicts with greater accuracy than either operating cash flows or earnings.
INTRODUCTION
arnings occupies a focal point in financial accounting research. For example, a simple search on EBSCOhost’s Business Source Elite database, which references articles in 1,125 business-related journals dating back to 1985, looking for articles containing the word “earnings” in the title resulted in 11,779 hits. Another 1,694 articles were added when “net income” was used as the search term instead of “earnings.” Compare this to only 222 articles containing the words “cash flows” in the title. This emphasis on earnings in the literature exists for many reasons. It is, of course, the most widely accepted measure of firm performance and, therefore, by default is the subject of much interest.
` Attention is also given to earnings because it is commonly used in evaluating management performance. Perhaps the biggest reason for the attraction to earnings, though, lies with the notion that earnings serves as a predictor of future cash flows. The FASB clearly stated this belief in Concepts Statement No. 1 in 1978 when it noted that accrual earnings represents a better predictor of future cash flows than historical cash flows. A company’s very existence depends on its ability to generate positive cash flows, and research has demonstrated that share price is directly related to an entity’s cash flow prospects. Thus, because earnings is viewed as a primary predictor of future cash flows, it is also a key determinant of share price.
However, recent research (e.g., see Barth et al., 2001) has shown that the predictive ability of earnings can be improved when it is disaggregated into its major accrual components. One of these components is sales revenue, which surprisingly has been largely ignored in the literature as a predictor of future cash flows and share price. This study provides an analysis of the comparative predictive abilities of operating cash flows, earnings, and sales in terms of their relationship with share price.
PRIOR RESEARCH
It is widely accepted in the finance literature that market forces determine share price equal to the discounted value of a stream of expected future cash flows (Hollister et al., 2002). These cash flows represent amounts investors expect to receive in the form of dividend payments or from the sale of their shares and not necessarily the annual operating cash flows generated by a firm. Thus, it is in a very broad sense that share price is considered to embody a firm’s future cash flows. Although share price is often thought of and evaluated in terms of cash flows, earnings is also known to be extremely important to managers and analysts because of the key information it conveys about future prospects (Brigham and Ehrhardt, 2002).
Significant research (e.g., see Watts, 1977; Dechow, 1994; Bartov et al., 1997) suggests that earnings reflects a stronger correlation with value (i.e., share returns) than does current operating cash flows. Although the above researchers examine value in terms of share returns, Dechow (1994) notes that the substitution of raw stock prices provides analogous results. Studies have also shown that earnings better predicts future operating cash flows than does current operating cash flows (e.g., see Greenburg et al., 1986; Murdoch and Krause, 1989; Dechow, et al., 1998). The reasoning for this is because accruals in earnings “offset the negative correlation in cash flow changes to produce earnings changes that are much less negatively serially correlated (Dechow, et al., 1998, p. 163).” Dechow et al. (1998) explain that this is why earnings, rather than current operating cash flows, tends to be used in firm (i.e., share) valuations.
Extending the notion developed by Dechow et al. (1998) that accruals within earnings enable earnings to outperform operating cash flows in predictions, Barth et al. (2001) examined the major accrual components of earnings. They disaggregated earnings into its cash flow component and six major accrual components of earnings (i.e., change in inventory, change in accounts receivable, change in accounts payable, depreciation, amortization, and other accruals). The Barth et al. (2001) premise for disaggregating earnings into these components was that aggregate earnings masks information contained in the individual components and that each major component of earnings reflects different or unique information about future cash flows. Their results showed that each of the six accrual components was significant in predicting future cash flows. Furthermore, their models with earnings disaggregated into the six accrual components and the cash flow component markedly outperformed models developed with aggregate earnings in terms of predicting future cash flows.
Al-Attar and Hussain (2004) extended the work of Barth et al. (2001) to examine U.K. entities. Like Barth et al. (2001), they found that disaggregating earnings into its major accrual components and cash flow component produced models with explanatory power superior to that of aggregate earnings relative to predicting future cash flows.
Hollister et al. (2002) also expanded the work of Barth et al. (2001) by examining companies in the U.S., U.K., Germany, and Japan. They included countries other than the U.S. because they believed the accrual components of earnings would be less important in predicting future cash flows for these countries compared to the U.S. This is because earnings in the non-U.S. countries must conform more to reported taxable income or are subject to greater earnings management than in the U.S. Unexpectedly, though, Hollister et al. (2002) discovered that, for every country examined, earnings disaggregated into the major accrual components and the cash flow component predicted future cash flows better than either current operating cash flows or aggregate earnings.
The above studies that examined disaggregated earnings revealed that variables in addition to earnings and operating cash flows may be useful in predicting future cash flows or share price. Sales revenue represents another potential predictor. It is an accrual basis performance measure in the broadest sense in that the vast majority of a company’s operating cash flows emanates from its sales. Succinctly stated, growth in sales should translate into increasing future cash flows, while declining sales suggests future cash flows will diminish. Although only a paucity of research exists on the relationship between sales and future cash flows or share price, a few studies indicate that further examination of this relationship is worthwhile.
For example, Kaplan (1994), even though not examining the relationship between sales and cash flows or share price, showed that sales performance measures, earnings, and stock returns are all key factors in top executive compensation and turnover. Dechow and Dichev (2002) and Francis et al. (2004) note that earnings quality can be affected by sales volatility. Generally, the greater the sales volatility, the more unstable is the operating environment. This results in larger estimation errors for accruals and diminished earnings quality.
Olsen and Dietrich (1985) demonstrate that monthly sales announcements of major department and discount stores provide information for investors not only for the retail giants but also for their suppliers. The sales volume announcements for the retailers furnish information on the future cash flow prospects for their suppliers and, thus, are incorporated into the suppliers’ share prices. Dharan (1987) investigated the comparative abilities of accrual sales and cash collections of sales to predict future cash flows. He shows that, when cash realization occurs in a period subsequent to sales realization, cash flow forecasts from earnings based on accrual sales are better than cash flow forecasts from earnings based on cash collections. This is because accrual sales “provides information on management’s expectations about future cash flows (Dharan, 1987, p. 445).”
The studies noted above by Barth et al. (2001), Al-Attar and Hussain (2004), and Hollister et al. (2002) provide strong evidence that accrual components of earnings provide significant explanatory power in relation to future cash flows or share price. Research on accrual sales (e.g., Olsen and Dietrich, 1985; Dharan, 1987) suggests that this component of earnings may provide important information about future cash flows and, thus, share price. The current study endeavors to determine the ability of accrual sales to predict share price relative to that of earnings and current operating cash flows.
METHODOLOGY
To evaluate the predictive ability of sales relative to that of earnings and current operating cash flows, data were collected on a randomly selected sample of 100 of the Fortune 1000 companies. The data collected included earnings (as measured by after-tax income from operations), operating cash flows, and net sales for the years 2002 and 2003. The data were obtained from the entities’ 10-k reports available on the Securities and Exchange Commission’s EDGAR (Electronic Data Gathering and Retrieval) system. Also collected was the share price for each company as of three months following the 2003 financial reporting year end. For example, for an entity with a calendar year end the stock price was determined as of March 31, 2004.
The sample was selected from among the Fortune 1000 companies because these entities represent a broad cross section of publicly-traded corporations. Thus, the results from the study should be generalizable to most publicly-held entities. The three predictor variables examined were as follows:
% change in cash flow from operations from 2002 to 2003 (CFO). % change in earnings from 2002 to 2003 (EARN).
% change in net sales from 2002 to 2003 (SALES).
The changes in the variables were examined instead of their dollar amounts because the changes should signal more information about the future than would amounts existing at one point in time. For example, an increase in sales would indicate that future cash flows should increase as the sales are collected, while a dollar amount of sales alone provides little information about the direction of future cash flows. To evaluate their relative predictive abilities, the three explanatory variables were regressed on the share price existing three months subsequent to the 2003 reporting year end using ordinary least squares (OLS) regression. Share price was chosen as the dependent variable not only because of its obvious importance in the financial literature but also because it proxies for a firm’s future cash flows in the broadest sense. Additional justification for using share price as the dependent variable lies with previous research (e.g., see Dechow et al., 1994) that recognizes share value in terms of abnormal returns as a piece of information critical to investors. Dechow et al. (1994) predicted both stock returns and raw stock prices and found little difference in the results. Thus, the current study uses raw stock prices, rather than stock returns, as the measure of share value predicted.
Selecting a date three months after the 2003 year end to determine share price allowed sufficient time for the information in the 2003 financial statements to be fully impounded into the share price. Without question, choosing an appropriate date for predicting share price is crucial because factors other than a company’s future cash flow prospects may impact share value. For example, economic indicators, such as interest rates or unemployment rates, or world events, such as oil prices established in the Middle East, can affect share price. However, using a specific date for examining share price for all companies should result in these exogenous factors becoming less important as a determinant of share price than if multiple dates were chosen. This is because exogenous factors existing as of a particular date might produce an overall market reaction affecting all securities but would produce little differentiation in share price among the companies in the sample.
RESULTS
Table 1 provides the correlation matrix for the dependent variable (i.e., share price three months subsequent to the 2003 year end) and the three predictor variables under study (i.e., CFO, EARN, and SALES). Three important points can be gleaned from this matrix. First, little collinearity exists among the three explanatory variables, with correlation coefficients ranging from .0253 for CFO and SALES to .0641 for EARN and SALES. This finding is worth noting because it demonstrates that the three independent variables have little in common in terms of explanatory power; they each possess unique information.
Table 1
Correlation Matrix For Share Price, CFO, EARN, And SALES
Share price CFO EARN SALES
Share price 1
CFO -.0711 1
EARN .1912 .0376 1
SALES .2094 .0253 .0641 1
Second, notice that SALES exhibits the strongest correlation (.2094) with share price of all the predictor variables. It is followed closely by EARN with a correlation coefficient of .1912. As expected, both of these variables exhibit positive correlations with share price, suggesting that increases in EARN and SALES between years result in higher share values. Third, the matrix reveals that a relatively weak relationship (coefficent = -.0711) exists between CFO and share price. Furthermore, the negative sign of this coefficient was unexpected.
Table 2 presents a multiple regression model containing all three independent variables regressed on share price; also shown are the summary statistics for the model and its variables. The alpha level (.3986) for the t-statistic for CFO reveals that this variable is not significantly related to share price, at least when in the company of EARN and SALES. Again, note that CFO possesses a negative coefficient when, in theory, a positive coefficient would be expected. The negative coefficient implies that an increase in operating cash flows during the year results in a lower share price. The standard error of the estimate for CFO was .002702, which is larger than the coefficient itself (i.e., -.00229). This relatively large standard error may explain the negative coefficient. More specifically, the large standard error suggests the coefficient could change dramatically in repeated samplings, producing a negative sign at times and a positive sign at other times.
The coefficients for EARN and SALES are correctly (i.e., positively) signed. In addition, using traditional measures of significance, the t-statistics for EARN and SALES indicate that these variables are significantly related to share value as they produce alpha levels of .0672 and .0441, respectively. Similar to the results demonstrated in the correlation matrix, though, SALES exhibits the strongest association with share price of the three independent variables as evidenced by its larger t-statistic. The overall model produces a statistically significant F ratio (i.e., alpha level = .040).
Table 2
Multiple Regression Model and Its Summary Statistics Regression model:
Share price = 32.06532 - .00229*CFO + .003212*EARN + .115635*SALES Summary statistics:
t-statistic level for t
CFO -.85 .3986
EARN 1.85 .0672
SALES 2.04 .0441
Model F ratio = 2.08 level for F ratio = .040 Model R2 = .0825
To examine further the comparative predictive abilities of operating cash flows, earnings, and sales, a simple regression model was developed for each independent variable regressed on share price. The results appear in Table 3. With an alpha level of .482, the F ratio for the CFO model clearly demonstrates that the change in operating cash flows possesses a statistically insignificant relationship with share price. With alpha levels of .057 and .037, respectively, the F ratios for the EARN and SALES models make evident the statistically significant relationship that exists between these variables and share price. Again, note that SALES exhibits the stronger relationship with share price between the two.
Table 3
Simple Regression Models and Their Summary Statistics
Independent Model level for
Variable Regression equation F ratio F ratio Model r2
CFO Share price = 33.31672 - .00196*CFO .50 .482 .0051
EARN Share price = 33.22203 + .00338*EARN 3.72 .057 .0366
SALES Share price = 31.49441 + .12115*SALES 4.49 .037 .0439
Goodness of fit (i.e., r2) provides an indication of the variation in the dependent variable being explained by the independent variable(s) in a regression model. It is often used as a measure of the comparative predictive abilities among models (e.g., see Greenburg et al., 1986; Murdoch and Krause, 1989; McBeth, 1993). Generally, the higher the r2, the greater is the predictive power of a model. Using r2 as a gauge of explanatory power, Table 3 suggests that SALES possesses superior ability over both CFO and EARN in terms of predicting share price. Lorek and Willinger (1996), Cheung and Krishnan (1997), and Neter and Wasserman (1974) note, however, that models with higher r2s may not necessarily be the best predictors. This is because even a model with a high r2 may have a mean square error that is too large for inferences to be drawn when accurate predictions are needed (Neter and Wasserman, 1974, p. 229). Akresh and Wallace (1982) state that predictive ability is best examined not only by evaluating a model’s r2 but
To perform an analysis of residuals, the percentage prediction errors (PPEs) for the three models were evaluated. For each observation in the sample, a PPE was computed in absolute value as follows:
PPE = (actual share price – predicted share price) * 100 actual share price
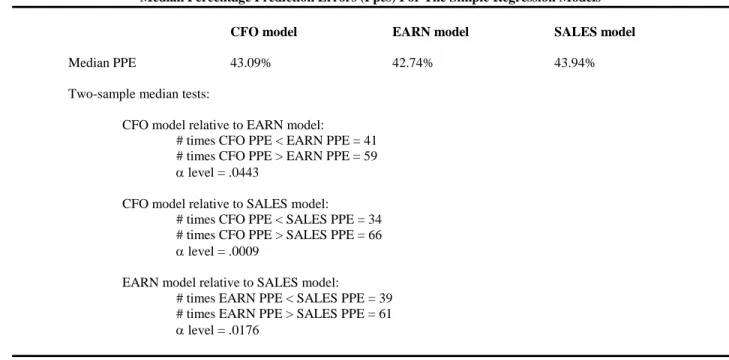
A model producing low PPEs, overall, relative to other models would be considered a superior predictor. Table 4 presents median PPEs for the 100 companies for each of the three simple regression models. Medians are used as the summary measure for the models’ PPEs rather than means because means can be unduly influenced by a few extreme values. Medians are much less affected by outlying observations and, therefore, are often considered more representative of a group than are means.
Table 4
Median Percentage Prediction Errors (Ppes) For The Simple Regression Models CFO model EARN model SALES model
Median PPE 43.09% 42.74% 43.94%
Two-sample median tests:
CFO model relative to EARN model:
# times CFO PPE < EARN PPE = 41 # times CFO PPE > EARN PPE = 59 level = .0443
CFO model relative to SALES model:
# times CFO PPE < SALES PPE = 34 # times CFO PPE > SALES PPE = 66 level = .0009
EARN model relative to SALES model:
# times EARN PPE < SALES PPE = 39 # times EARN PPE > SALES PPE = 61 level = .0176
Note from Table 4 that the median PPEs for the models exhibited little variation, which on the surface suggests that there is a diminutive difference among the models in terms of their abilities to predict share price. However, a two-sample median test reveals otherwise. This non-parametric test examines the directional difference between two populations of numbers and considers every observation in the group. For example, in Table 4, observe in the comparison between the CFO and EARN models that the PPE for the CFO model was larger than the PPE for the EARN model for 59 of the observations. The reverse was true only 41 times. Thus, the EARN model produces a smaller PPE than the CFO model much more often than not, which indicates that the EARN model is a superior predictor of share price relative to the CFO model. In addition, the alpha level of .0443 shows that this directional difference in the PPEs between the CFO and EARN models does not occur due to random chance.
Similarly, the SALES model outperforms the CFO model by producing lower PPEs for 66 of the 100 observations; the alpha level of .0009 reveals that this directional difference is statistically significant as well. All prior tests have indicated that both EARN and SALES are better predictors of share price than CFO; the two-sample median tests of PPEs confirm these earlier results. The previous tests also suggested that SALES might have a slight advantage over EARN as a predictor of share price. Table 4 shows that this advantage is more than slight as, relative to the EARN model, the SALES model provided predictions with lower PPEs 61 times out of 100. The alpha level of
.0176 indicates that this result does not occur due to random chance but rather because the SALES model is a more accurate predictor of share price, in general, than is the EARN model.
It should be noted that predicting values for dependent variables with data used in developing the models may result in an upward bias in prediction accuracy. Any such prediction bias in this study, though, is viewed as relatively unimportant because the sample size is large enough at 100 observations to mitigate the effect that any one observation would produce on the model’s coefficients. Also, all three models would suffer from the same upward bias, thus largely negating the effect of this bias for comparative purposes.
SUMMARY AND CONCLUSION
Prior research has shown that the major accrual components of earnings possess significant explanatory power in terms of predicting future cash flows apart from aggregate earnings. The accrual components in the previous studies included the change in accounts receivable, change in inventory, change in accounts payable, depreciation, amortization, and other accruals. The previous studies did not, however, examine the unique predictive ability of sales. Because the majority of an entity’s operating cash flows derives eventually from its sales, it seems that this measure of financial performance could represent perhaps the most crucial component of accrual earnings with respect to its ability to predict future cash flows.
With share price as a proxy for future cash flows, and as such the dependent variable, the current study uses OLS regression to evaluate the comparative predictive abilities of changes in operating cash flows, earnings, and sales. Operating cash flows provided the weakest explanatory power of the three, and its relationship with share price was not only statistically insignificant but was also incorrectly signed, at least according to conventional wisdom. Both the earnings and sales models produced statistically significant results, and their coefficients were correctly signed. In terms of prediction accuracy, though, the sales model outperformed the earnings model by generating lower residuals for the majority of the companies in the sample. Prior research demonstrated that disaggregating earnings into its major accrual components enhances its predictive ability. The current study clearly shows that sales should be considered as one of these unique accrual components adding explanatory power to the traditional earnings model.
SUGGESTIONS FOR FUTURE RESEARCH
Share price was used as the dependent variable in the current study because it is commonly thought to proxy for future cash flows. Results might have been different if actual cash flows had been used as the dependent variable. Thus, to evaluate the veracity of this study’s results, future research could replicate the study using operating cash flows one or more years ahead as the predicted variable.
The models in this study were developed with cross-sectional data for 100 publicly-traded companies so that results would be generalizable to other public entities. Future research could examine the relative predictive abilities of the three independent variables using time series data over several years or quarters for single entities. Such an analysis could reveal whether the superiority of individual predictor variables is company specific.
REFERENCES
1. Akresh, A. and W. Wallace, The Application of Regression Analysis for Limited Review and Audit Planning, Symposium on Audit Research IV, University of Illinois at Urbana – Champaign, pp. 43-68, 1982. 2. Al-Attar, A. and S. Hussain, Corporate Data and Future Cash Flows, Journal of Business Finance &
Accounting, Vol. 31, Nos. 7 & 8, pp. 861-903, 2004.
3. Barth, M., D. Cram, and K. Nelson, Accruals and the Prediction of Future Cash Flows, The Accounting Review, Vol. 76, No. 1, pp. 27-58, 2001.
4. Bartov, E., S. Goldberg, and M. Kim, The Valuation-Relevance of Earnings and Cash Flows: An International Perspective, Working paper, New York University, 1997.
5. Brigham, E. and M. Ehrhardt, Financial Management, Theory & Practice, South-Western, South Melbourne, Victoria, 2002.
6. Cheung, J. and G. Krishnan, Does Interperiod Tax Allocation Enhance Prediction of Cash Flows, Accounting Horizons, Vol. 11, No. 4, pp. 1-15, 1997.
7. Dechow, P., Accounting Earnings and Cash Flows as Measures of Firm Performance: The Role of Accounting Accruals, Journal of Accounting and Economics, Vol. 18, No. 1, pp. 3-42, 1994.
8. Dechow, P. and I. Dichev, The Quality of Accruals on Earnings: The Role of Accrual Estimation Errors, The Accounting Review, Vol. 77, supplement, pp. 35-59, 2002.
9. Dechow, P., S. Kothari, and R. Watts, The Relation Between Earnings and Cash Flows, Journal of Accounting and Economics, Vol. 25, No. 2, pp. 133-168, 1998.
10. Dharan, B., The Effect of Sales and Collection Disclosures on Cash Flow Forecasting and Income Smoothing, Contemporary Accounting Research, Vol. 3, No. 2, pp. 445-459, 1987.
11. Francis, J., R. LaFond, P. Olsson, and K. Schipper, Costs of Equity and Earnings Attributes, The Accounting Review, Vol. 79, No. 4, pp. 967-1010, 2004.
12. Greenburg, R., G. Johnson, and K. Ramesh, Earnings Versus Cash Flows as a Predictor of Future Cash Flow Measures, Journal of Accounting, Auditing & Finance, Vol. 1, No. 4, pp. 266-277, 1986.
13. Hollister, J., V. Shoaf, and G. Tully, An International Comparison of Accruals and the Prediction of Future Cash Flows, Journal of Accounting and Finance Research, Vol. 10, No. 6, pp. 1-9, 2002.
14. Kaplan, S. Top Executive Rewards and Firm Performance: A Comparison of Japan and the United States, Journal of Political Economy, Vol. 102, No. 3, pp. 510-546, 1994.
15. Lorek, K. and G. Willinger, A Multivariate Time-Series Prediction Model for Cash Flow Data, The Accounting Review, Vol. 71, No. 1, pp. 81-101, 1996.
16. McBeth, K., Forecasting Operating Cash Flow: Evidence on the Comparative Predictive Abilities of Net Income and Operating Cash Flow from Actual Cash Flow Data, The Mid-Atlantic Journal of Business, Vol. 29, No. 2, pp. 173-187, 1993.
17. Murdoch, B. and P. Krause, An Empirical Investigation of the Predictive Power of Accrual and Cash Flow Data in Forecasting Operating Cash Flow, Akron Business and Economic Review, Vol. 20, No. 3, pp. 100-113, 1989.
18. Neter J. and W. Wasserman, Applied Linear Statistical Models, Richard D. Irwin, Inc., Homewood, Illinois, 1974.
19. Olsen, C. and J. Dietrich, Vertical Information Transfers: The Association Between Retailers’ Sales Announcements and Suppliers’ Security Returns, Journal of Accounting Research, Vol. 23, No. 3, pp. 144-166, 1985.
20. Watts, R. Corporate Financial Statements, A Product of Market and Political Processes, Australian Journal of Management, Vol. 2, pp. 53-75, 1977.