*Author for correspondence
Machine Learning Classifiers: Evaluation of the
Performance in Online Reviews
Irina Pak* and Phoey Lee Teh
Faculty of Science and Technology, Sunway University, 5, JalanUniversiti, Bandar Sunway, Subang Jaya, Selangor - 47500, Malaysia; [email protected], [email protected]
Keywords: Comments, Machine Learning Classifiers, Online Reviews, Polarity, Sentiment Analysis
Abstract
Objectives: This paper aims to evaluate the performance of the machine learning classifiers and identify the most suitable classifier for classifying sentiment value. The term “sentiment value” in this study is referring to the polarity (positive, negative or neutral) of the text. Methods/Analysis: This work applies machine learning classifiers from WEKA (Waikato Environment for Knowledge Analysis) toolkit in order to perform their evaluation. WEKA toolkit is a great set of tools for data mining and classification. The performance of the machine learning classifiers was measured by examining overall accuracy, recall, precision, kappa statistic and applying few visualization techniques. Finally, the analysis is applied to find the most suitable classifier for classifying sentiment value. Findings: Results show that two classifiers from Rules and Trees categories of classifiers perform equally best comparing to the other classifiers from categories, such as Bayes, Functions, Lazy and Meta. Novelty /Improvement: This paper explores the performance of machine learning classifiers in sentiment value classification in the online reviews. Data used is never been used before to explore the performance of machine learning classifiers.
1.
Introduction
A classifier is a function that takes the values of example (predictors or independent variable) in various features to predict the class that example belongs to (the dependent variable)1. Machine learning is a computational program that able to learn without being programmed where to look2. According to3 all machine learning algorithms assume that a “class” can be identified using statistical analysis.
Machine learning classifiers are popularly used in pre-dicting patterns, depending on the available dataset. For instance, in4 applied machine learning classifiers such as Support Vector Machines (SVM) and Logistic Regression (LR) for predicting tornadoes. In5 applied machine learn-ing classifiers for predictlearn-ing patients’ bleedlearn-ing risk. The highest result of 88.7% for accuracy was from K-Nearest Neighbors. In6 evaluated four machine learning classifi-ers in sentiment mining. According to their results, the
most accurate classifier was Supported Vector Machines (SVM). In7 analyzed a huge data from island of Thasos. The analysis was done by applying classifiers like OneR, k‐means rule mining algorithms from WEKA. The used machine learning classifiers in analyzing complex data of fMRI (functional Magnetic Resonance Imaging)1. They finalized that by using their approach, it is possible to answer their questions in pattern discrimination and pattern characterization. In8 introduced a new machine learning. Model was used to predict how people do per-sonal note-taking from spoken dialogue. Several studies use machine learning classification to analyze Twitter data. One of the examples is a study of9 on Korean tweets, regarding the discussion on food safety. They build a model and compared the four classifiers. Naive Bayes Multinomial classifier has shown the best performance, comparing to Support Vector Machine (SVM), Naive Bayes and Decision Tree Algorithms. In10 claims that machine learning is able to improve designs of machine
and efficiency of the systems. Also, machine learning techniques can be applied for the visualizing purpose, for instance in11 proposed an enhanced SVM which integrates image process and data mining algorithms to analyze brain tumor. Another example of applying machine learning techniques for image processing12. Similar to the previous work the use of SVM helps to identify the object from the image. Overall, there are several difference types of classifiers implemented to evaluate the performance in different areas.
The previous study13 highlighted the importance of analyzing online reviews by looking at different formats of the text. However, the way of classifying text into posi-tive, negative and neutral polarity was not discussed. This study intends to identify the best-performed type of clas-sifier to determine the accurate polarity of online reviews and comments. The reason of WEKA toolkit is adopted to perform experiments, is because of the features that has more than 100 classification methods, which also supports graphical user interface, and different tools for better visualizing the classifier performance, which is also supported by14. Study by15 analyzed customer reviews using WEKA classifiers, with their interface namely “Review Analyzer System”. They applied only 6 out of the 24 of WEKA Classifiers. Different from15, our study tested 24 classifiers, to explore which classifier is more suitable to analyze reviews. Following subsections of this paper compare six types of classifiers from WEKA toolkit, and reviews from the different usage of the classifier in a dif-ferent area. Part III describes the method and data used in this study. Part IV presents the results.
Six categories of machine learning classifiers from WEKA toolkit are discussed in this section. Each category has several numbers of classifiers. This section reviewed the application within the past 10 years in different areas.
1.1 Bayes
Bayes classification is named after Thomas Bayes16. It rep-resents a supervised learning and statistical methods for classification17. It is a fundamental statistical approach which is based on probability to the problem of pattern classification18. Study of17 stated that Bayes rule clas-sifiers provide a useful perspective for evaluating and understanding learning algorithms. He also stated that Bayes classification calculates explicit probabilities for the hypothesis. He concluded that this classification provides a standard of ideal decision making. Bayesian
classifica-tion, not only widely used10, but also popularly used in text classification19. This is due to its non-requirement in any adjustment of parameters. Besides that, Naive Bayes can also consider feature distribution and the degree of feature importance20. Naive Bayes is discussed in several studies, such as: Naive Bayes anomalies21, about imple-mentation of extended Naive Bayes for missed data22, about text classification using Naive Bayes23 and etc. Bayes classification can be applied for text classification, calculating probabilities for the hypothesis and pattern classification.
1.2 Functions
The second category to discuss is named Function24. These classifiers namely: regression algorithms, SVM, and sup-port vector classifier25. LR is used by many researchers for data processing in patterns and trends study. For instance, in26 used LR to identify the trend of people opinion of US politicians though twits. Results from that study showed that there is a lack of evidence to identify or classify neu-tral polarity. In27 also used LR to analyze results in their study. They studied consumer opinions on reducing salt and Sodium in the food industry. Another study where LR was applied by28 is about smoking among job-seeking unemployed. They found that people who smoke usually unemployed or still under job-seeking status. Another classifier under this category is SVM, it is been discussed in from different perspective, for instance in29 discussed reason of failure SVM in that particular case and how to overcome the issue. Study of29 discussed problem of fea-ture selection while comparing SVM, Naive Bayes, and Decision Tree classifiers. LR is widely used in analyzing collected data from human respondents to identify pat-terns and trends.
1.3 Lazy
However, Lazy category, also known as “learning”24, has its own uniqueness. It only performs at prediction time25. Different from Bayes method, Lazy classifiers does not make assumption about data distribution, but Bayes classifiers assume that attributes are conditionally inde-pendent to each other. The famous k-Nearest Neighbor (k-NN) is a classifier under the lazy category. In31 pro-posed a classification model using improved k-NN algorithm for text categorization. They compared Rocchio and k-NN model algorithms with their proposed model. Their proposed model eventually outperformed other two
models; as such Lazy category seems not suitable for text classification. Another study by32 used k-NN classifier to conduct comparative assessment of the performance of Boosting, Bagging and Random Subspace. Boosting is an algorithm to reduce bias, bagging is designed to improve stability and accuracy and random subspace to construct and aggregate the base classifier. Eventually, Random Subspace SVM performed more accurate than another two methods. In33 proposed an approach for sentiment analysis. They used an adapted k-NN algorithm in their approach. Their proposed approach was tested with three different dictionaries so Dalian University of Technology Sentiment Dictionary showed the best results. In31,32 used lazy classifiers for text classification, but classifier did not show the higher accurate results compared to the other classifiers. In33 proposed an enhanced k-NN (lazy classi-fier) algorithm for text sentiment analysis. Lazy classifiers were applied for text classification; however some study showed that there are more suitable classifiers for text classification.
1.4 Meta
Beside lazy classifiers, meta-classifiers are also widely used in polarity classification. Meta-classifier is useful for base classifiers regarding number of instances in the training data34. For instance, in35 applied meta-classifier in their proposed framework for sentiment classification. Their experiments were conducted using five popular datasets. Results proved that their technique is effective for sentiment classification. Another study36 proposed an enhanced meta-classifier. They36 compared his classifier with baseline approaches to check accuracy. Enhanced meta-classifier had the higher accuracy in polarity clas-sification. Study of37 focused on polarity classification in the Spanish language. They combined different methods using meta-classifiers to archive accurate results in iden-tifying polarity.In38 compared meta-algorithm with SVM regression and SVM multiclass versions to check their prediction performance. In38 results showed that meta-algorithm performs better than both versions of SVM. This category of classifiers has been successfully applied for polarity detection in text.
1.5 Rules
This category of classifiers is rule-based classifiers (e.g. ZeroR)24,25. Rule-based classifiers were also used in
sev-eral studies for text classification. For instance, in39
proposed a fuzzy rule-based classifier with semantic coin tension. Results showed accurate classification and high semantic coin tension. In the linguistic study, in40 intro-duced a rule-based approach for sentiment classification of Ukrainian online reviews. She applied two rules to be responsible to different scenarios of sentiment grammar: 1. Context-independent that responsible for speech and sentiment, 2. Context-independent rules that responsible for lemmas of the words. In41 introduced a Rule-Based Emission Model (RBEM). Their model is able to do sen-timent classification. They set several rules, for example, positive patterns referred to positive context and etc. Words such as well-done and good classified as positive patterns. In42 stated that rule-based system for text analyz-ing tend to have more accurate performance but require more work from users because of requirement to write a rules. Besides Lazy and Meta classifiers, rule-based is also used for text classification.
1.6 Trees
Trees category is tree-based classifiers, for example, J48 and decision trees25. Tree classification is popular for analyzing text aswell, for example, in43 proposed a tree kernel and tree pruning based approach for sentiment classification. Results from their study showed that their approach is effective for sentence-level sentiment classi-fication. In44 used a decision tree-based feature ranking in their approach for sentiment classification. They could archive 81.25% of classification accuracy. Other than this, in45 proposed a system for sentiment analyzing of Arabic comments. In their system, they used machine learning classifiers like support vector machines, decision tree, and Naive Bayes. Then they evaluated the performance of each classifier. Among three classifiers, support vector machines gave the highest results. In other words, trees classifiers were also effectively used for text classification.
Finally, among all the six categories of classifiers dis-cussed, conclusion is that they can be used for text and sentiment classification, pattern recognition, and polar-ity prediction. However, trees, rules and meta categories were used for text classification more often than other categories.
2. Method
In this section, data source, pre-processing, and statistics used for experiment are discussed.
2.1 Data Source
There are 1041 reviews and comments collected from dif-ferent online websites. These reviews and comments are collection of opinion on customers’ reviews on the prod-ucts or services they purchased. Reviews were posted in forum from Amazon.com, Facebook comments and Gsmerena.com.
These comments consisted reviews from 10 different categories 1. Beauty and Health 2. Camera 3. Computer 4. Consumer Electronics 5. Fashion 6. Home appliance 7. Jewellery and Watch 8. Mobiles and Tables 9. Sport goods 10. Toys and Kids. Comments were firstly analyzed with the UCREL Wmatrix system46, identifying the highest frequently used emotional words for our test. In total, 15 positive and 15 negative emotional words were simulated in our test to obtain verification of agreement of polar-ity. The scale of opinion ranging from ‘strongly dislike’ to ‘strongly like’ in 7-point from 500 human respondents is later aggregate as our training set in evaluation process.
2.2 Pre-processing
This section explains the two steps involved in our pre-processing. Pre-processing steps were taken to prepare data for classification. Step 1. Identifying the mean value for each of the comments from collected data. This step intends to find the average score of “like and dislike” for each comment from human raters. Step 2. Setting the polarity to each comment based on mean value from Step 1 (1-3.99 to negative (Neg) polarity, 4-4.99 to Neutral and 5-7 to Positive (Pov) polarity). This step intends to set a final class for classifier.
These two steps are important and were necessary in order to prepare data to work with classifiers. Next sec-tion elaborates the unit of measurement to obtain the performance of machine learning classifiers.
3. Measurement
WEKA toolkit is set of tools for data mining, classifica-tion, clustering and visualization25,47. Test mode was default, and it was set as 10-fold cross-validation. This mode was chosen because it is intensive and it uses all available examples for training and test48. Nevertheless, the number of folds is set as default by WEKA15. The mea-surements such as: accuracy, precision, and recall of each classifier were compared.
There are five measurements to support our arguments. Firstly, the accuracy of the measured value. It is the close-ness of a measured value to a standard or known value49. Secondly, precision was used to compare performance of classifiers. Precision is defined as the closeness of two or more measurements to each other49. And thirdly, Recall in information retrieval, which is the fraction of the doc-uments that are relevant to the query that is successfully retrieved50. Fourthly, kappa statistic. The kappa statistic measures the agreement of prediction with the true class 25,51. Kappa statistic represents agreement range between observers. Perfect agreement is equal to a kappa of 1 and chance agreement is equal to kappa of 025.According to study of52 Kappa statistic has following interpretation: 0 is referred to “Poor”, 0.2 is “Slight”, 0.4 is “Fair”, 0.6 is “Moderate”, 0.8 is “Substantial” and 1 is “Almost perfect”. And lastly, the ROC (Receiver Operating Characteristic). One of the ways to compare the performance of classi-fiers is to visualize it using ROC curve53. The reason of using ROC curve is that ROC curve helps to visualizes all possible classification thresholds53. The perfect ROC curve would stay with Y axis from 0 to 1 and then expand to the X axis. As closer curve to 1 on the Y axis (which is an upper left corner) as better the performance of classi-fier 54,55. Class value picker determines which of the classes should be evaluated. Each of the classes which are Pos, Neg and Neutral was picked for each of classifiers. Each class was selected to show the performance of each class.
4. Results
To demonstrate the performance evaluation, six figures were displayed to visualize the performance of each clas-sifier by applying ROC curve.
4.1 Visualization of Classifiers Performance
for Bayes Category
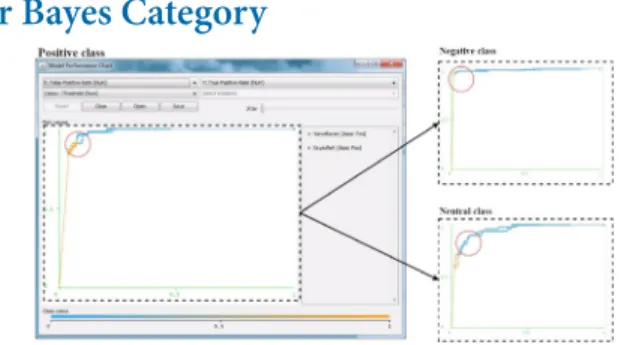
Figure 1. ROC curves’ comparison of BayesNet and Naive Bayes classifiers
Figure 1 presents the model performance chart for the classifiers in Bayes category.
Circle area on the graph represents how close BayesNet and Naive Bayes curves to the 1 on the Y axis. The curves relatively close to the left top corner as shown in Figure 1, and expanding towards the X axis. The value is definitely close to 1 on the Y axis. However, the result for Bayes Net curve is slightly further from 1 on the Y axis comparing to Naive Bayes, which demonstrated that Naive Bayes per-formed better.
4.2 Visualization of Classifiers Performance
for Functions Category
Figure 2. ROC curves’ comparison of Logistic, SimpleLogistic and SMO classifiers
Functions category showed lower performance com-pare to the Bayes category. Figure 2 presents a ROC curve for Logistic, Simple Logistic and SMO classifiers. Simple Logistic show good results, because curves are close to the left top corner, and then curves expand to the X axis. Logistic classifier showed the worst performance, because the curve is far from 1 on the Y axis. The curve for SMO classifier is in between two other curves, so the perfor-mance of SMO better than Logistic classifier.
4.3 Visualization of Classifiers Performance
for Lazy Category
Compare to the previous two categories, Lazy cat-egory has a curve in positive class which passes by on 1 on Y axis. Figure 3 presents a ROC curve for IBk, KStar and LWL classifiers. LWL classifier definitely performed the best, because the curve is very close to 1 on Y axis. IBk classifier performed slightly better than KStar, since the curve of IBk is closer to 1 on Y axis compare to the curve of KStar.
Figure 3. ROC curves’ comparison of IBk, KStar and LWL classifiers
4.4 Visualization of Classifiers Performance
for Meta category
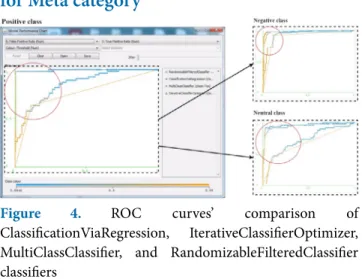
Figure 4. ROC curves’ comparison of
ClassificationViaRegression, IterativeClassifierOptimizer, MultiClassClassifier, and RandomizableFilteredClassifier classifiers
Figure 4 presents a ROC curve for Classification via Regression, Iterative Classifier Optimizer, Multi Class Classifier and Randomizable Filtered Classifier clas-sifiers. Curves for Iterative Classifier Optimizer and Classification via Regression are very close to 1 on Y axis compare to the curves of Randomizable Filtered Classifier and Multi Class Classifier. Similar to Lazy category, Meta category has two curves in positive class which passes by on 1 on Y axis, which identifies that Iterative Classifier Optimizer and Classification via Regression performed very well.
4.5 Visualization of Classifiers Performance
for Rules Category
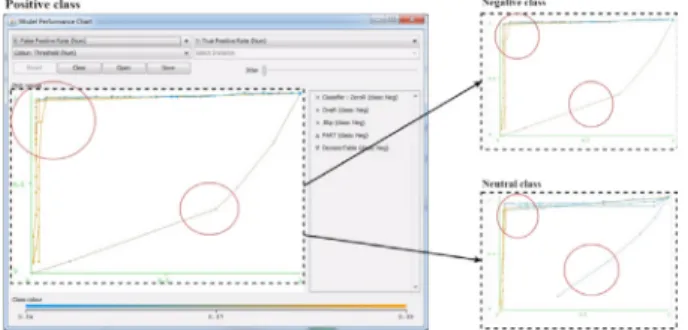
Figure 5 presents a ROC curve for Decision Table, JRip, OneR, PART and ZeroR classifiers. Curves for Decision Table, JRip, OneR, PART are quite close to 1 on
the Y axis, it means their performance are good to com-pare to the curve of ZeroR. ZeroR classifier showed very low performance, the curve is very far from 1 on the Y axis. Compare to classifiers from Bayes, Functions, Lazy and Meta categories, ZeroR classifier shows the worst per-force.
Figure 5. ROC curves’ comparison of DecisionTable, JRip, OneR, PART, and Zero classifiers
4.6 Visualization of Classifiers Performance
for Trees Category
Figure 6. ROC curves’ comparison of DecisionStump, HoeffdingTree, J48, LMT, RandomForest, RandomTree and REPTree classifiers
Figure 7. Visualization (Tree view) of J48 classifier
Figure 6 presents a ROC curve for Decision Stump, Hoeffding Tree, J48, LMT, Random Forest, Random Tree and REP Tree classifiers. Curves for Decision Stump, REP Tree and J48 show the best results, because curves are very close to the left top corner and then curves expand to the X axis. Random Tree classifier showed lower per-formance, the curve is very far from 1 on the Y axis.
Overall, Iterative Classifier Optimizer, Classification via Regression, REP Tree and J48 classifiers showed the best performance based on ROC curves comparison.
4.7 Visualization of Classifiers Performance
for J48
Figure 7 represents visualization (tree view) of J48 classifier. Since J48 classifier has the highest accuracy results and it is a tree based classifier, we elaborate more on the structure of outcome. WEKA builds the tree which is consistent with information gain values calculated55
in Figure 7. The mean is root attribute because it con-tains premier information gain55. Looking at the J48 tree
visualization it can be seen that the classifier determines patterns in polarity level. J48 classifier identifies correctly 135 negative comments with polarity equal or less than 3.996. Fifty four positive comments were identified cor-rectly with polarity more than 4.996.
4.8 Classifiers: Precision, Recall, Accuracy,
Kappa Statistic
The previous section visualized the performance of clas-sifiers though ROC curve, this section presents an overall performance of 24 classifiers. Precision, Recall, Accuracy, and Kappa statistic were used to measure the performance of each classifier. Results are presented in to Table 1.
Four classifiers which showed the highest values were highlighted, whereby PART and J48 have same results. In total, four classifiers provided the highest results for Precision, Recall, and Accuracy. Classifiers, PART, and J48 gave the same highest results. The interesting discov-ery, two classifiers are from a different category. PART is Rules base classifier and J48 is Trees base classifier. The third classifier with an accuracy of 96.667 % is Iterative Classifier Optimizer, it is Meta base. Another Trees base classifier with accuracy 96.25% is REP Tree. The low-est value of Accuracy was for Zero R classifier which is 57.0833 %. Kappa statistic results show similar results. Iterative Classifier Optimizer, PART, J48, and REP Tree
are top three high results. However, PART and J48 have the same value similar as accuracy for those two classi-fiers are equally the highest.
5. Conclusion
Studies from past 10 years showed that Bayes, Meta, Rules and Trees classifiers were widely used for text clas-sification. Our method included all the 6 categories of classifiers from WEKA toolkit. Total up to 24 classifiers. The result of accuracy from two classifiers namely J48 and PART showed equally rate of 97.5%. Result of recall and precision showed similar to accuracy results, both J48 and PART classifiers have 0.975.
Kappa statistic represents the agreement of prediction with the true class. J48 and PART classifiers showed the same result as 0.9569. Overall results suggest that Rules and Trees based classifiers can be successfully applied to
clas-6.
Acknowledgement
The authors would like to thank Paul Rayson and Scott Piao from Lancaster University for their assistance in the previous study. The data used in this paper was col-lected with their help and suggestions. Also many thanks to the members of the Waikato machine learning team for the work they put into WEKA. This study is partially funded by Sunway University Internal Research Grant No. INT-FST-IS-0114-07 and Sunway-Lancaster Grant SGSSL-FST-DCIS-0115-11.
7. References
1. Pereira F, Mitchell T, Botvinick M. Machine learning clas-sifiers and fMRI: A tutorial overview. NeuroImage. 2009; 45(1):S199–209.
2. Oregon DT. Machine learning and ecosystem
informat-Table 1. Results from classifiers
Group Classifiers Precision Recall Accuracy
(%) Kappa statistic Bayes BayesNet 0.887 0.883 88.333 0.8013 Naive Bayes 0.888 0.883 88.333 0.8023 Functions Logistic 0.712 0.696 69.583 0.4902 Simple Logistic 0.867 0.87 87.083 0.7748 SMO 0.871 0.871 87.083 0.778 Lazy IBk 0.816 0.821 82.083 0.6889 KStar 0.770 0.633 63.333 0.4361 LWL 0.807 0.813 81.25 0.6496
Meta Classification Via Regression 0.936 0.938 93.75 0.8912 Iterative Classifier Optimizer 0.967 0.967 96.667 0.9427
MultiClass Classifier 0.763 0.754 75.4167 0.5858 Randomizable Filtered Classifier 0.754 0.750 75 0.5726 Rules DecisionTable 0.959 0.958 95.833 0.9284 JRip 0.954 0.954 95.417 0.9204 OneR 0.955 0.954 95.417 0.9216 PART 0.975 0.975 97.5 0.9569 ZeroR 0.326 0.571 57.0833 0 Trees DecisionStump 0.678 0.779 77.917 0.6196 HoeffdingTree 0.892 0.888 88.75 0.8094 J48 0.975 0.975 97.5 0.9569 LMT 0.908 0.908 90.833 0.8423 RandomForest 0.876 0.879 87.917 0.791 RandomTree 0.809 0.808 80.833 0.6699 REPTree 0.963 0.963 96.25 0.9357
on Machine Learning (ACML); Nanjing: Springer; 2009. p. 1–5.
3. Nguyen TTT, Armitage G. Training on multiple sub-flows to optimise the use of Machine Learning classifiers in real-world IP networks. Proceedings - Conference on Local Computer Networks, LCN; 2006. p. 369–76.
4. Trafalis TB, Adrianto I, Richman MB, Lakshmivarahan S. Machine-learning classifiers for imbalanced tornado data. Computational Management Science. 2014; 11(4):403–18. 5. James SL, Henderson EE, Shatzel JJ, Dickson R. Mo1903
machine learning classifiers: A novel approach to pre-dicting bleeding risk in hospitalized cirrhotic patients. Gastroenterology. 2015; 148(4):1079.
6. Vinodhini G, Chandrasekaran R. Performance evalua-tion of machine learning classifiers in sentiment mining. International Journal of Computer Trends and Technology. 2013; 4(6):1783–6.
7. Theodosiou T, Valsamidis S, Hatziliadis G, Nikolaidis M. Measuring, archetyping and mining Olea europaea produc-tion data. Journal of Systems and Informaproduc-tion Technology. 2012; 14(4):318–35.
8. Bothin A, Clough P. Predicting Meeting Participants’ note-taking from previously uttered dialogue acts. Journal of Systems and Information Technology. 2016; 18(2):170–85. 9. Yeom H. Study of machine-learning classifier and feature
set selection for intent classification of Korean tweets about food safety. Journal of Information Science Theory and Practice. 2014; 2(3):29–39.
10. Kotsiantis S. Supervised machine learning: A review of classification techniques. Informatica (Ljubljana). 2007; 31(3):249–68.
11. Kiranmayee BV, Rajinikanth TV, Nagini S. Enhancement of SVM based MRI brain image classification using pre-processing techniques. Indian Journal of Science and Technology. 2016; 9(29):1–7.
12. Yaswanth V, Kiran Kumar K, Harshith N, Sai Teja G, Aparna R. Outfit of Exemplar-SVMs for object detection and beyond. Indian Journal of Science and Technology. 2016; 9(30):1-7.
13. Teh PL, Rayson P, Pak I, Piao S. Exploring fine-grained sen-timent values in online product reviews. IEEE Confernece on Open Systems (ICOS); Melaka. 2015. p. 114–8.
14. 14. Bouckaert RR, Frank E, Hall M a., Holmes G, Pfahringer B, Reutemann P, Witten IH. WEKA - Experiences with a Java open-source project. The Journal of Machine Learning Research. 2010; 11:2533–41.
15. Kshirsagar AA, Deshkar PA. Review analyzer analy-sis of product reviews on WEKA Classifiers. IEEE 2nd International Conference on Innovations in Information, Embedded and Communication systems (ICIIECS); 2015. p. 1–5.
16. Lee M-C. A Tutorial on Bayesian classifier A Tutorial on Bayesian classifier with WEKA with WEKA. Department of Information Management, Yu Da College of Business. 2006. 17. Vijaykumar B, Vikramkumar, Trilochan. Bayes and
Naive-Bayes Classifier. 2014.
18. Burduk R. Imprecise information in Bayes classifier. Pattern Analysis and Applications. 2012; 15:147–53.
19. Youn E, Jeong MK. Class dependent feature scaling method using naive Bayes classifier for text datamining. Pattern Recognition Letters. 2009; 30(5):477–85.
20. Kim Ha NJ, Chang J. Integrating Incremental feature weighting into naive bayes text classifier. IEEE International Conference on Machine Learning and Cybernetics; Hong Kong. 2007. p. 19–22.
21. Jamain A, Hand DJ. The Naive Bayes mystery: A classifi-cation detective story. Pattern Recognition Letters. 2005; 26(11):1752–60.
22. Hsu C-C, Huang Y-P, Chang K-W. Extended Naive Bayes classifier for mixed data. Expert Systems with Applications. 2008; 35(3):1080–3.
23. Lu SH, Chiang Da, Keh HC, Huang HH. Chinese text classification by the Naive Bayes classifier and the associa-tive classifier with multiple confidence threshold values. Knowledge-Based Systems. 2010; 23(6):598–604.
24. Hall M, Frank E, Holmes G, Pfahringer B, Reutemann P, Witten IH. The WEKA data mining software. ACM SIGKDD Explorations. 2009; 11(1):10–8.
25. Bouckaert RR, Frank E, Hall M, Kirkby R, Reutemann P, Seewald A, Scuse D. WEKA Manual for Version 3-6-2. Waikato; 2010. p. 303.
26. Taddy M. Measuring political sentiment on twitter: fac-tor optimal design for multinomial inverse regression. Technometrics. 2013; 55(4):415–25.
27. Patel SM, Gunn JP, Tong X, Cogswell ME. Consumer Sentiment on Actions Reducing Sodium in Processed and Restaurant Foods, Consumer Styles. Am J Prev Med. 2014; 46(5):516–24.
28. Prochaska JJ, Shi Y, Rogers A. Tobacco use among the job-seeking unemployed in California. Preventive Medicine. 2013; 56(5):329–32.
29. Khan MF, Chauhan G, Jaitly AK. An approach to overcome imbalance datasets of eukaryotic genomes during the anal-ysis by machine learning technique (SVM). Indian Journal of Science and Technology. 2011; 4(5):119–29.
30. Chinna Gopi S, Suvarna B, Maruthi Padmaja T. High dimensional unbalanced data classification vs. svm feature selection. Indian Journal of Science and Technology. 2016; 9(30):1-7.
31. Jiang S, Pang G, Wu M, Kuang L. An improved K-nearest-neighbor algorithm for text categorization. Expert Systems with Applications. 2012; 39(1):1503–9.
32. Wang G, Sun J, Ma J, Xu K, Gu J. Sentiment classification: The contribution of ensemble learning. Decision Support Systems. 2014; 57(1):77–93.
33. Liu SM, Chen J-H. A multi-label classification based approach for sentiment classification. Expert Systems with Applications. 2015; 42(3):1083–93.
34. Kalaiselvi P, Nalini C. A comparative study of meta classi-fier algorithms on multiple datasets. International Journal of Advanced Research in Computer Science and Software Engineering. 2013; 3(3):654–9.
35. Xia R, Zong C, Li S. Ensemble of feature sets and classifi-cation algorithms for sentiment classificlassifi-cation. Information Sciences. 2011; 181(6):1138–52.
36. Franco-Salvador M, Cruz FL, Troyano Ja, Rosso P. Cross-domain polarity classification using a knowledge-enhanced meta-classifier. Knowledge-Based Systems. 2015; 86(May):1–11.
37. Previtali F, Arrieta a. F, Ermanni P. Double-walled cor-rugated structure for bending-stiff anisotropic morphing skins. Journal of Intelligent Material Systems and Structures. 2015; 26(5):599–613.
38. Pang B, Lee L. Seeing stars: Exploiting class relationships for sentiment categorization with respect to rating scales. ACL ’05 Proceedings of the 43rd Annual Meeting on Association for Computational Linguistics; Ann Arbor: Association for Computational Linguistics Stroudsburg, PA, USA. 2005. p. 115–24.
39. Mencar C, Castiello C, Cannone R, Fanelli a. M. Design of fuzzy rule-based classifiers with semantic cointension. Information Sciences. 2011; 181(20):4361–77.
40. Romanyshyn M. Rule-based sentiment analysis of Ukrainian reviews. IJAIA. 2011; 2(4):.91–103.
41. Tromp E, Pechenizkiy M. RBEM: a rule based approach to polarity detection. WISDOM’13. Chicago: ACM; 2013. p. 1–29.
42. Kent EL. Text analytics - Techniques, language and oppor-tunity. Business Information Review. 2014; 31(1):50–3. 43. Zhang W, Li P, Zhu Q. Sentiment classification based on
syntax tree pruning and tree kernel. 7th Web Information Systems and Applications Conference; 2010. p. 101–5.
44. Jotheeswaran J, Koteeswaran S. Decision tree based feature selection and multilayer perceptron for sentiment analysis. ARPN Journal of Engineering and Applied Sciences. 2015; 10(14):5883–94.
45. Hamouda AEA, El-taher FE. Sentiment analyzer for ara-bic comments system. International Journal of Advanced Computer Science and Applications. 2013; 4(3):99–103. 46. Rayson P. From key words to key semantic domains.
International Journal of Corpus Linguistics. 2008; 13(4):519–49.
47. Mohammad MN, Sulaiman N, Muhsin OA. A novel intru-sion detection system by using intelligent data mining in WEKA environment. Procedia Computer Science. 2011; 3:1237–42.
48. Bengio Y, Grandvalet Y. No unbiased estimator of the variance of K-fold cross-validation. Journal of Machine Learning Research. 2004; 5:1089–105.
49. Kosolapov S. Electronic Instrumentation Errors in Measurements. 2013. p. 20 .
50. Menczer F. ARACHNID: Adaptive Retrieval Agents Choosing Heuristic Neighborhoods for Information Discovery. Proceedings of 14th International Conference on Machine Learning. 1997. p. 227–35.
51. Yang Z, Zhou M. Weighted kappa statistic for clustered matched-pair ordinal data. Computational Statistics and Data Analysis. 2015; 82:1–18.
52. Viera AJ, Garrett JM. Understanding interobserver agreement: The kappa statistic. Family Medicine. 2005; 37(5):360–3.
53. Martinez-Camblor P, Carleos C, Corral N. General non-parametric ROC curve comparison. Journal of the Korean Statistical Society. 2013; 42(1):71–81.
54. Rao G. What is an ROC curve? The Journal of family prac-tice. 2003; 52(9):695.
55. Witten IH, Frank E. Data Mining: Practical Machine Learning Tools and Techniques. 2nd ed. San Francisco: Elsevier Inc.; 2005.