Towards GPU Utilization Prediction for Cloud Deep Learning
Gingfung Yeung
Damian Borowiec
Adrian Friday
Richard Harper
Peter Garraghan
Lancaster University
Abstract
Understanding the GPU utilization of Deep Learning (DL) workloads is important for enhancing resource-efficiency and cost-benefit decision making for DL frameworks in the cloud. Current approaches to determine DL workload GPU utiliza-tion rely on online profiling within isolated GPU devices, and must be performed for every unique DL workload submission resulting in resource under-utilization and reduced service availability. In this paper, we propose a prediction engine to proactively determine the GPU utilization of heterogeneous DL workloads without the need for in-depth or isolated online profiling. We demonstrate that it is possible to predict DL workload GPU utilization via extracting information from its model computation graph. Our experiments show that the prediction engine achieves an RMSLE of 0.154, and can be exploited by DL schedulers to achieve up to 61.5% improve-ment to GPU cluster utilization.
1
Introduction
Deep Learning (DL) has begun to make significant impact across many fields of computing. Growth in volumes of data, in the complexity of model usage, as well as innovations in DL architectures have all led to increasing practitioner demand. This in turn has resulted in new ways of satisfying this de-mand including, for example, exploiting compute accelerators such as Graphic Processing Units (GPUs) fortrainingand inferencecomputation [1–3]. Prominent cloud providers now provision GPU1cluster resources as part of their IaaS [4–7].
An important goal for such services is ensuring specified Ser-vice Level Agreements (SLA) and Quality of SerSer-vice (QoS) are met in a resource-efficient manner [8,9].
Efforts to ensure SLA and QoS guarantees for cloud-based DL often result, however, in considerable GPU under-utilization [10,11]. This is because orchestration frameworks such as Kubernetes [12] or YARN [13]prohibit explicit GPU
1A vast majority of DL workloads utilize NVIDIA GPUs, which we refer
to as GPUs unless otherwise stated.
sharingfor workloads, including those for DL. Such under-utilizationdecreasesresource-efficiency as well as service availability, requiring additional expensive GPU devices to address the demand.
Numerous approaches have been proposed to improve GPU resource-efficiency. These include exploiting workload per-formance metrics such as execution time [8,10,14], com-munication [15,16], and GPU utilization patterns [17–19]. These information allow providers to make high-quality clus-ter scheduling decisions to address issues such as inclus-terference between co-located workloads, network latency and resource under-utilization. Since GPU rental can be expensive2, it is also beneficial for consumers to understand GPU utilization requirements of their DL workloads prior to executionto determine potential cost. As such, understanding DL work-load has been identified as an important topic for designing resource-efficient cloud-based DL systems [21–23].
A challenge confronting resource-efficient cloud-based DL, though, is that current approaches to obtain the GPU utiliza-tion of DL workloads arereactive, i.e. online workload profil-ing is undertakenduringexecution. Online profiling entails executing every unique submitted DL workload within an isolated GPU (or entire machine) ensuring accurate metric collection [14,24], and often exploits stress testing using micro-benchmarks to identify bottlenecks [18]. Such reactive profiling approaches results in both reduced service availabil-ity and resource-efficiency due to the necessavailabil-ity for dedicated unreserved devices. This is particularly important due to the growing trend of AutoML, where DL workloads are of differ-ent configurations and/or model architecture [10].
An alternative and potentially more efficient approach is instead toproactively predictDL workload GPU utilization prior to execution. However, no work yet exists capable of doing so rapidly or accurately; such prediction is difficult when considering diverse DL model architectures, DL frame-works (differing graph optimizations), datasets, and hardware heterogeneity—all which alter GPU utilization patterns.
2As of March 2020, rental cost an AWS P3 instance with 8 x NVIDIA
In this paper, we have designed a GPU utilization prediction engine for heterogeneous DL workloads. In contrast to current approaches, our prediction engineproactivelyprovides esti-mated values ofunseenworkloads based on historical profiles which can be used by DL cluster schedulers to reduce perfor-mance interference between workloads to increase resource efficiency as depicted in Figure1. Our research contributions are specifically:
• We identify relevant DL model features (Floating Point Operations Per second (FLOPs), number of convolution layers, and input data size from DL workload computa-tion graphs) that can be used to proactively predict GPU utilization without a need for online profiling. We show that DL workload GPU utilization can be predicted with an RMSLE of 0.154.
• We demonstrate empirically that the prediction engine when integrated into a DL cluster scheduler supporting co-location can minimize performance interference due to GPU over-allocation, achieving up to 61.5% increase in GPU cluster utilization and up to 33.6% makespan reduction over existing approaches.
2
Background
Understanding and achieving high resource utilization for heterogeneous workloads (including DL) in cloud computing is an important topic [8,10,14,18,24–37].
DL workloadare represented as Deep Neural Networks (DNN) as a Directed Acyclic Graph (DAG) or computation graph in execution. Each graph node is an operation (i.e. layer), containing parameter information and has access to its predecessor and successor. Since model parameters are typically stored as floating point values, larger models result in a higher number of Floating Point Operations (FLOPs), and increased GPU device memory requirements. It has recently been shown that increasing DNN model depth and width im-proves accuracy in DL [38,39]. For example, in the ImageNet image classification challenge, the ResNet50 model with 4.1 GFLOPS and EfficientNet-B7 with 37 BFLOPs, achieved 93.0% and 97.1% Top-5 accuracy, respectively.
GPUsare well-suited for DL computation due to their abil-ity to perform iterative matrix multiplication, utilizing thou-sands of processing units, where a group of processing units is referred to as aStreaming Multiprocessor(SM). SM exe-cuteskernelsin Single-Instruction-Multiple-Thread (SIMT) paradigm3, hence each kernel defines the number of threads required, which are calledthread blocks. Each thread block is composed of a number ofwarps4, where each warp contains 32 threads [40]. Thus, a complex DL model with a large num-ber of layers (i.e. kernels), results in a significant amount of
3Kernel—In this context, GPU implementation of DNNs operations 4A warp is the basic scheduling unit within an Nvidia GPU.
Node n
Cloud Resource Manager Prediction Engine Workload Definition Computation Graph Computation Model Performance Score W o rk lo ad Q ue u e Resource Pool Scheduler Node 1 Node 2 Clo ud Submis si on P or ta l Enriched Definition Feature Extraction
Figure 1: Proposed GPU utilization prediction engine deployed within a cloud resource manager
computation performed by the GPU processing units, driven by the number of FLOPs.
GPU utilization is known to be non-trivial to calcu-late [41]. To determine how the GPU is utilized during kernel execution, users can obtain relevant metrics from an NVIDIA System Management Interface (nvidia-smi), and through this observe the GPU and Memory utilization.GPU utiliza-tionis defined as the percentage of time over the past sample period that one or more kernels are executed on the GPU. WhereasMemory utilizationis defined as the percentage of time over the past sample period that global (device) memory was read from or written to. Although both measurements are not the actual utilizationof the SM core (chip area containing the floating-point, integer and tensor units5), nor the amount of read/write bytes from device memory and caches, theyare a good estimateof the amount of warps required to keep the GPU busy. Thus, recent online profiling approaches use one or more of these metrics for decision making [10,19,37].
GPU profilingis performed by executing workload on a dedicated GPU located in an isolated machine [14,18,24], with various device metrics obtainable by profiling tools6. Pro-filing can be categorized as one of two types:Coarse grained profilingobtains the number of kernels, kernel configuration, GPU/memory utilization, and kernel execution time. Based on our own experimentation, obtaining a good coarse grained profile requires several minutes of profiling depending on workload.Fine-grained profilingrequires accessing hardware performance counters per kernel including SM Efficiency, Achieved Occupancy and Bytes read/write from DRAM. This method is more intensive, and based on our experiments, min-utes to hours of profiling may be required depending on the metrics measured and workload complexity.
5Compute Capability >= 7.0
6For Nvidia profiling: NVIDIA NSight Systems, NVIDIA NSight
Architecture Permutations
MobileNetV2 [42] [default, channel: 2i0...n]
ResNet [43] [18, 34, 50, 18 - bottleneck],
GoogLeNet [44] [default]
VGGNet [45] [19]
ResNeXt [46] [11 - cardinality: 2, width :16]
SqueezeNetV1 [47] [1.0]
DenseNet [48] [121, 161, 169]
ShuffleNetV2 [49] [0.5, 1.0, 2.0]
MNASNet [50] [0.5, 1.0, 1.3],
PyramidNet [51] [depth: [48,84], alpha: [66,110]],
DualPathNetwork [52] [92,blocks:[2,2,2,2]]
Transformer [53] emb/hidden: [64, 128], attenhead: 4
LSTM [54] emb/hidden: [64, 128], layers: [1, 2]
bidirectional
Table 1: Analyzed DL models. Datasets Cifar10 [55], WikiText2 [56] and news commentary v14 en-zh [57] were used for CV and NLP domains. NLP dataset sentence length was set as 200, and vocabulary 10000 with batch sizes [16,32,64]. CV model batch sizes set as [64, 128, 256, 512]
3
Related Work
Many existing cloud DL systems already profile workload to improve resource-efficiency, obtaining metrics such as training progress [58], workload communication distribu-tion [15,16] and workload execution time [8,59]. In terms of profiling GPU utilization, Gandiva [10] focuses on DL work-load time-sharing on GPUs, and conducts online workwork-load profiling within isolated machines to determine suitable co-location and migration strategies. Thinakaran el al. [37] also conduct online workload profiling on isolated machines for co-location strategies to harvest under-utilized resources. Xu et al. [19] leverage characteristics of virtualized GPUs, and propose an interference-aware scheduler. It exploits workload usage patterns such as GPU, memory, and vCPU utilization obtained from isolated profiling, to predict performance slow-down from co-located DL workloads. Wang et al [22] obtain DL workload features and infrastructure features to decide a training regime (AllReduce, Parameter server/worker). Qi et al [60] is the closest to our work, where they utilize model and device features, and profile per-layer execution time to predict overall training time.
4
Characterizing DL Utilization
To create our prediction engine, it is first necessary to study the relationship between DL workload characteristics and GPU utilization. We have profiled 13 prominent computer vision (CV) and natural language processing (NLP) models architecture7, including convolution neural networks (CNNs) and recurrent neural networks (RNNs), with varying
config-7Models obtained from github: pytorch/vision, kuangliu/pytorch-cifar
dyhan0920/PyramidNet-PyTorch [61], allenlp/allennlp [62] 0 10 20 30 40 50 60 70 80 90 100 G PU U ti liz at io n %
(a) GPU Utilization per model
0 50 100 150 200 250 0 10 20 30 40 50 60 70 80 90 100 GF LOP s GPU Utilization %
(b) GFLOPs vs. GPU Utilization
Figure 2: DL workload characteristics
urations including mini-batch sizes, hidden dimensions and number of layers, as shown in Table1. We attempted to cap-ture as many unique DL models configurations as possible within the memory constraints of our GPU devices, resulting in a total of 81 different DL workloads executed.
Micro-benchmarks were conducted using a dedicated ma-chine with 4 x Nvidia GeForce 1080 GPUs and Intel i7-6850K CPU. We used Nvidia Docker 2 container runtime, CUDA Toolkit 10.0, cuDNN 7.5, and PyTorch 1.1 DL Frame-work [63]. All micro-benchmarks were executed in isolation and ran multiple times to ensure metric consistency, with metrics collected usingnvidia-smi.
Figure2adepicts the GPU utilization of micro-benchmark models, with DL workload ranging between 20 - 90% GPU utilization for their default parameter configurations, and batch size at 64 and 16 for vision and language models respec-tively. It is observable that model complexity relates to higher GPU utilization, particularly FLOPs8, as shown in Figure2b. There exist several models withlow FLOPs and high GPU utilization, which we postulate is likely resultant of model architectures producing high number of intermediate feature maps (e.g ResNet). These findings are supported by prior studies in the field of neural architecture search and model compression [38,42,64,65].
DL models with greater complexity in terms of FLOPs and high number of feature maps, result in more kernels launched and longer kernel execution time. We show the difference between two models in a 30ms period as shown in Figure3a
extracted viaNvidia Nsight System. We also conducted experiments within two different GPU architectures - Pascal (1080) and Turing (2080) - with the same workload param-eters, and observed that they follow the similar utilization proportions with Pascal exhibiting higher utilization as shown in Figure3b. We intend to investigate further with different hardware architectures. Based on these observations, it ap-pears possible to exploit DL model architecture structure to predict GPU utilization.
(a) Example kernel patterns 0 20 40 60 80 100 LSTM Goog Len et LSTM Mo bile Net v2 ResN et5 0 Shuf fleN et_0 _5 VGG 19 Goog Len et Mo bile Net v2 ResN et5 0 Shuf fleN et_0 _5 VGG 19 G P U U ti liz ati o n % Nvidia 1080 Nvidia 2080 Ba tc h 16 Ba tc h 64 Ba tc h 12 8
(b) Utilization per device
Figure 3: DL workload utilization
5
Prediction Engine
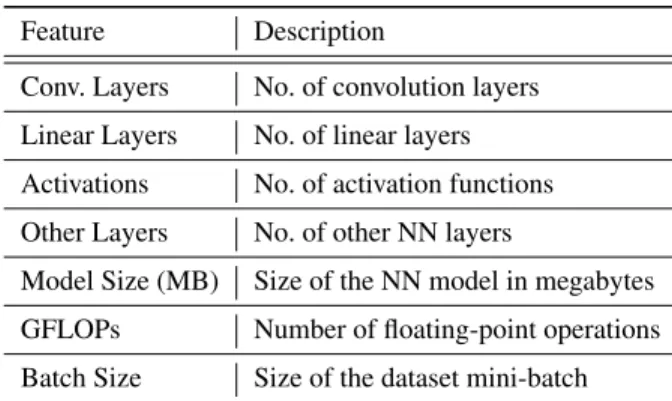
Overview.Our prediction engine extracts key DL workload features described in Table 2 via a process9 that iterates through the DL model as shown in Figure4. These features are normalized and provided as numerical inputs to a machine learning model. It requires an offline training stage on his-torical DL workload profiles. Such profiles can be acquired via developers running benchmarks or DL workloads mo-mentarily being the sole occupant of a GPU device, which we believe provides advantages over - and can be combined with - existing reactive approaches [10,19,37], as after suc-cessful model training, there is no need for isolated profiling for unique DL workload entering the system. The machine learning model can be periodically retrained after collecting additional profiles.
Feature Description
Conv. Layers No. of convolution layers Linear Layers No. of linear layers Activations No. of activation functions Other Layers No. of other NN layers
Model Size (MB) Size of the NN model in megabytes GFLOPs Number of floating-point operations Batch Size Size of the dataset mini-batch
Table 2: Selected DL model features for GPU utilization prediction
Features.The prediction engine iterates through the model and calculates the FLOPs for each operation based on its inputs, output shape, and parameters. For example, a stan-dard general matrix multiplication in FLOPs is calculated byinputs shape×outputs shape×batch size. Note that we modeled LSTM cell as two linear layers, as they perform ma-trix multiplication between the cell weights and inputs (e.g.
9Features are currently limited to PyTorch, we plan to integrate into Open
Neural Network Exchange formatting in future work.
Node Inp. Shape Out. Shape Params FLOPs
… … … … … MAT-MUL <64, 4096> <64, 1000> 1000 262m … … … … Input Transpose W: <64,3,3,3> Conv B: <4096,4096> Mat-Mul
Output Computation Model
Conv: 50 Linear: 1 ---FLOPs: 4.1G
Figure 4: Model graph FLOP characterization
input embedding, hidden states). Once the inputs are split into gates, gate computation can be modeled as activations. Finally, we counts the number of layer types. We believe that these features are sufficient due to their prominence within all current vision and language models.
Model Training.81 samples of features and utilization profiles were derived from experiments in Section4, and is of similar size comparable to prior work [19]. The training procedure consists of: 1) Random shuffling and splitting sam-ples into 80% training and 20% testing sets. 2) Applying established regression models on training set to investigate prediction effectiveness - we perform naive grid search on each regressor to train the model with 5-fold cross validation to find best parameters i.e.nestimators and max depth for tree-based regressors. 3) Testing our models with 20% testing set to ensure the model can generalize to unseen data.
Linear LightGBM [66] XGBoost [67] Random Forest [68] RMSLE 0.291 0.255 0.197 0.154
Table 3: Regressors Root Mean Square Log Error (RMSLE) for GPU utiliza-tion predicutiliza-tion
Model accuracy was determined via measuring regressor Root Mean Square Log Error (RMSLE)—an established mea-sure for regression accuracy when the under-prediction error is enlarged. This is suitable for utilization prediction: whilst overestimating GPU utilization is not ideal in terms of maxi-mizing resource efficiency, it is preferable than underestima-tion leading to unintended GPU over-allocaunderestima-tion,performance interference, cost budget underestimation.
We observe that the random forest model achieves RMSLE of 0.154, and outperforms gradient boosting machine models. We postulate that this may be due to our experiments con-taining a large proportion of CNN models, leading to random forests better fitted towards a set of data points as they nat-urally have higher variance than gradient boosting methods, where boosting are composed of weak learners [69].
1 1.5 2 2.5 3 3.5 4 4.5 5 25 50 75 100 125 150 175 200 No rma liz ed JC T sl ow do wn
Cumulative GPU utilization (%) (a) Slowdown vs. Utilization
0 10 20 30 40 50 60 70 80 90 100 0 100 200 300 A vg C lu st er G P U Ut ili zat io n ( % ) Time (m) Slot-based Reactive Predictive
(b) Average cluster GPU Utilization
Figure 5: Case study: GPU cluster co-location scheduling
6
Case Study: Prediction-based Scheduling
for DL Workload Co-location
We investigate the benefit of our proposed approach in co-location enabled DL workload scheduling (i.e. GPU sharing). While we present scheduling as a case study, the prediction engine has other applications in power management and cost modelling which we intend to expand upon in future work.
Co-location.Safe co-location of DL workloads is desir-able to improve resource-efficiency, with issues in perfor-mance interference and slowdown stemming from GPU over-allocation. Prior studies [10,19] indicate that co-location im-pacts Job Completion Time (JCT). To reinforce these findings, we conducted an initial analysis of JCT slowdown for 276 ex-ecution combinations of co-located DL models each set to run for 5 epochs. Figure5ashows that increases JCT correlates positively with cumulative GPU utilization with typical slow-down between 10%–200% JCT slowslow-down10per DL model.
Experiment.We integrated the prediction engine into a prototype co-location DL scheduler, deployed within a labo-ratory cluster (12 x 2080 GPU cluster, AMD Ryzen 1920 x 12 Core Processor, Kubernetes 1.15.2). The scheduler uses a modified First Fit Decreasing bin-packing algorithm to max-imize GPU utilization and minmax-imize GPU over-allocation, allows three jobs maximum co-located per GPU, and perform resubmission in the event of job OOM. We proactively pro-vide predicted GPU utilization values at job submission time. We compared our approach against slot-based (disallowed co-location) - i.e. the default kubernetes scheduler and a re-active online profiling approach, using a 1 minute period to profile in isolation until we can obtain training progress time and utilization value prior to co-location similar to [10]. Ex-periments were conducted using a mixture of DL workloads samples from Table1. Each experiment scheduled 100 DL workloads to all approaches five times each. Workloads are configured to execute between 2 minutes to 2 hours by defin-ing the appropriate epoch limit, scaled from prior work [15].
10Normalized JCT slowdown is calculated asTcolo−Tsolo Tsolo
, whereTsolois
DL JCT in isolation andTcolois DL JCT when co-located.
GPU Utilization (%) Makespan (m) Avg. St. Gain Avg. St. Gain Slot-based 43.1 16.7 - 306.9 1.15
-Reactive 47.1 21.4 9.2% 277.6 1.72 9.5%
Proactive 69.6 26.9 61.5% 204.0 8.5 33.6%
Table 4: Preliminary performance analysis of DL schedulers
Results.As summarized in Table4, our proactive approach achieved average 69.6% GPU utilization in comparison to slot-based (43.1%) and reactive (47.1%). This is due to re-duced time waiting for an isolated machine to obtain an accu-rate metric using online profiling, hence increasing utilization overall. We foresee that the reactive approach will achieve improved GPU utilization in a cluster with longer running DL workloads (i.e. where profiling time is small as aproportion of overall execution time), but would still require occupying a reserved GPU that may be otherwise available to other Cloud customers. In all experiment runs, our approach achieved the lowest makespan with a 33.6% improvement against slot-based, and a 24.3% improvement over the reactive approach. We found that slot-based scheduling achieved the lowest aver-age JCT of 1869s due to disallowing co-location, followed by prediction (2024s) and reactive (2193s).
Summary.From our preliminary study, we have found that our prediction engine appears to be promising approach to benefit DL schedulers supporting co-location, and believe that DL schedulers should encompass both reactive and proactive GPU utilization profiling together. Though we have conducted experiments on Pascal and Turing GPU architecture, we did not integrate distributed workload (i.e. AllReduce, Parameter server and workers) in our case study. We will discuss poten-tial approach to handle distributed workload in Section8.
7
Conclusion
Existing resource-efficient decisions for DL in the cloud made by providers and consumers are performed by understanding and exploiting workload metrics. However, they can only do so by performing online profiling. In this paper, we have proposed a prediction engine capable of predicting GPU uti-lization for heterogeneous DL workloads without the need for online profiling. We have identified several model features that relate to GPU utilization (most notably model FLOPs), and demonstrated prediction with RMSLE of 0.154. Based on these findings, we have experimented with several regression techniques and demonstrated the practicality of the prediction engine within a preliminary DL scheduler implementation for co-location, showing that it can be used to achieve an overall cluster GPU utilization of 69.6% in comparison to slot-based (43.1%) and conventional reactive (47.1%) approaches using online profiling.
8
Discussion
While our study of DL model utilization is promising, there are several directions that we believe would be highly interest-ing to the community. We note that there are DNN architec-tures that were excluded in this study, such as GAN and GNN. This opens an intuitive path for further feature exploration.
Hardware.It is established that accelerator performance is affected by the number of processing elements, cache size and memory bandwidth. We may be able to further generalise our approach to other GPU and accelerator architectures such as FPGAs. Note that, we have yet to establish to what extent GPU architectures affect the prediction methods needed.
DL Compilers.It is known that when executing convolu-tion, cudnn selects the best algorithm from winograd, fft and GEMM for the layer configuration, therefore it would be in-teresting for our approach to pre-determine these decisions to achieve higher utilization prediction accuracy. Furthermore, existing works leverage DL compilers such as TVM [70] for computation graph optimization to reduce the number of kernels launched and reduce latency. It may be worth to con-sider the intermediate outputs from these compilers to extract further information.
Training Procedure.Since we shuffle and split our sam-ples, it is possible for models within same architecture to reside within the train and test set. For example: ResNet50 -batch 64 in training set and ResNet50 - -batch 256 in testing set. We believe that in our current context it is acceptable as when using AutoML to search for best hyperparameters, it is possible that a DL model will be deployed with different batch sizes. In the future, we will investigate the robustness of our approach by randomly shuffling the samples w.r.t model architecture type (i.e. all ResNet must be in the same set).
Distributed Workload. Our prediction engine was de-signed for single GPU DL models, as recent analysis of pro-duction cluster traces [11,71] have shown that 86.6% of all DL workloads are currently trained within a single GPU. How-ever, it is likely that distributed DL workload will become increasingly prominent, and will result in performance bot-tlenecks due to network latency. By considering the intricate relationship between infrastructure i.e. Network I/O, CPU, Memory, and models impact on GPU utilization would be crucial towards achieving high performance and scalability in distributed DL training or inference.
Co-location Scheduling.Our prototype cluster scheduler has identified that there are potentially large performance gains possible via intelligent co-location of DL workload. We intend to improve upon this scheduler, and believe that optimization methods such as Mixed Integer Programming can be leveraged to derive a co-location aware optimization objective under resource constraints.
Acknowledgements
We would like to thank the anonymous HotCloud review-ers and our shepherd Arvind Krishnamurthy for their highly constructive comments and valuable feedback.
References
[1] N. P. Jouppi, C. Young, N. Patil, D. Patterson, G. Agrawal, R. Bajwa, S. Bates, S. Bhatia, N. Boden, A. Borcherset al., “In-datacenter performance analysis of a tensor processing unit,” inProceedings of the 44th Annual International Symposium on Computer Architec-ture, 2017, pp. 1–12.
[2] X. Jia, S. Song, W. He, Y. Wang, H. Rong, F. Zhou, L. Xie, Z. Guo, Y. Yang, L. Yu et al., “Highly scal-able deep learning training system with mixed-precision: Training imagenet in four minutes,” arXiv preprint arXiv:1807.11205, 2018.
[3] E. Chung, J. Fowers, K. Ovtcharov, M. Papamichael, A. Caulfield, T. Massengill, M. Liu, D. Lo, S. Alka-lay, M. Haselmanet al., “Serving dnns in real time at datacenter scale with project brainwave,”IEEE Micro, vol. 38, no. 2, pp. 8–20, 2018.
[4] IBM. (2020) Gpus for cloud servers | ibm. [Online]. Available:https://www.ibm.com/cloud/gpu
[5] Google. (2020) Cloud gpus | google cloud. [Online]. Available:https://cloud.google.com/gpu
[6] Amazon Web Services Inc. (2020) Amazon EC2 P3 – Ideal for Machine Learning and HPC - AWS. [Online]. Available:https://aws.amazon.com/ec2/instance-types/ p3/
[7] Microsoft Corporation. (2020) Azure VM sizes - GPU - Azure Virtual Machines.
[On-line]. Available: https://docs.microsoft.com/en-us/ azure/virtual-machines/sizes-gpu
[8] H. Shen, L. Chen, Y. Jin, L. Zhao, B. Kong, M. Phili-pose, A. Krishnamurthy, and R. Sundaram, “Nexus: a gpu cluster engine for accelerating dnn-based video anal-ysis,” inProceedings of the 27th ACM Symposium on Operating Systems Principles, 2019, pp. 322–337. [9] C. Zhang, M. Yu, W. Wang, and F. Yan, “Mark:
Exploit-ing cloud services for cost-effective, slo-aware machine learning inference serving,” in2019{USENIX}Annual Technical Conference ({USENIX}{ATC}19), 2019, pp. 1049–1062.
[10] W. Xiao, R. Bhardwaj, R. Ramjee, M. Sivathanu, N. Kwatra, Z. Han, P. Patel, X. Peng, H. Zhao, Q. Zhang
et al., “Gandiva: Introspective cluster scheduling for deep learning,” in13th USENIX Symposium on Oper-ating Systems Design and Implementation (OSDI 18), 2018, pp. 595–610.
[11] M. Jeon, S. Venkataraman, A. Phanishayee, J. Qian, W. Xiao, and F. Yang, “Analysis of large-scale multi-tenant GPU clusters for DNN training workloads,” in 2019 USENIX Annual Technical Conference (USENIX ATC 19), 2019, pp. 947–960.
[12] K. Hightower, B. Burns, and J. Beda,Kubernetes: up and running: dive into the future of infrastructure. " O’Reilly Media, Inc.", 2017.
[13] V. K. Vavilapalli, A. C. Murthy, C. Douglas, S. Agarwal, M. Konar, R. Evans, T. Graves, J. Lowe, H. Shah, S. Seth et al., “Apache hadoop yarn: Yet another resource nego-tiator,” inProceedings of the 4th annual Symposium on Cloud Computing, 2013, pp. 1–16.
[14] Q. Chen, H. Yang, M. Guo, R. S. Kannan, J. Mars, and L. Tang, “Prophet: Precise qos prediction on non-preemptive accelerators to improve utilization in warehouse-scale computers,” in Proceedings of the Twenty-Second International Conference on Architec-tural Support for Programming Languages and Operat-ing Systems, 2017, pp. 17–32.
[15] J. Gu, M. Chowdhury, K. G. Shin, Y. Zhu, M. Jeon, J. Qian, H. Liu, and C. Guo, “Tiresias: A{GPU}cluster manager for distributed deep learning,” in16th USENIX Symposium on Networked Systems Design and Imple-mentation (NSDI 19), 2019, pp. 485–500.
[16] Y. Peng, Y. Zhu, Y. Chen, Y. Bao, B. Yi, C. Lan, C. Wu, and C. Guo, “A generic communication scheduler for distributed dnn training acceleration,” inProceedings of the 27th ACM Symposium on Operating Systems Princi-ples, 2019, pp. 16–29.
[17] R. Phull, C.-H. Li, K. Rao, H. Cadambi, and S. Chakrad-har, “Interference-driven resource management for gpu-based heterogeneous clusters,” in Proceedings of the 21st international symposium on High-Performance Par-allel and Distributed Computing, 2012, pp. 109–120. [18] Y. Ukidave, X. Li, and D. Kaeli, “Mystic: Predictive
scheduling for gpu based cloud servers using machine learning,” in2016 IEEE International Parallel and Dis-tributed Processing Symposium (IPDPS). IEEE, 2016, pp. 353–362.
[19] X. Xu, N. Zhang, M. Cui, M. He, and R. Surana, “Char-acterization and prediction of performance interference on mediated passthrough gpus for interference-aware scheduler,” in11th{USENIX}Workshop on Hot Topics in Cloud Computing (HotCloud 19), 2019.
[20] Amazon Web Services Inc. (2020) EC2 Instance Pricing – Amazon Web Services (AWS). [Online]. Available:
https://aws.amazon.com/ec2/pricing/on-demand/
[21] J. Park, M. Naumov, P. Basu, S. Deng, A. Kalaiah, D. Khudia, J. Law, P. Malani, A. Malevich, S. Nadathur et al., “Deep learning inference in facebook data centers: Characterization, performance optimizations and hard-ware implications,”arXiv preprint arXiv:1811.09886, 2018.
[22] M. Wang, C. Meng, G. Long, C. Wu, J. Yang, W. Lin, and Y. Jia, “Characterizing deep learning training workloads on alibaba-pai,”arXiv preprint arXiv:1910.05930, 2019. [23] Y. Wang, G.-Y. Wei, and D. Brooks, “A systematic methodology for analysis of deep learning hardware and software platforms,” in Proceedings of Machine Learning and Systems 2020, 2020, pp. 30–43.
[24] Q. Chen, H. Yang, J. Mars, and L. Tang, “Baymax: Qos awareness and increased utilization for non-preemptive accelerators in warehouse scale computers,”ACM SIG-PLAN Notices, vol. 51, no. 4, pp. 681–696, 2016. [25] C. Delimitrou and C. Kozyrakis, “Paragon: Qos-aware
scheduling for heterogeneous datacenters,”ACM SIG-PLAN Notices, vol. 48, no. 4, pp. 77–88, 2013.
[26] C. Delimitrou, N. Bambos, and C. Kozyrakis, “Qos-aware admission control in heterogeneous datacenters,” inProceedings of the 10th International Conference on Autonomic Computing ({ICAC}13), 2013, pp. 291–296. [27] J. Mars, L. Tang, and R. Hundt, “Heterogeneity in “homogeneous” warehouse-scale computers: A perfor-mance opportunity,”IEEE Computer Architecture Let-ters, vol. 10, no. 2, pp. 29–32, 2011.
[28] R. Nathuji, A. Kansal, and A. Ghaffarkhah, “Q-clouds: managing performance interference effects for qos-aware clouds,” inProceedings of the 5th European con-ference on Computer systems, 2010, pp. 237–250. [29] C. Delimitrou and C. Kozyrakis, “ibench: Quantifying
interference for datacenter applications,” in2013 IEEE international symposium on workload characterization (IISWC). IEEE, 2013, pp. 23–33.
[30] C. Delimitrou and C. Kozyrakis, “Quasar: resource-efficient and qos-aware cluster management,”ACM SIG-PLAN Notices, vol. 49, no. 4, pp. 127–144, 2014. [31] D. Lo, L. Cheng, R. Govindaraju, P. Ranganathan, and
C. Kozyrakis, “Heracles: Improving resource efficiency at scale,” inProceedings of the 42nd Annual Interna-tional Symposium on Computer Architecture, 2015, pp. 450–462.
[32] J. Mars, L. Tang, R. Hundt, K. Skadron, and M. L. Soffa, “Bubble-up: Increasing utilization in modern warehouse scale computers via sensible co-locations,” in Proceed-ings of the 44th annual IEEE/ACM International Sym-posium on Microarchitecture, 2011, pp. 248–259. [33] H. Yang, A. Breslow, J. Mars, and L. Tang, “Bubble-flux:
Precise online qos management for increased utilization in warehouse scale computers,”ACM SIGARCH Com-puter Architecture News, vol. 41, no. 3, pp. 607–618, 2013.
[34] Y. Zhang, M. A. Laurenzano, J. Mars, and L. Tang, “Smite: Precise qos prediction on real-system smt pro-cessors to improve utilization in warehouse scale com-puters,” in2014 47th Annual IEEE/ACM International Symposium on Microarchitecture. IEEE, 2014, pp. 406–418.
[35] R. Xu, S. Mitra, J. Rahman, P. Bai, B. Zhou, G. Bron-evetsky, and S. Bagchi, “Pythia: Improving datacenter utilization via precise contention prediction for multiple co-located workloads,” inProceedings of the 19th Inter-national Middleware Conference, 2018, pp. 146–160. [36] R. Yang, C. Hu, X. Sun, P. Garraghan, T. Wo, Z. Wen,
H. Peng, J. Xu, and C. Li, “Performance-aware specula-tive resource oversubscription for large-scale clusters,” IEEE Transactions on Parallel and Distributed Systems, vol. 31, no. 7, pp. 1499–1517, July 2020.
[37] P. Thinakaran, J. R. Gunasekaran, B. Sharma, M. T. Kan-demir, and C. R. Das, “Kube-knots: Resource harvesting through dynamic container orchestration in gpu-based datacenters,” in2019 IEEE International Conference on Cluster Computing (CLUSTER). IEEE, 2019, pp. 1–13.
[38] M. Tan and Q. V. Le, “Efficientnet: Rethinking model scaling for convolutional neural networks,”arXiv preprint arXiv:1905.11946, 2019.
[39] Z. Li, E. Wallace, S. Shen, K. Lin, K. Keutzer, D. Klein, and J. E. Gonzalez, “Train large, then compress: Re-thinking model size for efficient training and infer-ence of transformers,”arXiv preprint arXiv:2002.11794, 2020.
[40] NVIDIA. (2020) Using CUDA
warp-level primitives | NVIDIA developer blog. [Online]. Available: https://devblogs.nvidia.com/ using-cuda-warp-level-primitives/
[41] Z. Guz, E. Bolotin, I. Keidar, A. Kolodny, A. Mendel-son, and U. C. Weiser, “Many-core vs. many-thread machines: Stay away from the valley,”IEEE Computer Architecture Letters, vol. 8, no. 1, pp. 25–28, 2009.
[42] M. Sandler, A. Howard, M. Zhu, A. Zhmoginov, and L.-C. Chen, “Mobilenetv2: Inverted residuals and linear bottlenecks,” inProceedings of the IEEE Conference on Computer Vision and Pattern Recognition, 2018, pp. 4510–4520.
[43] K. He, X. Zhang, S. Ren, and J. Sun, “Deep residual learning for image recognition,” inProceedings of the IEEE conference on computer vision and pattern recog-nition, 2016, pp. 770–778.
[44] C. Szegedy, W. Liu, Y. Jia, P. Sermanet, S. Reed, D. Anguelov, D. Erhan, V. Vanhoucke, and A. Rabi-novich, “Going deeper with convolutions,” inComputer Vision and Pattern Recognition (CVPR), 2015. [Online]. Available:http://arxiv.org/abs/1409.4842
[45] K. Simonyan and A. Zisserman, “Very deep convo-lutional networks for large-scale image recognition,” CoRR, vol. abs/1409.1556, 2014.
[46] S. Xie, R. Girshick, P. Dollár, Z. Tu, and K. He, “Aggre-gated residual transformations for deep neural networks,” inProceedings of the IEEE conference on computer vi-sion and pattern recognition, 2017, pp. 1492–1500. [47] F. N. Iandola, S. Han, M. W. Moskewicz, K. Ashraf,
W. J. Dally, and K. Keutzer, “Squeezenet: Alexnet-level accuracy with 50x fewer parameters and< 0.5 mb model size,”arXiv preprint arXiv:1602.07360, 2016.
[48] G. Huang, Z. Liu, L. Van Der Maaten, and K. Q. Wein-berger, “Densely connected convolutional networks,” in Proceedings of the IEEE conference on computer vision and pattern recognition, 2017, pp. 4700–4708. [49] N. Ma, X. Zhang, H.-T. Zheng, and J. Sun, “Shufflenet
v2: Practical guidelines for efficient cnn architecture design,” inProceedings of the European Conference on Computer Vision (ECCV), 2018, pp. 116–131.
[50] M. Tan, B. Chen, R. Pang, V. Vasudevan, M. Sandler, A. Howard, and Q. V. Le, “Mnasnet: Platform-aware neural architecture search for mobile,” inProceedings of the IEEE Conference on Computer Vision and Pattern Recognition, 2019, pp. 2820–2828.
[51] D. Han, J. Kim, and J. Kim, “Deep pyramidal resid-ual networks,” inProceedings of the IEEE Conference on Computer Vision and Pattern Recognition, 2017, pp. 5927–5935.
[52] Y. Chen, J. Li, H. Xiao, X. Jin, S. Yan, and J. Feng, “Dual path networks,” inAdvances in Neural Information
Processing Systems, 2017, pp. 4467–4475.
[53] A. Vaswani, N. Shazeer, N. Parmar, J. Uszkoreit, L. Jones, A. N. Gomez, Ł. Kaiser, and I. Polosukhin,
“Attention is all you need,” inAdvances in neural infor-mation processing systems, 2017, pp. 5998–6008. [54] F. A. Gers, J. Schmidhuber, and F. Cummins, “Learning
to forget: Continual prediction with lstm,” 1999. [55] A. Krizhevsky, G. Hintonet al., “Learning multiple
lay-ers of features from tiny images,” Citeseer, Tech. Rep., 2009.
[56] S. Merity, C. Xiong, J. Bradbury, and R. Socher, “Pointer sentinel mixture models,” arXiv preprint
arXiv:1609.07843, 2016.
[57] A. M. T. (WMT19). Shared task: Machine translation of news. [Online]. Available: http://www.statmt.org/ wmt19/translation-task.html
[58] Y. Peng, Y. Bao, Y. Chen, C. Wu, and C. Guo, “Optimus: an efficient dynamic resource scheduler for deep learn-ing clusters,” inProceedings of the Thirteenth EuroSys Conference, 2018, pp. 1–14.
[59] A. Harlap, D. Narayanan, A. Phanishayee, V. Seshadri, N. Devanur, G. Ganger, and P. Gibbons, “Pipedream: Fast and efficient pipeline parallel dnn training,”arXiv preprint arXiv:1806.03377, 2018.
[60] H. Qi, E. R. Sparks, and A. Talwalkar, “Paleo: A perfor-mance model for deep neural networks,” inProceedings of the International Conference on Learning Represen-tations, 2017.
[61] D. Han, J. Kim, and J. Kim, “Deep pyramidal residual networks,”IEEE CVPR, 2017.
[62] M. Gardner, J. Grus, M. Neumann, O. Tafjord, P. Dasigi, N. F. Liu, M. Peters, M. Schmitz, and L. S. Zettlemoyer, “Allennlp: A deep semantic natural language processing
platform,” 2017.
[63] A. Paszke, S. Gross, F. Massa, A. Lerer, J. Bradbury, G. Chanan, T. Killeen, Z. Lin, N. Gimelshein, L. Antiga et al., “Pytorch: An imperative style, high-performance deep learning library,” inAdvances in Neural Informa-tion Processing Systems, 2019, pp. 8024–8035.
[64] H. Cai, C. Gan, and S. Han, “Once for all: Train one net-work and specialize it for efficient deployment,”arXiv preprint arXiv:1908.09791, 2019.
[65] I. Radosavovic, R. P. Kosaraju, R. Girshick, K. He, and P. Dollár, “Designing network design spaces,” inCVPR, 2020.
[66] G. Ke, Q. Meng, T. Finley, T. Wang, W. Chen, W. Ma, Q. Ye, and T.-Y. Liu, “Lightgbm: A highly efficient gradient boosting decision tree,” inAdvances in neural information processing systems, 2017, pp. 3146–3154. [67] T. Chen and C. Guestrin, “Xgboost: A scalable tree boosting system,” in Proceedings of the 22nd acm sigkdd international conference on knowledge discovery and data mining, 2016, pp. 785–794.
[68] A. Liaw, M. Wieneret al., “Classification and regression by randomforest,”R news, vol. 2, no. 3, pp. 18–22, 2002. [69] J. H. Friedman, “Stochastic gradient boosting,” Com-putational statistics & data analysis, vol. 38, no. 4, pp. 367–378, 2002.
[70] T. Chen, T. Moreau, Z. Jiang, L. Zheng, E. Yan, M. Cowan, H. Shen, L. Wang, Y. Hu, L. Ceze, C. Guestrin, and A. Krishnamurthy, “Tvm: An auto-mated end-to-end optimizing compiler for deep learn-ing,” inProceedings of the 12th USENIX Conference on Operating Systems Design and Implementation, ser. OSDI’18. USA: USENIX Association, 2018, p. 579–594.
[71] S. Chaudhary, R. Ramjee, M. Sivathanu, N. Kwatra, and S. Viswanatha, “Balancing efficiency and fairness in heterogeneous gpu clusters for deep learning,” in Proceedings of the Fifteenth European Conference on Computer Systems, ser. EuroSys ’20. New York, NY, USA: Association for Computing Machinery, 2020. [Online]. Available: https://doi.org/10.1145/3342195. 3387555