Consequences of handling missing data for treatment response
in osteoarthritis: a simulation study
I.C. Olsen
*, T.K. Kvien, T. Uhlig
Dept. of Rheumatology, Diakonhjemmet Hospital, Oslo, Norway
a r t i c l e i n f o
Article history: Received 3 October 2011 Accepted 9 March 2012 Keywords: Missing data Multiple imputation OsteoarthritisOMERACTeOARSI responder criteria
s u m m a r y
Objective:To understand how handling of missing data influences the statistical power and bias of treatment effects in randomised controlled trials of painful knee osteoarthritis (OA).
Methods:We simulated trials with missing data (withdrawals) due to lack-of-efficacy. Outcome measures were response/non-response according to the Outcome Measures in RheumatologyeOsteoarthritis Research Society International (OMERACTeOARSI) set of responder criteria, Western Ontario and McMaster Universities Osteoarthritis Index (WOMAC) pain and physical function from the WOMAC questionnaire, and patient global assessment. We usedfive methods for managing missing data: ignoring the missing data, last and baseline observation carried forward (LOCF and BOCF), and multiple impu-tation with two different strategies. The treatment effect was then analysed by appropriate univariate and longitudinal statistical methods, and power, bias and mean squared error (MSE) was assessed by comparing the estimated treatment effect in the trials with missing data with the estimated treatment effect on the trials without missing data.
Results:The best imputation method in terms of high power and low bias/MSE was our implementation of regression multiple imputation. The most conservative method was the data augmentation Markov chain Monte Carlo (MCMC) multiple imputation. The LOCF, BOCF and the complete-case methods were not particularly conservative and gave relatively low power and high bias. The analysis on the WOMAC pain scale gave less bias and higher power than the OMERACTeOARSI responder outcome measure.
Conclusions:Multiple imputation of missing data may be used to decrease bias/MSE and increase power in OA trials. These results can guide investigators in the choice of outcome measures and especially how missing data can be handled.
Ó2012 Osteoarthritis Research Society International. Published by Elsevier Ltd. All rights reserved.
Introduction
Osteoarthritis (OA) is the most common form of arthritis and is widely recognised as a major cause of chronic disability in the population1. Thus, the interest in developing new or improved treatments for OA is high, and this leads to a large number of OA clinical trials. One of several problems in OA clinical trials (as for most clinical trials) is the frequent occurrence of missing data. The main reasons for missing data are usually lack-of-efficacy, adverse events or loss of follow-up. Missing data are a major challenge in the analysis of the data and interpretation of the results, and is influencing how data are analysed according to the
intention-to-treat (ITT) principle2. If missing data are treated inadequately, the statistical power of detecting treatment effects may be reduced, the variability might be underestimated and bias may affect the esti-mation of the treatment effect, the comparability of the treatment groups and the generalizability of the results3,4.
The problem of missing data is acknowledged in the liter-ature2,4e8. It is generally accepted that no technique is generally applicable, and reasons for missing data, properties of the outcome measures, and the models used for analysing the end-points require different solutions3. In general there are three much used approaches to address missing data: (1) Approaches based on completely recorded units discard subjects with missing outcomes might be satisfactory with small amount of missing data, but may lead to serious biases. (2) Model based approaches try to account for missing data within the model, while (3) imputation based approaches impute more or less sensible values where the outcome measures are missing. The purpose of imputing data is to create a complete data set without missing data, to enable the use of
*Address correspondence and reprint requests to: I.C. Olsen, Diakonhjemmet Hospital, Postboks 23, Vinderen, N-0319 Oslo, Norway. Tel: 47-41-45-95-97; Fax: 47-22-45-16-06.
E-mail address:[email protected](I.C. Olsen).
1063-4584/$esee front matterÓ2012 Osteoarthritis Research Society International. Published by Elsevier Ltd. All rights reserved. doi:10.1016/j.joca.2012.03.005
standard statistical methods. Needless to say, the way missing data are imputed is important to the result. None of these approaches solve the problem between the ITT principle and missing data, but some methods might be better suited than others.
By simulating clinical trials with computer intensive procedures, it is possible to compare different methods of handling missing data9,10. By this approach, trial outcomes are generated by statis-tical simulation models similar to the outcomes we would expect to see in real trials. Observations are then taken out according to some pre-specified random rule, which mimics how missing data are generated in clinical trials. By comparing analysis of simulated trial data set with and without missing data, it is possible to assess how the missing data influence the results.
The aim of this study was to evaluate how the management of missing data in simulated trials did impact the estimates of outcome and power of the proportion of responders according to the OMERACTeOARSI set of responder criteria11. We also wanted to explore the gains and losses of using a set of responder criteria compared to the separate components of set, especially with respect to missing data. We performed a simulation study in order
to control all elements of an OA trial, from the design to the missing-data mechanism. The framework was based on previous simulation studies10.
Methods
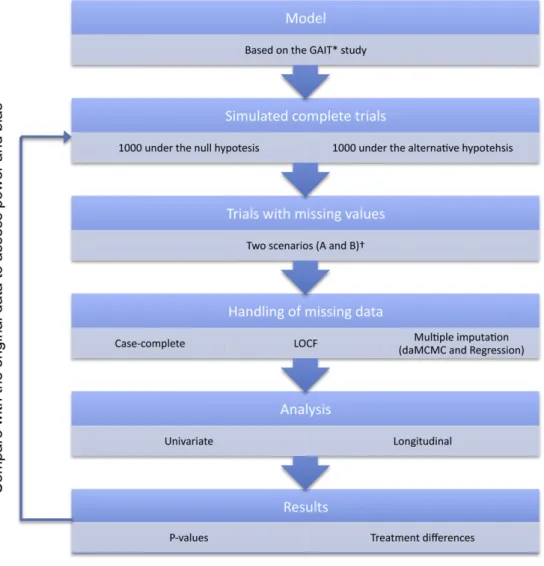
An overview of the method used in this study is displayed in
Fig. 1.
Variables
The effect of OA treatment has traditionally been evaluated by assessment of pain, physical function and patient’s global assess-ment (PGA)11 A much used instrument for assessing pain and physical function is the Western Ontario and McMaster Universities Osteoarthritis Index (WOMAC) questionnaire12. We used the nor-malised Likert version of this questionnaire (nWOMAC LK 3.1), which scores the impact of OA on the subscales pain and physical function on a 0e100 scale. In addition, we included a visual-analogue (0e100) scale (VAS) for the assessment of PGA.
Lately there has been a focus to combine these assessments in a composite outcome variable. In a joint effort, the Osteoarthritis Research Society International (OARSI) and the Outcome Measures in Rheumatology (OMERACT) group united for an initiative for the harmonisation and standardisation of outcome measures for analysis and reporting results from OA clinical trials13. The OMERACTeOARSI initiative resulted in a set of responder criteria for use in OA clinical trials, incorporating assessments of pain, physical function and PGA to identify responding patients14. The use of response to treatment as an outcome measure has several advantages, including greater face validity, medical interpretability and avoidance of multiple tests11.
The simulated trials
We simulated data from a model for typical outcome measures found in OA trials. The simulated data represent a general, unspecified two-armed randomised controlled trial (RCT) with a control group and an experimental group with five repeated assessments (baseline and 4, 8, 16 and 24 weeks after random-isation). The standard deviations, withdrawal rates and time of assessments (but not the number of arms) used in the simulations were inspired by a large trial on the effect of glucosamine and chondroitin sulfate compared to placebo and celecoxib in the treatment of OA [the Glucosamine/chondroitin Arthritis Interven-tional Trial (GAIT)]15. This trial included patients of at least 40 years of age with clinical and radiographic evidence of OA and mild to severe baseline pain of the knee (25e80 on the normalised WOMAC subscale score for pain). The outcome measures were among others OMERACTeOARSI responders, WOMAC pain and physical function, and PGA VAS.
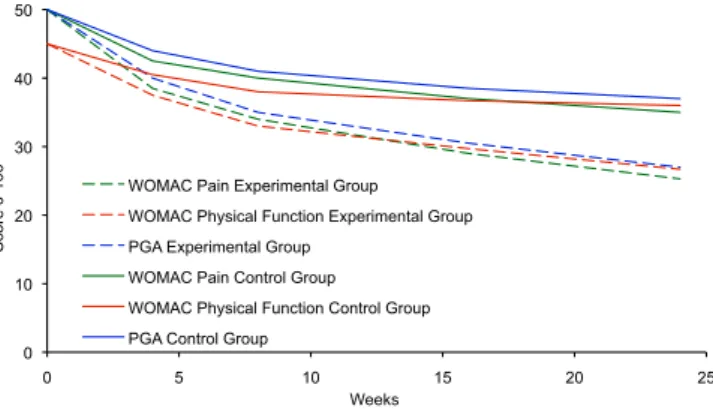
In order to identify OMERACTeOARSI responders, we simulated WOMAC pain and physical function together with the PGA for each patient at each assessment both under the null hypothesis (no difference between the treatment groups) and under an alternative hypothesis. The treatment differences after 24 weeks under the alternative hypothesis were set to 9.3 and 9.7 (normalised units) for the WOMAC dimensions pain and physical function [in accordance with the Minimal Perceptible Clinical Improvement (MPCI)16] and 10 for the PGA VAS. Figure 2 shows the treatment difference development by time. The standard deviations were generally set to 22.0 (pain), 21.0 (physical function) and 27.0 (PGA). We corre-lated the outcomes within each patient both between the indi-vidual scores (pain, physical function and PGA) and between the repeated assessments.
An absolute increase in the response rate of 15%, as compared with the rate in the placebo group, was in GAIT considered to
indicate a clinically meaningful treatment effect. Adopting this figure, we calculated that a sample size of 340 patients (170 in each group) was needed by the chi-square test to reach a power of 80%. We simulated altogether 2000 trials with 340 patients in each: 1000 trials under the null hypothesis (no difference between the treatment groups) and 1000 trials under the alternative hypothesis based on the GAIT results and the MPCI (Fig. 1).
Generation of missing data
Having simulated the WOMAC pain and physical function values together with the PGA score (forming the complete trial data set), patient’s data were deleted according to a predefined random procedure to establish trial data sets with missing data. We deleted data such that after thefirst deleted observation all subsequent observations were also deleted (a monotone missing pattern), thus simulating a trial where the only source of missing data was due to withdrawal of patients. We aimed at a withdrawal rate of 20e40%, which must be expected in trials of 24-week duration.
We implemented two random procedures for deletion of data, denoted as missing data scenario A and B. We wanted to make the withdrawal probability dependent on the outcome, thus making the data missing not at random (MNAR)7. Thefirst procedure for withdrawing patients (missing data scenario A) was set to be dependent on the mean change of the pain, physical function and PGA assessment between two visits. The probability of withdrawal was set to 5% if the patient had improved, 12.5% if the patient deteriorated with less than 10 points and 30% if the deterioration was more than 10 points. This mechanism was expected to result in more withdrawals in the placebo group under the alternative hypothesis because the active treatment would protect against deterioration in pain, physical function and PGA. The withdrawal rate under the null hypothesis was expected to be the same for the two treatment groups.
The second missing data procedure (missing data scenario B) was implemented such that patients with active treatment and lack of effect had a higher probability of withdrawing, mimicking a process where unwanted adverse events related to the active treatment would be inducing patients to withdraw in the case of lack-of-efficacy. For the second procedure the withdrawal proba-bility was set to 5%, 15% and 35% in the experimental group and 5%, 10% and 25% in the control group. It was expected that the differ-ence in withdrawal probability would level out the effect of adherence to active treatment, and that the withdrawal rate would be equal in the two treatment groups under the alternative hypothesis. Under the null hypothesis, the withdrawal rate in the active group was expected to be higher than in the placebo group.
Statistical analyses methods
As described earlier, we used four outcome measures in the data sets we produced: The OMERACTeOARSI response (dichotome); WOMAC pain and physical function (continuous); and PGA on the VAS (continuous). The impact of missing data on the results relies on the statistical methods used for analysing the outcome, and we wanted to deploy several methods in order to identify differences between them. We used two different strategies for statistical analyses, univariate and longitudinal. For the univariate analyses we used the last visit (after 24 weeks) observation only, while for the longitudinal analysis we used the observations from all visits. In the univariate analysis the treatment difference was assessed using the chi-square test for the dichotome response outcome and the Analysis of Covariance (ANCOVA) model (adjusting for baseline) for the continuous outcomes. In the longitudinal analysis we used repeated logistic regression (by generalised estimating equations
0 10 20 30 40 50 0 5 10 15 20 25 Score 0-100 Weeks WOMAC Pain Experimental Group WOMAC Physical Function Experimental Group PGA Experimental Group
WOMAC Pain Control Group WOMAC Physical Function Control Group PGA Control Group
Fig. 2.WOMAC subscale scores for pain and physical function, and PGA for experi-mental and control group in the simulation model under the alternative hypothesis.
(GEE)17) for the dichotome response outcome and mixed models for repeated measures (MMRM)7for the continuous outcomes.
These methods represent much used methods for dichotome and continuous measures in RCTs. The univariate analyses corre-spond to the methods used by Clegget al.15, while longitudinal methods are advocated to increase precision and accommodate missing data. With respect to missing data it has been shown that likelihood based methods (such as mixed models and generalized linear mixed models) will provide unbiased estimates if the data are missing at random (MAR)7. The MAR assumption is fulfilled if we can assume that the data are missing independent of what we would have observed if the data were not missing, but might be dependent on what we have observed (outcome measures and covariates). Note that this result does not apply to methods based on GEE, which generally requires data to be missing completely at random (MCAR) to yield unbiased estimates. We can assume MCAR if the data are missing independent of both observed and unob-served measures, which is a stronger assumption than MAR.
Methods for handling missing data
Numerous methods exist for handling missing data in statistical analyses7. In this study we applied five methods for handling missing data: the case-complete (all available data) method, the last and baseline observation carried forward (LOCF and BOCF) methods and two different approaches of multiple imputation (MI). The case-complete method ignores the missing data and the analyses are based only on observed data. For the univariate anal-ysis this means that missing observations were omitted, while for the longitudinal analysis all available observations were included in the analysis. The LOCF and BOCF methods are single imputation methods where the last known observation (LOCF) or the baseline observation (BOCF) is carried forward for all withdrawn subjects. The MI method replaces each missing value of an incomplete data set with a set of plausible values that represent the uncertainty in the correct value to impute7,10,18. We used two different methods for the imputation: (1) The data augmentation Markov chain Monte Carlo (daMCMC) replacement method19 is often used as it only takes into account the correlation between the observations and does not model the missing data further. It is also applicable for intermediate missing values. By the way we implemented this method we did not take possible effects of treatment into consid-eration. This is a very conservative approach, as it assumes no treatment effect for the imputed values in the experimental treat-ment group. (2) The regression methodfits a regression model to the data and uses thisfitted model to impute missing values. The regression method requires monotone missing data, meaning that once a subject has a missing value, the remaining values are also missing for this subject7. This requirement was met in our simu-lated trials. We implemented the regression MI method with treatment as an exploratory factor in the regression model. This approach is less conservative than our implementation of the daMCMC MI method.
After the imputation, each simulated trial was analysed by the corresponding statistical models (univariate and longitudinal), and results were combined in a single analysis yielding point estimates and standard errors. We used 10 imputations for each missing observation.
Measuring impact of missing data
We effectively simulated 4000 trials (2000 simulated trial data sets with two different procedures for missing data) with 340 patients in each. For each simulated trial we applied the different methods for handling missing data and analysed them with the
different statistical methods. The results from the analyses of the trial data sets with missing data were then compared with the original (no missing values) data. In this way we were able to assess the impact that the different approaches for handling missing data. The different methods for handling missing data were assessed by (1) the ability to wrongfully reject the null hypothesis (the Type I error), (2) the power to discover true differences between the treatments, (3) the bias of the estimated treatment effect compared to the treatment effect of the original (no missing values) data and (4) the mean squared error (MSE). These four assessments were regarded as the outcome measures of our study.
We estimated the probability of wrongfully rejecting the null hypothesis (Type I error) by analysing the simulated trials under the null hypothesis. The probability of a Type I error was calculated as the proportion of trials withP-values less than 0.05. Analysing the simulated alternative-hypothesis trials and calculating the proportion of trials that rejected the null-hypotheses estimated the power. We calculated the bias of the estimated treatment effect by the absolute and relative difference between the average estimated treatment effect of the trials with and without missing data. The MSE was calculated as the sum of the estimated variance of the treatment effect and the squared absolute bias.
The simulations were performed using R 2.8.1 (R Foundation for Statistical Computing, Vienna, Austria), and the handling of missing data and data analysis was performed using SAS 9.2 (SAS Institute, Cary, USA).
Results
Rate of missing data
The withdrawal rates according to hypothesis and missing data procedures are presented inTable I. As expected, the withdrawal rate under the null hypothesis is almost equal for missing data scenario A, while there is an increased withdrawal rate in the experimental group for scenario B. Under the alternative hypoth-esis there is a higher withdrawal rate in the control group for scenario A, while the withdrawal rate is almost equal for scenario B.
Analysis of the OMERACTeOARSI responders
For the univariate analyses, the probability of Type I error was below 5% for all approaches under both missing data scenario A and B, except for the case-complete approach under scenario B. For the longitudinal analyses, the probability of Type I error was above 5% for the case-complete and LOCF approach for both scenarios in addition to the BOCF approach for scenario B. The MI daMCMC approach generally had the lowest probability of Type I error (Table II).
Table I
Mean withdrawal rate in simulated trials by hypothesis, scenario and treatment group
Hypothesis Missing data procedure Experimental group (%) Control group (%) Total (%) Null Scenario A 33.6 33.4 33.5 Scenario B 30.6 36.3 33.5 Alternative Scenario A 28.7 33.6 31.1 Scenario B 30.5 30.5 30.5
Scenario A: Withdrawal probability dependent only on outcome (higher if deteri-orating).
Scenario B: Withdrawal probability dependent both on outcome and treatment (higher if deteriorating and in the experimental group).
Null hypothesis: No difference between the groups.
The power was generally lowest for the MI daMCMC approach and highest for the MI regression approach. The lowest bias and MSE was attained using MI regression approach whatever the analysis, while the highest was attained using the MI daMCMC approach. Note that there were two longitudinal analyses with a positive bias under scenario B (case-complete and MI regression) (Table II).
Analysis of the continuous variables
The results from the WOMAC pain, physical function and PGA were similar and only results from the WOMAC pain scale are presented (Table III). Generally the power was higher and the treatment effect less biased compared to the results for the OMERACTeOARSI responders. The best results (lowest bias/MSE and largest power) were found for the MI regression method and for repeated analysis of the case-complete method. The Type I error rate was generally too high for these methods, especially for the case-complete method. The lowest probability of making a Type I error was found for the MI daMCMC method (Table III).
Discussion
This simulation study examined various approaches to manage missing data in RCTs of OA treatments with both dichotomized and continuous outcome measures. The overall best method with highest power and lowest bias for imputing missing data was the MI method with a regression model where the treatment was included as an explanatory factor. The lowest probability of a Type I error was achieved by MI using the daMCMC approach with no treatment factor. This approach may therefore be regarded as the most conservative.
There are other studies assessing the impact of missing data in rheumatology. A simulation study on missing data methods in RCTs of rheumatoid arthritis with radiographic outcomes showed that
MI was superior to other methods in terms of bias and power2. For osteoporosis, a simulation study evaluated different handling strategies for missing data (not including MI) without concluding with a preferred method8. For OA, the influence of several impu-tation techniques (including LOCF and MI) on the sample size estimation has been shown in a study focussing on a radiographic outcome5. To our knowledge, the current simulation study is the first to assess the impact of missing data on outcomes in a clinical trial in OA.
The MI method generally consists of two distinct parts. Thefirst part is the imputation; the second part is the analysis of the imputed data sets where the uncertainty introduced in the impu-tation part is included in the estimates. These two parts can be handled separately, even using different models. We did this in our daMCMC MI method since we modelled the data without a treat-ment term in the imputation part, while we did the analysis in the second step with a treatment term. This is called uncongenial modelling of the imputation20, in contrast to congenial modelling where the imputation model and the analysis model are consistent (as we did in the regression method). Effectively, modelling without a treatment term means that we impute values assuming that there are no differences between the groups. This clearly introduces a bias in our estimates, but the bias is conservative. Using MI with a model without a treatment term offers a very good method for sensitivity analysis since it is transparent, it is conser-vative and it takes the uncertainty of the imputations into consid-eration (as opposed to single imputation methods).
The analysis of the WOMAC pain outcome measure generally gave less bias and higher power than the OMERACTeOARSI responder outcome measure, but was slightly more prone to Type I errors. This also applied to the WOMAC physical function and PGA measures (data not shown). Thisfinding can be relevant when selecting a primary outcome measure for clinical trials. Generally it is advised that efficacy should not be assessed on only one domain (e.g., pain). The adopted European view is that“Studies should be
Table II
Type I error and power after simulation with different management strategies for missing data for responders applying OMERACTeOARSI criteria Missing data procedure Data analysis Management of missing data
Null hypothesis Alternative hypothesis Probability of
Type I error (%)
Power (%) Treatment effect: relative bias*
Treatment effect: absolute biasy
MSE
None Chi-square Complete data setz 4.3 90.2 0 0 25.1
GEE Complete data setz 5.5 91.6 0 0 25.1
Scenario A Chi-square Case-complete 4.5 67.1 14.5 2.5 39.6
LOCF 4.5 74.6 15.7 2.7 34.9
BOCF 3.7 69.9 18.9 3.3 40.9
MI daMCMC 1.1 54.3 32.4 5.6 49.5
MI regression 3.4 79.4 9.3 1.6 28.1
GEE All available data 5.5 71.5 5.8 1.1 42.1
LOCF 5.4 77.0 21.7 4.1 41.4
BOCF 4.9 72.9 26.9 5.0 52.5
MI daMCMC 0.9 53.5 26.4 4.9 47.0
MI regression 3.2 78.8 3.0 0.6 29.2
Scenario B Chi-square Case-complete 6.0 80.4 1.8 0.3 34.1
LOCF 4.2 68.3 22.5 3.9 42.6
BOCF 4.9 56.1 29.4 5.0 55.0
MI daMCMC 1.0 67.7 24.7 4.3 37.2
MI regression 4.7 87.8 0.4 0.1 26.5
GEE All available data 7.8 83.9 7.1 1.3 41.1
LOCF 5.4 73.2 27.8 5.2 52.9
BOCF 6.1 59.3 36.1 6.8 72.6
MI daMCMC 0.9 65.6 18.8 3.5 35.5
MI regression 4.4 87.0 5.7 1.1 30.2
Scenario A: Missing data as function of lack-of-efficacy with 28.7% drop-out in the experimental group and 33.6% drop-out in the control group. Scenario B: Missing data as function of lack-of-efficacy with 30.5% drop-out in both the experimental and the control treatment group.
*Expressed as percentage.
yExpressed as OMERACTeOARSI responder rate in percent. zOriginal data sets with no missing data.
powered to demonstrate a significant effect on both pain and functional disability”1. This introduces multiplicity in the analyses that needs to be addressed.
The impact of missing data in RCTs is difficult to assess and is related to the question of what would have been observed if no patient had withdrawn from the trial. If we can assume that the data are MAR, any estimators based on the maximum likelihood principle will provide unbiased estimates7. In our study, both the MMRM analysis of all available data as well as MI with a treatment term produce maximum likelihood based estimates, and are equivalent under the MAR assumption. When the data are assumed to be MAR, MMRM models might be preferable to MI methods because they are easier to implement. The MAR assumption is, however, usually not met in RCTs3. By utilising simulated data we were able to observe how missing data, which are not MAR, influence the analyses. We considered two situations where the missing data were dependent on what would have been observed. Both our procedures to delete data imitate withdrawal due to lack-of-efficacy, with a high probability of withdrawal if the condition worsens. In scenario A the mechanism was equal for both treat-ments, resulting in an expected higher withdrawal rate for the control group under the alternative hypothesis. In scenario B the mechanism was designed in disfavour of the experimental group, resulting in an expected equal withdrawal rate between the groups under the alternative hypothesis. Interestingly, the missing data mostly resulted in an underestimation of the treatment effect. The underestimation is quite understandable for the MI daMCMC and BOCF methods since they effectively impute values with no difference between the treatment groups. For the other methods the situation is subtler, but the overestimation of the treatment effect for the repeated analysis of the MI regression data is not reassuring. Results from scenario B indicate that the use of repeated logistic regression could be less suitable for the OMERACTeOARSI responders, especially since the overestimation is much less pronounced in the analysis of WOMAC pain.
The most important property of any method for handling missing data is to avoid a wrongfully rejection of the null hypoth-esis (Type I error). In our study, most methods gave an adequate control of the Type I error with the exception of the analysis of case-complete data, which resulted in a too high probability of Type I error (especially for scenario B). Interestingly, the BOCF method was not particularly conservative with respect to Type I error, although it underestimated the treatment effect most. When the Type I error is controlled, the bias, power and MSE are equally important and linked such that a biased estimator induces low power and high MSE.
An important understanding resulting from this study is that the handling of missing data influences the results, and that there is no uniformly best method (although some are better than others). This points to two important implications for the analysis of RCTs: (1) In order to avoid selective reporting of results according to handling of missing data, the method used for the primary endpoint should be pre-specified in the protocol. (2) To show the impact of missing data on the results, robustness analyses with different missing data approaches should be presented.
Simulation studies have in general numerous limitations. In the current study, generation of missing data covered only some of the many reasons for missing data assumed to apply to OA RCTs. Different reasons might result in other effects than described here. Secondly, we have not considered other more case-specific methods for the handling of missing data. Each trial has specific bias for missing data, and there might be tailored methods avail-able. Furthermore, the underlying trial that we used might not be suitable for other situations.
Missing data may lead to invalid conclusions if not treated appropriately. In this study we have shown that the preferred method is the MI technique with a treatment term. The most conservative method is MI without a treatment term, and this latter method would be particularly relevant to assess the robustness of results when there are large differences in withdrawal rates
Table III
Type I error and power after simulation with different management strategies for missing data for WOMAC pain variable Missing data procedure Data analysis Management of missing data
Null hypothesis Alternative hypothesis Probability of Type I error (%) Power (%) Treatment effect: relative bias* Treatment effect: absolute biasy MSE
None ANCOVA Complete data setz 5.2 96.0 0.3 0 6.5
MMRM Complete data setz 4.8 98.4 0.4 0 5.3
Scenario A ANCOVA Case-complete 4.9 82.6 8.5 0.8 10.0
LOCF 4.9 86.7 16.0 1.6 9.3 BOCF 6.8 80.7 26.2 2.5 12.9 MI daMCMC 1.2 68.4 29.4 2.9 13.7 MI regression 4.7 84.3 6.2 0.6 8.9 MMRM Case-complete 5.2 92.5 5.3 0.5 7.4 LOCF 5.5 93.6 15.9 1.5 8.0 BOCF 5.9 90.5 26.2 2.5 11.4 MI daMCMC 0.6 77.3 29.4 2.9 12.4 MI regression 4.9 90.3 6.1 0.6 7.7
Scenario B ANCOVA Case-complete 7.1 89.2 0.1 0 9.1
LOCF 5.8 84.9 18.9 1.8 10.2 BOCF 5.1 78.5 28.7 2.8 14.9 MI daMCMC 1.5 77.7 23.0 2.2 10.4 MI regression 5.8 90.1 1.4 0.1 8.5 MMRM Case-complete 6.2 95.4 1.5 0.1 7.1 LOCF 4.8 92.7 18.8 1.8 8.9 BOCF 4.1 84.6 28.6 2.8 13.4 MI daMCMC 1.3 86.2 23.0 2.2 9.2 MI regression 5.5 94.0 1.5 0.1 7.2
ANCOVA¼Analysis of Covariance with baseline value as covariate.
Scenario A: Missing data as function of lack-of-efficacy with 28.7% drop-out in the experimental group and 33.6% drop-out in the control group. Scenario B: Missing data as function of lack-of-efficacy with 30.5% drop-out in both the experimental and the control treatment group.
*Expressed as percent.
y Expressed in terms of normalised WOMAC subscale score for pain units. z Original data sets with no missing data.
between the treatment arms. The LOCF, BOCF and the complete-case methods were not particularly conservative and gave rela-tively low power and high bias. The results from this study can support investigators in their choice of methods to handle missing data in OA clinical trials.
Author contributions
IC Olsen was involved in the conception and design of the study, simulation of the data, analysis and interpretation of the data, drafting of the article andfinal approval of the article.
T Uhlig was involved in the interpretation of the data, critical revision of the article for important intellectual content, andfinal approval of the article.
TK Kvien was involved in the interpretation of the data, critical revision of the article for important intellectual content, andfinal approval of the article.
Conflict of interest
None declared.
Acknowledgements
ICO would like to thank his former employer Smerud Medical Research AS for providing time to do research and the statistical software.
References
1. Points to consider on clinical investigation of medicinal products used in the treatment of osteoarthritis (CPMP/EWP/ 748/97). 1998.
2. Baron G, Boutron I, Giraudeau B, Ravaud P. Violation of the intent-to-treat principle and rate of missing data in superiority trials assessing structural outcomes in rheumatic diseases. Arthritis Rheum 2005;52(6):1858e65.
3. Points to consider on missing data (CPMP/EWP/1776/99). 2001. 4. Liu M, Wei L, Zhang J. Review of guidelines and literature for handling missing data in longitudinal clinical trials with a case study. Pharm Stat 2006;5(1):7e18.
5. Auleley G-R, Giraudeau B, Baron G, Maillefert J-F, Dougados M, Ravaud P. The methods for handling missing data in clinical trials influence sample size requirements. J Clin Epidemiol 2004 May;57(5):447e53.
6. Symmons DPM. Methodological issues in conducting and analyzing longitudinal observational studies in rheumatoid arthritis. J Rheumatol Suppl 2004 Mar 1;69:30e4.
7. Little RJA, Rubin DB. Statistical Analysis with Missing Data. 2nd edn. Wiley; 2002.
8. Unnebrink K, Windeler J. Intention-to-treat: methods for dealing with missing values in clinical trials of progres-sively deteriorating diseases. Stat Med 2001 Dec 30;20(24): 3931e46.
9. Burton A, Altman DG, Royston P, Holder RL. The design of simulation studies in medical statistics. Stat Med 2006;25(24): 4279e92.
10. Baron G, Ravaud P, Samson A, Giraudeau B. Missing data in randomized controlled trials of rheumatoid arthritis with radiographic outcomes: a simulation study. Arthritis Rheum 2007;59(1):25e31.
11. Pham T, van der Heijde D, Lassere M, Altman RD, Anderson JJ, Bellamy N,et al. Outcome variables for osteoarthritis clinical trials: the OMERACT-OARSI set of responder criteria. J Rheumatol 2003 Jul 1;30(7):1648e54.
12. Bellamy N, Bell M, Goldsmith C, Pericak D, Walker V, Raynauld J,et al. The effectiveness of hylan G-F 20 in patients with knee osteoarthritis: an application of two sets of response criteria developed by the OARSI and one set devel-oped by OMERACT-OARSI. Osteoarthritis Cartilage 2005 Feb;13(2):104e10.
13. Tugwell P, Boers M, Brooks P, Simon L, Strand V, Idzerda L. OMERACT: an international initiative to improve outcome measurement in rheumatology. Trials 2007;8(1):38. 14. Pham T, van der Heijde D, Altman RD, Anderson JJ, Bellamy N,
Hochberg M,et al. OMERACT-OARSI initiative: Osteoarthritis Research Society International set of responder criteria for osteoarthritis clinical trials revisited. Osteoarthritis Cartilage 2004 May;12(5):389e99.
15. Clegg DO, Reda DJ, Harris CL, Klein MA, O’Dell JR, Hooper MM,
et al. Glucosamine, chondroitin sulfate, and the two in combination for painful knee osteoarthritis. N Engl J Med 2006 Feb 23;354(8):795e808.
16. Ehrich EW, Davies GM, Watson D, Bolognese JA, Seidenberg BC, Bellamy N. Minimal perceptible clinical improvement with the Western Ontario and McMaster Universities osteoarthritis index questionnaire and global assessments in patients with osteoarthritis. J Rheumatol 2000 Nov 1;27(11):2635e41.
17. Agresti A. Categorical Data Analysis. 2nd edn. In: Wiley Series in Probability and Statistics. Wiley-Interscience; 2002. 18. Donders ART, van der Heijden GJMG, Stijnen T, Moons KGM.
Review: a gentle introduction to imputation of missing values. J Clin Epidemiol 2006 Oct;59(10):1087e91.
19. Schafer JL. Analysis of Incomplete Multivariate Data. New York: Chapman & Hall/CRC; 1997.
20. Kenward MG, Carpenter J. Multiple imputation: current perspectives. Stat Methods Med Res 2007 Jun 1;16(3): 199e218.