Exploiting Flickr Meta-Data for
Predicting Environmental Features
A thesis submitted in partial fulfilment
of the requirement for the degree of Doctor of Philosophy
Shelan S. Jeawak
2019
Cardiff University
iii
STATEMENT 1
This thesis is being submitted in partial fulfilment of the requirements for the degree of PhD.
Signed . . . . Date . . . .
STATEMENT 2
This work has not been submitted in substance for any other degree or award at this or any other university or place of learning, nor is it being submitted concurrently for any other degree or award (outside of any formal collaboration agreement between the University and a partner organisation).
Signed . . . . Date . . . .
STATEMENT 3
I hereby give consent for my thesis, if accepted, to be available in the University’s Open Access repository (or, where approved, to be available in the University library and for inter-library loan), and for the title and summary to be made available to outside or-ganisations, subject to the expiry of a University-approved bar on access if applicable. Signed . . . .
iv
DECLARATION
This thesis is the result of my own independent work, except where otherwise stated, and the views expressed are my own. Other sources are acknowledged by explicit ref-erences. The thesis has not been edited by a third party beyond what is permitted by Cardiff University’s Use of Third Party Editors by Research Degree Students Proced-ure.
Signed . . . . Date . . . .
WORD COUNT. . . .
(Excluding Abstract, acknowledgements, declarations, contents pages, appendices, tables, diagrams and figures, references, bibliography, footnotes and endnotes)
To the soul of my mother the origin of my success.
vii
Abstract
The photo-sharing website Flickr has become used as an informal information source in disciplines such as geography and ecology. Many recent studies have highlighted the fact that Flickr tags capture valuable ecological information, which can complement more traditional sources. A shortcoming of most of these existing methods is that they rely on manual interpretation of Flickr content, with little automated exploitation of the associated tags. Therefore, they fail to exploit the full potential of the data. Automatically extracting and analysing information from unstructured and noisy data remains a hard task. This research aims to investigate the use of Flickr meta-data for predicting a wide variety of environmental phenomena. In particular, we consider the problem of predicting scenicness, species distribution, land cover, and climate-related features. To this end, we developed several novel machine learning methods that can efficiently utilise Flickr tags as a supplementary source to the structured information that is available from traditional scientific resources.
The first proposed method aims at modelling locations, and hence inferring environ-mental phenomena, using georeferenced Flickr tags. Our focus was on comparing the predictive power of Flickr tags with that of structured environmental data. This method represents each location as a concatenation of two feature vectors: a bag-of-words representation derived from Flickr and a feature vector encoding the numerical and categorical features obtained from the structured dataset. We found that Flickr was generally competitive with the structured environmental data for prediction, being sometimes better and sometimes worse. However, combining Flickr tags with existing
viii Abstract
ecological data sources consistently improved the results, which suggests that Flickr can indeed be regarded as complementary to traditional sources. The second method that we propose is based on a collective prediction model, which crucially relies on Flickr tags to define the neighbourhood structure. The use of a collective prediction formulation is motivated by the fact that most environmental features are strongly spa-tially autocorrelated. While this suggests that geographic distance should play a key role in determining neighbourhoods, we show that considerable gains can be made by additionally taking Flickr tags and traditional data into consideration.
The thesis considers two further novel methods which are based on a low dimensional vector space representation. The first model, called EGEL (Embedding Geographic Locations), learns vector space embeddings of geographic locations by integrating the textual information derived from Flickr with the numerical and categorical informa-tion derived from environmental datasets. We experimentally show that this method improves on bag-of-words representation approaches, especially in cases where struc-tured data are available. This model has been extended by considering a spatiotem-poral representation of regions. In particular, we propose a spatiotemspatiotem-poral embeddings model, called SPATE (Spatiotemporal Embeddings), which learns a vector space em-bedding for each geographic region and each month of the year. This allows the model to capture environmental phenomena that may depend on monthly or seasonal vari-ation. Apart from extending our primary model, SPATE also includes a new smooth-ing method to deal with the sparsity of Flickr tags over the considered spatiotemporal setup.
The experimental results demonstrated in this thesis confirm our hypothesis that there is valuable information contained in Flickr tags which can be used to predict environ-mental features.
ix
Acknowledgements
Undertaking this PhD has been truly one of the most challenging and rewarding exper-iences in my life. Despite the ups and downs, the disappointments and triumphs, the happy and sad moments, my journey has finally got to its end. I am certain that I would not have been able to complete this journey without the help and support of ALLAH and many people.
I am heartily thankful to my main supervisor Professor Steven Schockaert, for his un-countable encouragement, guidance and support from the beginning of my PhD. His professional excellence enabled me to develop my research skills and tackle the chal-lenges of this research. Thanks for his great enthusiasm and patience with me. I would also like to thank my second supervisor Professor Christopher Jones, for his know-ledgeable advice, help and guidance. I am much blessed at being under the supervision of such great people; they have ideally assisted me in all of my research needs.
I would also like to thank all the members of the School of Computer Science and Informatics at Cardiff University for their kind assistance. I must acknowledge the technical support of the ARCCA team, especially Mr Thomas Green. Thanks to all my friends and colleagues in Cardiff who have been positive and supportive during the PhD journey.
I want to extend my thanks to my sponsor in Iraq, HCED Iraq, for the financial support of my PhD study in Cardiff. I am also thankful to my friends and colleagues in the Department of Computer Science at Al - Nahrain University for their encouragement
x Acknowledgements
and friendship.
I am deeply grateful to my family, who always encourage and support me. To my parents, who provided endless support, encouragements and love, to make me who I am today. Words cannot express how I am grateful to them. I wish my mother was still alive and share this achievement with me. To my sisters Suzan and Rajuan, and my brothers Dr Mohammed and Muayed; you have always been my biggest cheerleaders. To my nieces Noor and Maryam and my nephews Ahmed and Ibrahim for their love. My last thankful words are kept to my husband Ahmed and my lovely son Mohammed for their unconditional love, support, and care. It is thanks to them I was able to come to the finish line of my PhD.
xi
Contents
Abstract vii
Acknowledgements ix
Contents xi
List of Publications xvii
List of Figures xix
List of Tables xxiii
List of Acronyms xxv
1 Introduction 1
1.1 Background and Motivation . . . 1
1.2 Hypothesis and Research Questions . . . 3
1.3 Contributions . . . 4
1.4 Thesis Structure . . . 6
xii Contents
2 Background and Related Work 9
2.1 Introduction . . . 9
2.2 Social Media . . . 10
2.2.1 Social Media Mining . . . 12
2.3 Text Representation . . . 17
2.3.1 Term Weighting . . . 18
2.3.2 Term Selection . . . 20
2.4 Low Dimensional Vector Space Representation . . . 23
2.4.1 Vector Space Embeddings . . . 23
2.4.2 Embedding Spatial or Spatiotemporal Information . . . 25
2.5 Machine Learning . . . 27
2.5.1 Supervised Machine Learning . . . 28
2.5.2 Collective Prediction . . . 31
2.5.3 Evaluation Measures . . . 33
2.6 Summary . . . 36
3 Data Acquisition and Preprocessing 37 3.1 Introduction . . . 37
3.2 Flickr Data . . . 38
3.2.1 Flickr Data Collection . . . 38
3.2.2 Flickr Data Preprocessing . . . 40
Contents xiii
3.3 Structured Scientific Data . . . 46
3.4 Ground Truth Data . . . 48
3.4.1 The ScenicOrNot project . . . 48
3.4.2 Natura2000 project . . . 48
3.4.3 NBN Atlas . . . 49
3.5 Summary . . . 49
4 Modelling Locations using Bag-Of-Words Representation 51 4.1 Introduction . . . 51
4.2 Methodology . . . 52
4.2.1 Modelling Locations Using Flickr Tags . . . 52
4.2.2 Modelling Locations Using Structured Data . . . 54
4.3 Experiments . . . 55
4.3.1 Predicting Scenicness . . . 55
4.3.2 Predicting Species Distribution . . . 57
4.3.3 Predicting CORINE Land Cover Classes . . . 59
4.3.4 Predicting Climate Data . . . 60
4.4 Evaluating the Role of Species Name Tags . . . 62
4.4.1 Methodology and Data . . . 64
4.4.2 Evaluation . . . 65
4.4.3 Results and Discussion . . . 66
xiv Contents
5 Collective Prediction Model 73
5.1 Introduction . . . 73
5.2 Collective Prediction . . . 74
5.3 Experimental Evaluation . . . 81
5.3.1 Experimental Settings . . . 81
5.3.2 Variants and Baseline Methods . . . 81
5.3.3 Experimental Results . . . 84
5.4 Summary . . . 93
6 Modelling Locations using Vector Space Embedding 95 6.1 Introduction . . . 95
6.2 Embedding Geographic Location . . . 96
6.2.1 Tag Based Location Embedding . . . 97
6.2.2 Structured Environmental Data . . . 99
6.3 Experimental Evaluation . . . 101
6.3.1 Experimental Settings . . . 101
6.3.2 Variants and Baseline Methods . . . 102
6.3.3 Experimental Results . . . 103
6.4 Summary . . . 108
7 Spatiotemporal Embeddings Model 111 7.1 Introduction . . . 111
Contents xv
7.3 Methodology . . . 113
7.3.1 Spatiotemporal Modelling Using Flickr tags . . . 113
7.3.2 Spatiotemporal Modelling Using Structured Environmental Data119 7.3.3 Spatiotemporal Embeddings . . . 121
7.4 Experimental Evaluation . . . 123
7.4.1 Selecting the Optimal Bandwidth for Each Tag . . . 124
7.4.2 Experimental Settings . . . 126
7.4.3 Variants and Baseline Methods . . . 127
7.4.4 Experimental Results . . . 128
7.4.5 Location Similarity . . . 134
7.5 Summary . . . 141
8 Conclusions and Future Work 143 8.1 Introduction . . . 143
8.2 Thesis Summary and Contributions . . . 143
8.3 Research Questions . . . 146
8.4 Future Work . . . 148
8.5 Summary . . . 149
xvii
List of Publications
The work introduced in this thesis is based on the following publications:
1. Shelan S Jeawak, Christopher B Jones, and Steven Schockaert. Using Flickr for characterizing the environment: an exploratory analysis. In 13th International Con-ference on Spatial Information Theory, COSIT 2017, September 4-8, 2017, L’Aquila, Italy, volume 86, pages 21:1–21:13 [54].
2. Shelan S Jeawak, Christopher B Jones, and Steven Schockaert. Mapping wild-life species distribution with social media: Augmenting text classification with species names. In 10th International Conference on Geographic Information Science, GIS-cience 2018, August 28-31, 2018, Melbourne, Australia, volume 114, pages 34:1–34:6, [52].
3. Shelan S Jeawak, Christopher B Jones, and Steven Schockaert. Embedding Geographic Locations for Modelling the Natural Environment Using Flickr Tags and Structured Data. In 41st European Conference on IR Research, ECIR 2019, Cologne, Germany, April 14-18, 2019, Proceedings Part I, volume 11437, pages 51–66, [55].
4. Shelan S Jeawak, Christopher B Jones, and Steven Schockaert. Collective Predic-tion of Environmental Features using Flickr Tags, under review.
5. Shelan S Jeawak, Christopher B Jones, and Steven Schockaert. Predicting environ-mental features by learning spatiotemporal embeddings from social media, Accepted for publication in Ecological Informatics, Elsevier.
xix
List of Figures
2.1 The geometric intuition of linear SVMs. . . 30
2.2 Artificial Neural Networks architecture. . . 31
3.1 Flickr photographs . . . 39
3.2 The number of georeferenced photographs in each month among the collected Flickr data . . . 42
3.3 Scientific species names frequency among Flickr data. . . 43
3.4 Number of photographs in each of the CORINE land cover class. . . . 45
3.5 CORINE Land Cover dataset. . . 46
4.1 Modelling locations using a Bag-Of-Words model. . . 52
4.2 Prediction of the black woodpecker distribution across Europe. . . 58
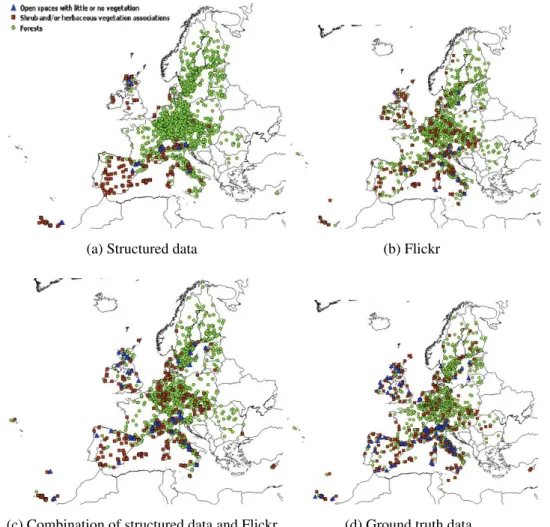
4.3 Prediction of subclasses of the CORINE class “Forest & semi natural areas” . . . 61
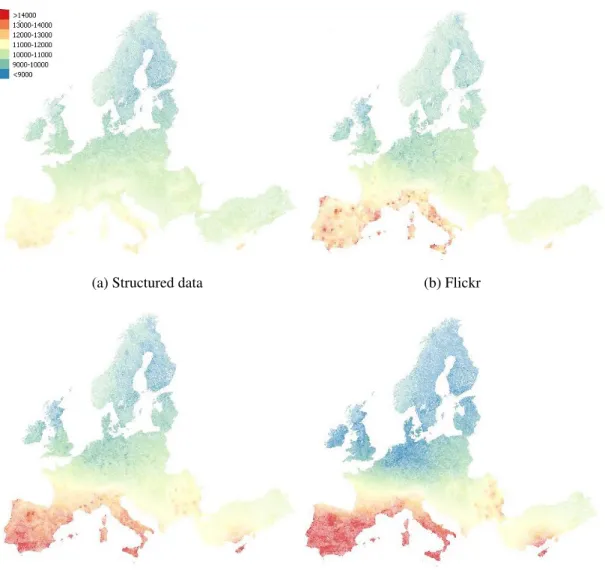
4.4 Prediction of solar radiation. . . 63
4.5 The training process. . . 65
xx List of Figures
4.7 Prediction of the Dunlin distribution across the testing area with 10km
grid cells . . . 69
4.8 Prediction of the Atlantic Puffin distribution across the testing area with 10km grid cells . . . 69
5.1 Modeling locations based on Flickr tags, structured features, and neigh-borhood structure. . . 75
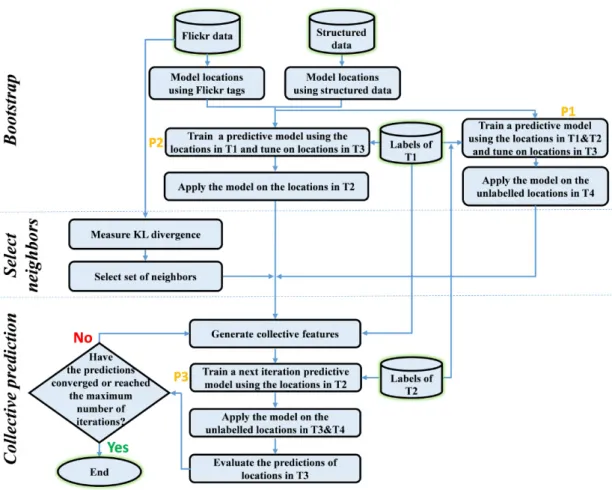
5.2 The collective prediction model. . . 76
5.3 Structured+Flickr prediction model (baseline method). . . 83
5.4 K nearest neighbors prediction model (baseline method). . . 83
5.5 Modeling locations based on collective features. . . 83
5.6 Results of predicting species distribution. . . 85
5.7 Results of predicting CORINE land cover at level 1. . . 87
5.8 Results of predicting CORINE land cover at level 2. . . 88
5.9 Results of predicting CORINE land cover at level 3. . . 89
5.10 Results of predicting scenicness. . . 90
5.11 Results of predicting average annual temperature. . . 90
5.12 Results of predicting average annual precipitation. . . 91
5.13 Results of predicting average annual solar radiation. . . 91
5.14 Results of predicting average annual wind speed. . . 92
5.15 Results of predicting average annual water vapour pressure. . . 92
6.1 Modelling locations in vector space embedding . . . 97
List of Figures xxi
6.3 The geometric intuition of numerical features based embedding. . . . 100
6.4 The geometric intuition of categorical features based embedding. . . . 101
6.5 Comparison between the performance of the GloVe and bag-of-words models for predicting scenicness, as a function of the number of tag occurrences at the considered locations . . . 105
7.1 Spatiotemporal grid cells. . . 114
7.2 The representation of the months as circular data. . . 117
7.3 The spatiotemporal embeddings (SPATE) model. . . 124
7.4 The average MISE of all the considered tags when using the rule of thumb (ROT), the adaptive kernel bandwidth (Adaptive), and the leave-one-out kernel estimator (LOO) . . . 125
7.5 Prediction of the seasonal distribution of Swift across the UK and Ire-land using 1% of the data for training/tuning . . . 131
7.6 F1 score of predicting the monthly distribution of Swift. . . 132
7.7 The prediction confidence score for location coordinate (54.81503616, -2.086120293) over the testing months. Jan, Oct, Nov and Dec are not shown in the figure because the corresponding cells are in the training set for that location. Note that Swift has positive ground truth observa-tions in that location in April, May, June, July and August, and negative ground truth observations in February, March and September . . . 132
7.8 Prediction of the seasonal precipitation across the UK and Ireland us-ing 1% of the data for trainus-ing/tunus-ing. . . 136
xxii List of Figures
7.10 The monthly average value of predicting the amount of precipitation for location coordinate (latitude= 55.26469626 and longitude= -4.784080876) over the testing months. April, July, October, November, and Decem-ber are not shown in the figure because the corresponding cells are in the training set for that location . . . 138 7.11 Location’s similarity maps in July. . . 139 7.12 Location’s similarity maps in January . . . 140
xxiii
List of Tables
2.1 Confusion matrix for binary classification. . . 34
3.1 Top 10 tags with the highest KL divergence, in relation to the months of the year and the occurrence of species names . . . 44 3.2 Top 10 tags related to forest in different term selection methods. . . . 45
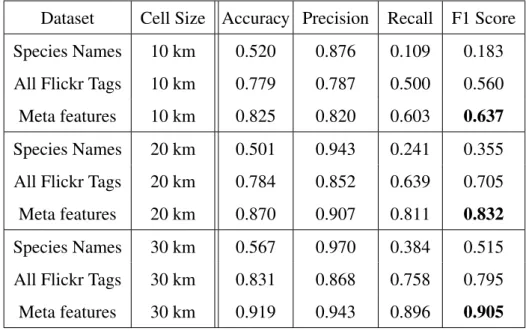
4.1 Results for predicting scenicness. . . 56 4.2 Results for predicting species distribution. . . 58 4.3 Results for predicting CORINE land cover classes, at levels 1, 2 and 3. 60 4.4 Top 5 Flickr tags for CORINE level 1 classes in the SVM models. . . 60 4.5 Results for predicting average climate data. . . 62 4.6 Mean and Standard deviation of climate data. . . 62 4.7 Results for predicting the distribution of 50 species across the testing
area . . . 67 4.8 F1 scores for predicting the distribution of individual species using
xxiv List of Tables
5.1 High and low boundaries for discretising the features from the regres-sion problems . . . 84 5.2 Top 5 Flickr tags of Aquila chrysaetos, Dryocopus martius, and Lacerta
bilineata species in terms of KL divergence . . . 86 5.3 Top 5 Flickr tags for some CORINE level 1 classes in terms of KL
divergence . . . 86 5.4 Top 5 Flickr tags for different climate related features in terms of KL
divergence . . . 93
6.1 Results for predicting species distribution. . . 104 6.2 Results for predicting soil type. . . 105 6.3 Results for predicting CORINE land cover classes, at levels 1, 2 and 3. 106 6.4 Results for predicting average climate data. . . 107 6.5 Results for predicting scenicness. . . 108
7.1 Top 10 Flickr tags in terms of KL divergence. . . 127 7.2 Results for predicting the monthly distribution of 50 species across the
UK and Ireland . . . 130 7.3 Results for predicting the monthly average climate features. . . 135 7.4 Mean and Standard deviation of the monthly average climate data. . . 137
xxv
List of Acronyms
GPS Global Positioning System
API Application Programming Interface
VGI Volunteered Geographic Information
UGC User Generated Content
BOW Bag-Of-Words
CBOW Continuous Bag-of-Words
GloVe Global Vectors for Word Representation
NLP Natural Language Processing
POI Points-of-Interest ML Machine Learning TP True Positive TN True Negative FP False Positive FN False Negative
xxvi List of Acronyms
SVR Support Vector Regression
EGEL Embedding Geographic Locations
1
Chapter 1
Introduction
1.1
Background and Motivation
Social media platforms such as Flickr1, Twitter2 and Facebook3 have become popular vehicles for sharing and finding information. This led to the creation of a large amount of a new form of data, which is known as social media data. These data are mostly user-generated, informal, and unstructured, and is sometimes associated with inform-ation about time and locinform-ation. For example, the photo-sharing platform Flickr hosts more than 10 billion photographs4, most of which are associated with short textual
de-scriptions in the form of tags to describe what is depicted in the photograph. Moreover, the time at which these photographs were taken is available as a meta-data. The Global Positioning System (GPS) support in current electronic devices such as smartphones means that latitude and longitude coordinates can be easily recorded as meta-data. For a large number of photographs on Flickr, these coordinates have been made pub-licly available5. Together with their textual descriptions, such photographs can thus
be regarded as Volunteered Geographic Information (VGI [41]). VGI is a special case of the larger phenomenon known as User Generated Content (UGC) [41]. It allows people to voluntarily create, collect, and disseminate geographic information, which
1http://www.flickr.com 2
http://www.twitter.com
3http://www.facebook.com
4http://expandedramblings.com/index.php/flickr-stats
2 1.1 Background and Motivation
has played an active role for some applications such as urban planning and mapping [111]. The coordinates and textual meta-data associated with Flickr photographs have already proven valuable in many disciplines. For example, in geography, Flickr tags have been used to construct approximate boundaries for (vernacular) regions [19, 42] or to discover events that take place in a given city [91]. In linguistics, the tags of georeferenced Flickr photographs have been found useful for generating vector space representations of perceptual terms [7] and the correlations between the occurrence of Flickr tags and geographical location have been used to analyse colloquial language [29]. In the domain of ecology, Flickr has been used to study species distribution [5]. The use of Flickr for modelling urban environments has already received considerable attention. For instance, various approaches have been proposed for modelling urban regions [19], and for identifying points-of-interest [117] and itineraries [21, 90]. How-ever, the usefulness of Flickr for characterising the natural environment, which is the focus of this thesis, is less well-understood.
Although there are many organisations that serve environmental data, the information they provide is far from complete [5]. The idea of using Flickr as a supplementary source of environmental information is appealing for several reasons. For example, due to the fact that photographs are often uploaded directly after they have been taken, Flickr can provide us with more up-to-date information than traditional citizen science datasets. This can be important, for instance, for monitoring the spread of invasive spe-cies and migration patterns of pollinators. Moreover, the information that is captured by Flickr tags is broader than what is normally recorded, and includes, for example, the subjective assessments about the scenicness of a landscape. In fact, Flickr has already proven valuable as a resource for ecological analysis. However, most of the recent studies rely on manual evaluations of image content with little automated exploita-tions of the associated tags [92, 30]. Manually analysing Flickr is clearly limited and time-consuming. Moreover, both the structure and the volume of the data present prac-tical challenges [20], compared to formal or semi-formal citizen science monitoring data [107]. Nonetheless, these studies prove that Flickr contains valuable information
1.2 Hypothesis and Research Questions 3
which could be used to support the available sources [20, 5]. All this highlights the need for automated methods for extracting environmental information from Flickr. The aim of the research presented in this thesis is to automate methods that can utilise Flickr meta-data as a supplementary source of environmental information. The idea has come from the fact that Flickr data are free to use, more up-to-date than traditional resources, and has already proven valuable as a resource for ecological information [5, 20]. In particular, this thesis studies the usefulness of Flickr tags for predicting a wide range of environmental phenomena, such as land cover categories, species occurrence, scenicness of place, and climate features which include average temperature, wind speed, precipitation, solar radiation and water vapour pressure. The most important challenge to handle in social media mining is that its content is often sparse and noisy. To mitigate this problem, our analysis in this research focuses on features that we can ascribe to locations, for example, “there is a coniferous forest at this location” rather than to individual photographs, for example, “this is a photo of a 7-spot ladybird”. Flickr tags can be an extremely rich source of information. However, extracting useful knowledge from it can be difficult due to its unstructured nature. To this end, we need methods that efficiently extract and represent such potentially useful information hidden in Flickr. Moreover, to employ Flickr tags as a supplementary source to the structured scientific datasets, we need to develop methods that can efficiently combine those two diverse data sources. To achieve this, several novel text mining and machine learning algorithms have been proposed and developed in the present thesis.
1.2
Hypothesis and Research Questions
Our main hypothesis in this thesis is:Social media can be used as a valuable source of ecological information. In particular, we can use the meta-data associated with the photographs on the photo-sharing plat-form Flickr as a complementary source to the publicly available scientific datasets in
4 1.3 Contributions
order to predict spatially and temporally grounded information about the natural en-vironment. This meta-data allows us to improve the prediction of features such as the scenicness of a place, species distribution, land cover categories, and several climate related features.
In order to verify this hypothesis, the following set of research questions were ad-dressed:
Research Question 1: Is it possible to extract large amounts of high-quality environ-mental information from Flickr, and if so, how complementary is this information to publicly available scientific datasets?
Research Question 2: How can we deal with the sparsity of Flickr tags for location (and possibly time-dependent) representation?
Research Question 3: How can we best integrate these representations with the avail-able structured environmental data to improve the predictive power?
1.3
Contributions
The primary contribution of the present PhD research is the development of methods for utilising Flickr meta-data as a complementary source of environmental information. The contributions made through this research are:
1. We introduce a new method for modelling locations using georeferenced Flickr tags. The method is based on a spatially smoothed version of pointwise mutual information. The main aim of this work is to obtain a clearer picture about the kinds of environmental features that can be modelled using Flickr tags. To this end, we consider the problem of predicting scenicness, species distribution, land cover, and climate features. We focus on comparing the predictive power of Flickr tags with that of structured data from more traditional sources. We find that Flickr tags perform sometimes better and sometimes worse than the
1.3 Contributions 5
considered structured data. Nonetheless, combining Flickr tags with structured data consistently improves the results. This suggests that Flickr can be used as a complementary source to traditional sources. This work was published in [54]. 2. We compare and combine two main strategies for using Flickr to predict the
spatial distribution of species. The first strategy is based on identifying postings that explicitly mention the target species name, while the second is based on exploiting all tags to construct a model of the locations where the species occurs. We find that the second strategy works well overall. However, in a few cases, the strategy that uses the species names only leads to better performance. We furthermore show that even better performance is achieved with a meta-classifier that combines data on the presence or absence of species name tags with the predictions from using all Flickr tags. This work was published in [52].
3. We propose a novel collective prediction framework that relies on both Flickr tags and structured data to make initial predictions that are updated iteratively using a combination of neighbouring predictions and ground truth data. The motivation behind the use of collective prediction is, as in conventional spatial interpolation, that most environmental features are spatially autocorrelated. A key feature of the approach is that, in the collective prediction model, estimation of a location from its neighbouring data depends not only on geographic distance but also on attribute similarity, which is estimated in our case from the Flickr tags and structured data associated with each location. This work is still under review. 4. We develop a novel method for learning low-dimensional vector space embed-dings of geographic locations, called EGEL, by combining textual information in the form of Flickr tags with the numerical and categorical information con-tained in structured scientific datasets. Our experimental evaluations show that using such low-dimensional vector space representations allows us to integrate the textual, numerical and categorical features in a more effective way than is possible with bag-of-words representations. This work was published in [55].
6 1.4 Thesis Structure
5. We extend the EGEL model to encode spatiotemporal information. To this end, we propose a novel spatiotemporal embeddings model, named SPATE, which is able to integrate Flickr tags and structured scientific information from more traditional environmental data sources. The novelty of this work is two-fold. First, we propose a new method based on spatiotemporal kernel density estima-tion to handle the sparsity of the tag distribuestima-tion over space and time. Then, we efficiently integrate the spatially and temporally smoothed Flickr tags with the structured scientific data into low-dimensional vector space representations. The proposed model can be used for modelling and predicting a wide variety of eco-logical features such as species distribution, as well as related phenomena such as climate features. We experimentally show that our model is able to substan-tially outperform baselines that rely only on Flickr or only on traditional sources. This work is accepted for publication in [53].
1.4
Thesis Structure
The remaining chapters are organised as follows:
• Chapter 2 - Background and Related Work - provides an overview of social me-dia in general and social meme-dia mining in particular. The chapter reviews the re-lated work in this area and also defines the fundamental concepts of the relevant methods for text representation, vector space embedding, and machine learning. • Chapter 3 - Data Acquisition and Preprocessing - introduces the datasets used in this work, covering both Flickr data and structured scientific data, and describes the methodology that was used for collecting each of those datasets. A primary analysis of the collected Flickr data is conducted to evaluate its usefulness toward the considered task. It also presents a set of ground truth datasets related to the environment and biodiversity that was used for experimentally evaluating the methods developed in this thesis.
1.4 Thesis Structure 7
• Chapter 4 - Modelling Locations using Bag-Of-Words Representation - describes the proposed methodology for modelling geographic locations using the struc-tured data and using Flickr tags based on a bag-of-words (BOW) representa-tion model. The chapter introduces a set of experiments based on supervised machine learning to evaluate, investigate, and compare the prediction power of using Flickr tags only, structured data only, and their combination. It also fo-cuses on evaluating the role of tags that correspond to the name of the species for estimating species occurrence.
• Chapter 5 - Collective Prediction Model - presents the proposed collective pre-diction framework. It investigates the usefulness of Flickr tags to make the ini-tial prediction and defines the neighbourhood structure of a given environmental feature. Detailed experiments are carried out to test the quality of the proposed model.
• Chapter 6 - Modelling Locations using Vector Space Embedding - describes the proposed Embedding GEographic Locations (EGEL) model that integrates the georeferenced Flickr tags and structured scientific data into a low-dimensional vector space embedding. It experimentally shows that EGEL model can integrate Flickr tags with structured information in a more effective way than the BOW model from Chapter 4.
• Chapter 7 - Spatiotemporal Embeddings Model - introduces the proposed SPAti-oTemporal Embeddings(SPATE) model that handles the problem of Flickr data sparsity and is aimed at learning a low-dimensional vector space embedding of spatiotemporal regions based on the textual, numerical, categorical, spatial, and temporal information. The chapter qualitatively and quantitatively evaluates how well the SPATE model can predict the monthly and seasonal variation of a num-ber of environmental phenomena.
• Chapter 8 - Conclusion and Future Work- concludes the thesis by summarising our contributions, findings, as well as highlighting proposals for future work.
8 1.5 Summary
1.5
Summary
In this chapter, we introduced the background and our motivation to work on the con-sidered topic. We also discussed the hypothesis and the main research questions, and we gave an overview of the thesis contributions and structure. Before moving to the main technical contributions of this thesis, the next chapter will first provide more detailed background information and put the thesis in the context of existing work.
9
Chapter 2
Background and Related Work
2.1
Introduction
This thesis aims to explore the benefits of using social media, specifically the meta-data associated with the photo-sharing platform Flickr, as a supplementary source of ecological information. Mining social media platforms has become a very active re-search area in many domains, as it coincides with the rapid growth and the availability of textual user-generated content on the web. This chapter will present the required background knowledge about the field of social media mining, which encompasses text mining and machine learning.
In particular, this chapter serves four main purposes that are directly related to the research presented in the thesis. First, Section 2.2 presents a general overview of social media and the process of mining social media platforms. To address the question of whether social media can be considered as a valuable source of information, two closely related research areas are discussed, which are: geospatial analysis of social media and citizen science. Then Section 2.3 attempts to define the common techniques that are used to generate bag-of-words representations of text documents. Specifically, we discuss methods that are used for term weighting and term selection. Subsequently, Section 2.4 describes the state-of-the-art methods used for learning low-dimensional vector space representations, including word embeddings and spatial or spatiotemporal information embeddings. Section 2.5 presents and compares some of the widely used
10 2.2 Social Media
machine learning approaches for the task of supervised learning. It also presents a more detailed review of the collective prediction model as well as the standard evaluation methods. Finally, Section 2.6 summarises the main topics discussed in this chapter. Note that there is an additional short related work section in Chapter 7, specifically Section 7.2, on spatiotemporal modelling.
2.2
Social Media
The rapid emergence and dissemination of Web 2.0 functionalities during the first dec-ade of the 21st century has led to a leap in the social component of Web use. In con-trast with the first generation of Web 1.0 where people were mostly limited to view the content of websites only, Web 2.0 applications allow users to communicate and share information through social media platforms. Social media can be defined as a class of web-based applications and information sources. They are typically characterised by collaborative content creation driven by explicit or implicit social networks that repres-ent virtual communities of shared interest. The concept of social media has a broader meaning than the interaction platforms where a large amount of user-generated data are now available. Kaplan and Haenlein [59] define social media as“a group of Internet-based applications that build on the ideological and technological foundations of Web 2.0, and that allow the creation and exchange of user-generated content”. These data are of great importance in many domains when mined and used for such purposes as analysis, modelling and prediction.
There are many types of social media that vary with regard to the level of personalisa-tion and the richness of the media [59]. For example, the microblogging network is highly personalised as the authors provide content and information about themselves, whereas collaborative projects such as Wikipedia have a low degree of personalisation. It is difficult to propose a precise classification for social media types; however, the most popular classes include:
2.2 Social Media 11
• Social Network Sites (SNSs) are a typical type of social media. The purpose of SNSs is to provide users with a platform to connect with others, such that they can share thoughts, knowledge, photographs and videos, and participate in discussions. Generally, a social networking service builds on and reflects the real-life social networks among people through online platforms. Facebook and Linkedin are well-known examples of SNSs worldwide. Some of these platforms provide the ability to share the user’s location information. It is also possible to attach the location and the timestamp with the posts.
• Location-Based Social Networks (LBSNs) are social networks that use GPS coordinates such that users can share their location information. LBSNs are bridging the gap between the physical world and online social networking ser-vices. Examples of LBSN sites are Foursquare and Whrrl. LBSNs do not only add a location to an existing social network. They are also determined by the new social structure made up of individuals connected by their geographical loc-ations as well as their location tagged content, such as text, photographs, and video. Furthermore, the physical location consists of the instantaneous position of a user at a given timestamp and the location history of the user over a specific time period [133].
• Blogging Networks, also called weblogs, blogs or online diaries, are inform-ational or discussion platforms that are often informal and loosely connected, with a high level of personalisation diary-style posts. Examples are Wordpress and Blogspot.
• Microblogging Networks are blogging platforms where the amount of inform-ation that can be shared per user is very short. The most common examples of microblogs are Twitter and Tumblr. For instance, Twitter limits users’ posts, which are called “tweets”, to 280 characters. These tweets can come in the form of a variety of content formats, including text, images, video, audio, and hyper-links as well as the location tag.
12 2.2 Social Media
• Wikis are platforms that allow users to collaborate in creating and editing the content of a website which can include text, photographs and external links. The best-known example is Wikipedia, which is a free multilingual online encyclo-paedia written by users.
• Photo-Sharing Sites are platforms that give people a place to share, store and find media online, with an emphasis on photographs. While the posts on the majority of social media platforms of the aforementioned types start with a text that may be supplemented with photographs or videos, posts on photo-sharing sites start with a photograph (or video) as the main posts. This post can then be supplemented with textual data in the form of a title, description and a set of tags that express what is in the photographs. Highly popular photo-sharing sites are Flickr, Instagram, and Snapchat.
The photo-sharing platform Flickr has been chosen as the site to be exploited in the present research. Both professional photographers and amateurs widely use Flickr as a platform for sharing their photographs. There are more than 90 million monthly active users on Flickr1, and more than 10 billion photographs have been uploaded so far on Flickr2, many of which are publicly available. The nature of the data that is available
from Flickr will be described in more detail in Chapter 3.
2.2.1
Social Media Mining
The process of extracting useful information from large-scale user-generated data on social media sites is usually known as social media mining. This term is an analogy to the process of mining to extract rare minerals. Resources mining requires profes-sional specialists and advanced technologies to sift through a vast amount of raw ore. Similarly, social media mining requires data analysts and automated software to sift
1https://blog.statusbrew.com/social-media-statistics-2019/ 2http://expandedramblings.com/index.php/flickr-stats
2.2 Social Media 13
through massive amounts of raw social media data. It usually uses a range of data min-ing and machine learnmin-ing techniques for analysmin-ing, representmin-ing, and extractmin-ing trends and patterns.
The availability of GPS systems in current electronic devices such as smartphones enables GPS coordinates (latitude and longitude) to be recorded as meta-data for social media posts. Thus, this data can be regarded as Volunteered Geographic Information (VGI) [41]. Since time is also recorded meta-data, social media can also be utilised as a real-time data source. The problem of mining social media data has received significant research attention in recent years and has led to valuable contributions in critical fields such as monitoring public health [17, 61], detecting natural disasters such as earthquakes [116, 28, 34] and typhoons [96], or predicting criminal activities [122].
With reference to these successful applications, ecological observations shared via so-cial media could contribute to public participation in scientific research, something that is often named “citizen science”. In this sense, this thesis deals with social media data, specifically Flickr meta-data, as a passive form of citizen science. To this end, we need a conceptual framework within which this data can be explored, assessed, and used as an additional source of data. Below we will discuss some previous works that use social media data in general, and Flickr data in particular for applications, including geospatial analysis and citizen science, which are closely related to this research.
Geospatial Analysis
Geospatial analysis is the process of gathering, displaying, and manipulating GPS data, satellite imagery or historical data in a way that can be applied to geographic models. Many recent studies have focused on analysing georeferenced social media data, with the aim of extracting useful geographic information. In particular, there is a large num-ber of studies that derive such information from georeferenced Flickr photographs. For example, [42] described two methods for the automatic delineation of imprecise
14 2.2 Social Media
regions based on geotagged photographs. The first one is a method based on kernel density estimation (KDE) and the second is based on one class support vector ma-chines (SVMs). Similarly, [19] presents an approach for automatically defining the geographic boundaries of vague regions by using one class support vector machines (SVMs) and learning multiple kernels. To describe regions, they rely on a combina-tion of the Flickr tags of the photographs that were tagged with the region’s name, and external features such as land cover data, population count, elevation and the geograph-ical coordinates (latitude and longitude) of Flickr photographs that are tagged with the region’s name. They showed that their method performs better than the simpler meth-ods described by [42]. Our work in this thesis is analogous to these approaches, in applying support vector machine learning methods to Flickr tags in combination with other geospatial data, but we are concerned with characterising and predicting inform-ation about the environment.
The authors of [105] presented and evaluated methods for automatically georeferen-cing Flickr photographs using the textual annotations of photographs to predict the single most probable location where the image was taken. They showed that location-specific language models, based on sets of distinctive tags, can be estimated effectively by analysing the terms people use to describe images taken at particular locations. They furthermore demonstrated how to incorporate the GeoNames database and they defined extensions to improve their language models. In [117], a language modelling approach was used to discover and characterise places of interest (POIs). They exper-imented with both Flickr data and Twitter data, finding that Flickr data on its own is more useful than Twitter data for this task, while combining both sources led to the best results. Similar to this latter work, we explore the possibility that sets of tags cannot just distinguish one location from another but can contribute to classifying aspects of the environment.
2.2 Social Media 15
Citizen Science
Citizen science, also known as community science, crowdsourced science, or volun-teer monitoring [27], refers to scientific research conducted by members of the general public, typically as part of a collaborative project with professional scientists. Consid-erable progress has been made in recent years in citizen science projects in the envir-onmental sciences, where participants are recruited to actively contribute to particular campaigns such as in land cover mapping [37], hydrological surveys [75], ornithology and many forms of ecological study [25]. In parallel with these initiatives, there is a growing interest in the potential of “passive” survey methods that exploit social media to provide additional useful data. For instance, [120] analysed the visual features of the photographs on Flickr (in an automated way) to observe natural world features such as snow cover and particular species of flowers. In [131] photographs from Flickr were used to estimate snow cover and vegetation cover and to compare these estimations with fine-grained ground truth collected by Earth-observing satellites and ground sta-tions. Both the text associated with Flickr photographs and their visual features were used in [69] to perform land-use classification. The approach was evaluated on two university campuses and three land-use classes were considered: Academic, Resid-ential, and Sports. In [31] and [32], they classified a sample of georeferenced Flickr photographs according to CORINE land cover classes. They also evaluated the use of Flickr photographs in supporting Land Use/Land Cover (LULC) classification for the city of Coimbra in Portugal and for comparison with Corine Land Cover (CLC) level 1 and level 2 classes (see Chapter 3 for more details on the CORINE dataset). Note that their approach did not use machine learning and the results were evaluated manually by experts. Their results suggest that Flickr photographs cannot be used as a single source to achieve this purpose but they could be helpful if combined with other sources of data.
The authors of [110] explored the relationship between CORINE land cover classes and the valuation of natural scenery, namely scenicness, scenic beauty, landscape beauty,
16 2.2 Social Media
aesthetics, or cultural ecosystem services (CES), through user evaluated georeferenced photographs from the ScenicOrNot3 website. They employed the user’s rating of a
photo in a specific area as an evaluation of the land cover of that area. The results of this study showed that the highest rated areas belong to theforest and semi-natural areas, andwater bodiesclasses. In another work [14], they developed and evaluated a model to predict the average scenicness of 5km × 5km grid cells. They used text describ-ing the rated images in the ScenicOrNot website as input to train a regression model. Measures of scenicness are important since they reflect human well-being and can be taken into consideration in land planning and decision-making processes. Nonetheless, people’s perceptions of landscapes are subjective and cannot easily be quantified [110]. Some authors have assessed the beauty of the landscape through groups of evaluators using images, videos and/or questionnaires [110, 88], while others used geographic in-formation system (GIS) data such as elevation together with visual assessments and/or questionnaires to predict the scenicness [6, 100]. Another group of works, such as [12], [40], and [114], quantify landscape aesthetics according to the number of photographs taken near a given location [12] or the number of people who published photographs [40] in photo-sharing sites such as Flickr and Panoramio. Considering popularity on social media as a surrogate for the level of appreciation of a place might work with some types of landscapes, but the results might be biased towards more accessible places (one of our experiments reported in Section 4.3.1 provides evidence to that ef-fect).
Another growing area of interest is in the use of social media data for ecological mon-itoring. An overview of the potential for exploiting social media in conservation and biodiversity was provided by [24], who conducted a study of the use of social me-dia platforms for posting observations of nature. The most commonly used platforms were, in order of level of sharing of nature-related content: Facebook, Instagram, Twit-ter, Youtube, Flickr and LinkedIn. In [5], they examined Flickr biodiversity data quality by analysing its metadata and comparing it with ground-truth data, using Snowy owls
2.3 Text Representation 17
and Monarch butterflies as a case study. They concluded that Flickr data has the poten-tial to add to the knowledge of these species in terms of geographic, taxonomic, and temporal dimensions, which tends to be complementary to the information contained in other available sources. In another similar work, [20] performed a manual evaluation of a sample of Twitter postings that named three invasive species (using associated im-ages for validation). They identified factors correlated with valid observations, such as the presence of a linked photograph and tags that describe the environment (e.g. ‘leaves’ and ‘tree’). They confirm that social media mining for ecological analysis is as important as traditional monitoring and the features derived from Twitter could be integrated with and hence improve the value of existing sources of such information. An approach to validating individual observations in Flickr was described by [30] who used Google’s reverse image-search service to find photographs similar to those in Flickr postings. The tags of the Google photographs were then compared with those in Flickr in an attempt to filter out non-wildlife images. In [92] the content of the Flickr photographs was analysed manually to assess the quality of cultural ecosystem ser-vices and derive useful information to manage Singapore’s mangroves. The research presented in this thesis is different from these works, where we do not focus on the content of a particular photograph (e.g. which species it may show). Instead, we focus on exploiting and utilising the tags associated with Flickr photographs for predicting a wide range of ecological phenomena such as species distribution, scenicness of a place, soil type, land cover type, and climate features.
2.3
Text Representation
Text representation is one of the most fundamental problems in text mining. It aims to numerically represent unstructured text documents to make them mathematically computable. In the past decades, various strategies for text representation have been proposed for different application problems such as text classification, clustering, and information retrieval. The problem of text representation is to represent each text
doc-18 2.3 Text Representation
ument as a vector, such that the distance between document vectors is representative of their intuitive degree of dissimilarity.
A popular and simple method for representing text is called the bag-of-words (BOW) model, which is commonly used in natural language processing, machine learning, and information retrieval. This model represents a document by encoding the number of times each word appears in it, thus disregarding any information related to word order. Formally, we will treat bag-of-words representations as vectors, where each coordinate captures the weight of a given word. Therefore, next in Sections 2.3.1 and 2.3.2 we will discuss some of the widely used methods for term weighting and term selection in the context of BOW representations.
2.3.1
Term Weighting
Term weighting is the process of assigning numerical values to terms which represent their importance in a document [98]. It is a crucial component of any machine learning system, which has shown great potential for improving the effectiveness of the system [97]. For a given text document d, where we write w(t, d) to encode the weight of termtind. The following statistical methods are the most common examples of term weighting:
• Term Presence (also known as Boolean, One-hot or Binary vector) is a binary weight, taking the value of 1 or 0 based on the term’s presence or absence in the text. If text document d does not contain term t then weightw(t, d) = 0, otherwise the term is assigned value 1.
• Term Count, the weight of a term is the count of its occurrences in the text. If a termtoccurs five times in the text documentdthen weightw(t, d) = 5.
• Term Frequency (TF), similar to the ‘Term Count’ method, but taking into ac-count the length of the document. Because every document is different in length,
2.3 Text Representation 19
it is possible that a term would appear more times in long documents than in shorter ones. Thus, the term frequency is often divided by the document length (i.e. the total number of terms present in the document) as a way of normalisa-tion. The weightw(t, d)is computed as:
TF(t, d) = P c(t, d)
t0∈dc(t0, d)
(2.1) wherec(t, d)is the number of times termtappears in a documentdandc(t0, d)
is the total number of terms ind.
• Term Frequency-Inverse Document Frequency (TF-IDF) is a more sophisticated measure which reflects how important a termtis to documentdgiven how often
t occurs in d and how frequently it appears in the entire document collection. The TF-IDF weight is computed by:
TF-IDF(t, d) =TF(t, d)·IDF(t, d) = P c(t, d)
t0∈dc(t0, d)
·log n
nt
(2.2) withnthe number of the documents in the document collection andntthe
num-ber of documents containing the termt.
• Pointwise Mutual Information (PMI) is a measure of association between the term and the text. It is similar to TF-IDF, essentially comparing the actual num-ber of occurrences with the expected numnum-ber of occurrences given how many terms occur in documentdand how common the termtis:
PMI(t, d) = log P(t, d) P(t)P(d) (2.3) where: P(t, d) = c(t, d) m P(t) = P d0∈Dc(t, d0) m P(d) = P t0∈T c(t0, d) m m =X t0∈T X d0∈d c(t0, d0)
20 2.3 Text Representation
withT the set of all terms that appear in the document collection. It is possible for the PMI of a term within a document to be negative. In that case, we can change the weight of this term to zero which is called Positive Pointwise Mutual Information (PPMI). It is then given by:
PPMI(t, d) = max 0,log P(t, d) P(t)P(d) (2.4)
In this present research, we weight the tag occurrences based on a variant of Positive Pointwise Mutual Information (PPMI) to associate more significance to tags that are less common and more closely correlated with a particular geographic location. This method will be explained in Section 4.2.1.
2.3.2
Term Selection
Term selection is the process of automatically selecting the terms that are most relev-ant (i.e. most useful) to the considered task. It is also called feature selection, variable selection, or attribute selection. The term selection process is an important component for most text mining tasks. It mostly acts as a filter for cleaning out the irrelevant or partially relevant features that can negatively impact model performance. The main objectives of term selection are [46]: (i) improving the prediction performance by providing the most relevant features, (ii) enabling faster training by minimising the number of features, and (iii) making it easier to interpret and understand the nature of the data. As term selection methods seek to reduce the number of features in the data-set, it can be used as a special case of dimensionality reduction [80]. Whereas term se-lection methods include and exclude terms present in the data without changing them, other dimensionality reduction approaches (such the low dimensional vector space em-beddings methods that will be explained in Section 2.4) create a new combination of features.
Term selection methods often apply a statistical measure to score each term or feature. The features are ranked by their score and the most relevant features are those with the
2.3 Text Representation 21
highest value. Below are some examples of widely used methods for term selection and scoring:
• Chi-Squared (χ2) is a measure for modelling the dependency between the terms
(or features) and the classes (such as gender, political preference, or land cover type). For each classc∈C and each termtoccurring in a document belonging to classc, theχ2statistic ranks terms with respect to the following quantity:
χ2(t, c) = (Otc−Etc) 2 Etc + (Ot¯c−Etc¯) 2 Et¯c + (O¯tc−E¯tc) 2 E¯tc + (O¯t¯c−E¯tc¯) 2 E¯t¯c (2.5)
where Otc is the number of documents in class c where term t occurs, Ot¯c is
the number of documents outside classcwhere termtoccurs,O¯tcis the number
of documents in classc where termt does not occur, and O¯t¯cis the number of
documents outside class c where term t does not occur. Moreover, Etc is the
expected number of occurrences of term t in documents belonging to class c, and similar forEt¯c,E¯tc, andE¯t¯cwhich can be computed as:
Etc =N ·P(t)·P(c) Et¯c=N ·P(t)·(1−P(c)) Etc¯ =N ·(1−P(t))·P(c) Et¯¯c=N ·(1−P(t))·(1−P(c))
where N here is the total number of documents, P(t) is the probability that a document contains termt, and P(c) is the probability that a document belongs to classc. These probabilities can be estimated by:
P(t) = P c∈COtc P t∈T P c∈COtc (2.6) P(c) = |c| N (2.7)
22 2.3 Text Representation
• Correlation Coefficient (CC) is a variant ofχ2 test whereCC2 = χ2. The
Cor-relation Coefficient has been defined in [82] as:
CC(t, c) = √ N ·(Otc·O¯tc¯−Ot¯c·O¯tc) p (Otc+Ot¯c)·(Otc+O¯tc)·(O¯tc+O¯tc¯)·(Ot¯c+O¯t¯c) (2.8)
withOtc,Otc¯,Otc¯,O¯tc¯, and N as defined inχ2. CC can be seen as a ‘one-sided’
version ofχ2. The correlation coefficient (CC) selects those terms that are highly related to a class, while theχ2may also pick out terms that are indicative of
non-membership in the class.
• Log-Likelihood is an alternative toχ2. For each termtand classc ∈C, the log likelihood statistic is given by:
LL(t, c) = 2(OtclogOtc+Otc¯logOtc¯+O¯tclogO¯tc+Ot¯c¯logOt¯¯c+NlogN
−(Otc+Otc¯) log(Otc+Ot¯c)−(Otc+O¯tc) log(Otc+O¯tc)
−(Ot¯c+Ot¯c¯) log(Ot¯c+O¯tc¯)−(O¯tc+O¯t¯c) log(O¯tc+O¯t¯c)) (2.9)
whereOtc,Ot¯c,Otc¯,O¯t¯c, and N are as defined above.
• Kullback-Leibler (KL) Divergence is a measure of how much the probability dis-tribution of termtacross documents from a given class differs from the reference probability distribution. It is given by:
KL(t) =X
c∈C
P(c|t) log P(c|t)
P(c) (2.10)
whereP(c)is the probability of classcandP(c|t)is is the probability of termt
in classcwhich is estimated by:
P(c|t) = POtc
c∈COtc
(2.11)
Note that Kullback-Leibler divergence immediately produces a single ranking for the term over all the classes, in contrast to theχ2, Correlation Coefficient and log-likelihood, which provide a ranking per class.
2.4 Low Dimensional Vector Space Representation 23
2.4
Low Dimensional Vector Space Representation
A bag-of-words (BOW) representation can be seen as a very high-dimensional vector representation. An embedding is a mapping from such a high-dimensional vector rep-resentation into a relatively low-dimensional reprep-resentation (e.g. 300 dimensions). Un-like in BOW representations, the individual dimensions in the vector space embedding typically have no specific meaning. They represent the overall patterns of the distance between objects by placing semantically similar objects close together in the embed-ding space. In this thesis, we develop two novel models for learning low-dimensional vector space embeddings by integrating the textual information derived from Flickr with the numerical and categorical information derived from structured scientific data-sets. The first model, named EGEL model, generates the embedding for representing the geographic locations which will be presented in Chapter 6; The Second model, named SPATE model, generates the embedding for representing the spatiotemporal regions which will be presented in Chapter 7.2.4.1
Vector Space Embeddings
The use of low-dimensional vector space embeddings for representing objects has already proven effective in a large number of applications, including natural language processing (NLP), image processing, and pattern recognition. In the context of NLP, the most prominent example is that of word embeddings, which represent word mean-ing usmean-ing vectors of typically around 300 dimensions. A large number of methods for learning such word embeddings have already been proposed, including Skip-gram and the Continuous Bag-of-Words (CBOW) model [77], and GloVe [86]. They have been applied effectively in many downstream NLP tasks such as sentiment analysis [112], part of speech tagging [89, 72], and text classification [70, 38]. The model we consider in this thesis builds on GloVe, which was designed to capture linear regular-ities of word-word co-occurrence. In GloVe, there are two word vectorswiandw˜j for
24 2.4 Low Dimensional Vector Space Representation
each word in the vocabulary, which are learned by minimizing the following objective function: J = V X i,j=1 f(xij)(wi.w˜j +bi+ ˜bj−logxij)2 (2.12)
where xij is the number of times that wordi appears in the context of word j, V is
the vocabulary size, bi is the target word bias, and ˜bj is the context word bias. The weighting function f is used to limit the impact of rare terms. It is defined as 1 if
x > xmax and as(xmaxx )α otherwise, wherexmax is usually fixed to 100 andαto 0.75. Intuitively, the target word vectors wi correspond to the actual word representations
which we would like to find, while the context word vectorswj˜ model how occurrences ofj in the context of a given wordiaffect the representation of this latter word. In this thesis, we will use a similar model, specifically in Chapters 6 and 7, which will be aimed at learning spatial or spatiotemporal region vectors instead of the target word vectors.
Beyond word embeddings, various methods have been proposed for learning vector space representations from structured data such as knowledge graphs [8, 126, 115], social networks [43, 121] and taxonomies [119, 83]. The idea of combining a word embedding model with structured information has also been explored by several au-thors, for example, to improve the word embeddings based on information coming from knowledge graphs [124, 109]. Along similar lines, various lexicons have been used to obtain word embeddings that are better suited at modelling sentiment [112] and antonymy [84], among others. The method proposed by [71] imposes the con-dition that words that belong to the same semantic category are closer together than words from different categories, which is somewhat similar in spirit to how we will model categorical datasets in our embedding models.
2.4 Low Dimensional Vector Space Representation 25
2.4.2
Embedding Spatial or Spatiotemporal Information
The problem of representing geographic locations using embeddings has also attrac-ted some attention. An early example is [95], which used principal component ana-lysis and stacked autoencoders to learn low-dimensional vector representations of city neighbourhoods based on census data. They use these representations to predict attrib-utes such as crime, which is not included in the given census data, and find that in most of the considered evaluation tasks, the low-dimensional vector representations lead to more faithful predictions than the original high-dimensional census data.
Some existing works combine word embedding models with geographic coordinates. For example, in [16] an approach is proposed to learn word embeddings based on the assumption that words which tend to be used in the same geographic locations are likely to be similar. Note that their aim is dual to our aim in this thesis: while they use geographic location to learn word vectors, we use textual descriptions to learn vectors representing geographic locations or spatiotemporal regions.
Several methods also use word embedding models to learn representations of Points-of-Interest (POIs) that can be used for predicting user visits [33, 73, 132]. These works use the machinery of existing word embedding models to learn POI representations, intuitively by letting sequences of POI visits by a user play the role of sequences of words in a sentence. In other words, despite the use of word embedding models, many of these approaches do not actually consider any textual information. For example, in [73] the Skip-gram model is utilised to create a global pattern of users’ POIs. Each location was treated as a word and the other locations visited before or after were treated as context words. They then use a pair-wise ranking loss [123] which takes into account the user’s location visit frequency to personalise the location recommend-ations. The methods of [73] were extended in [132] to use a temporal embedding and to take more account of geographic context, in particular, the distances between pre-ferred and non-prepre-ferred neighbouring POIs, to create a “geographically hierarchical pairwise preference ranking model”. Similarly, [127] developed a method for
model-26 2.4 Low Dimensional Vector Space Representation
ling places, neighbourhoods, and users from social media check-ins. They treat the check-ins as sentences to generate the embeddings which encode the geographical, temporal, and functional aspects. In [128], the CBOW model was trained with POI data. They ordered POIs spatially within the traffic-based zones of urban areas. The ordering was used to generate characteristic vectors of POI types. Zone vectors, rep-resented by averaging the vectors of the POIs contained in them, were then used as features to predict land use types. The authors of [125] proposed a method that uses the Skip-gram model to represent POI types, based on the intuition that the vector rep-resenting a given POI type should be predictive of the POI types found in nearby places of that type. In the CrossMap method, [129] learned unsupervised embeddings for spa-tiotemporal hotspots obtained from social media data of locations, times and text. In one form of embedding, intended to enable reconstruction of records, neighbourhood relations in space and time were encoded by averaging hotspots in a target location’s spatial and temporal neighbourhoods. They also proposed a graph-based embedding method with different nodes for modelling location, time and text. The concatenation of the location, time and text vectors were then used to predict peoples’ activities in urban environments. In another work, [130] proposed the ReAct model, which is sim-ilar to CrossMap. However, while the CrossMap model is unsupervised and handles static data, ReAct is a semi-supervised model and handles continuous online data to learn the activity models.
In NLP research, embedding methods have been used to measure the language vari-ation across geographical regions as well as over time [3, 60, 65, 87, 49]. For instance, [3] and [65] present methods to learn geographically situated word embeddings from geo-tagged tweets. They used cosine similarities between the generated embeddings to measure the spatial variation of the language across English speaking countries. The authors of [49] used the Doc2Vec method [67] to learn document embeddings from online posts in German-speaking regions. These embeddings have been used to study language variation in German. To study the temporal variation of language, [60], among others, trained the Skip-gram model on text from the Google Books corpus for
2.5 Machine Learning 27
the period from 1900 to 2009. They also used cosine similarity to measure the change in word meaning between the embeddings of the same words learned in different time periods. In [87], they used the CBOW model to learn spatiotemporal embeddings from geo-tagged tweets. They first split the data into 8-hour windows (i.e. the temporal granularity) for each separate country (i.e. the spatial granularity). For each time win-dow, they then trained a joint embedding using tweets from all countries and used it to initialise the country-specific embeddings.
Despite the considerable progress that has been made on embedding social media data, the problem of embedding Flickr tags has so far received very limited attention. To the best of our knowledge, [48] is the only work that generated embeddings for Flickr tags. However, their focus was on learning embeddings that capture word meaning, which has been evaluated on word similarity tasks.
Our work in Chapters 6 and 7 is different from all these studies, as our focus is on spatial or spatiotemporal embeddings based on text descriptions (in the form of Flickr tags), along with numerical and categorical features from environmental datasets.
2.5
Machine Learning
Machine Learning (ML) is a set of general algorithms which have the ability to learn and infer based on available data [62]. Machine learning algorithms usually build a mathematical model based on a data sample, known as “training data”, in order to make predictions or decisions. They have been used in a wide variety of applications, such as natural language processing, sales and marketing, computer vision, and many others. Machine learning approaches are often categorised into supervised and unsu-pervised learning. Suunsu-pervised learning algorithms can apply what has been learned from labelled examples to predict labels for new data. The most studied supervised learning task is classification. Unsupervised learning is usually used when the input datadonot have labels. The goal of unsupervised learning is to model the underlying
28 2.5 Machine Learning
structure or distribution in the data to learn more about the data. The most widel