VIRTUAL BORDERS:
ONLINE NOMINAL RIGIDITIES AND INTERNATIONAL MARKET SEGMENTATION Jean Boivin
Robert Clark Nicolas Vincent Working Paper 15642
http://www.nber.org/papers/w15642
NATIONAL BUREAU OF ECONOMIC RESEARCH 1050 Massachusetts Avenue
Cambridge, MA 02138 January 2010
We would like to thank seminar participants at Duke University, the Federal Reserve Board of Governors and the CIRPÉE Annual Meeting for their insightful comments. We are grateful to Pierre-Olivier Lachance for excellent research assistance, as well as Tim Prendergast for data collection. Boivin acknowledges support from the National Science Foundation (SES-0518770) and the Social Sciences and Humanities Research Council of Canada, and Vincent from a HEC Montréal research start-up grant. The views expressed herein are those of the authors and do not necessarily reflect the views of the National Bureau of Economic Research.
NBER working papers are circulated for discussion and comment purposes. They have not been peer-reviewed or been subject to the review by the NBER Board of Directors that accompanies official NBER publications.
NBER Working Paper No. 15642 January 2010
JEL No. E30,F3,F4,L16
ABSTRACT
Do prices respond to macro shocks? Does the mere presence of international frontiers hinder trade? We revisit these questions by studying a dataset of online book prices for a number of US and Canadian retailers. We believe our dataset is well suited to this task for a number of reasons: (1) data for multiple retailers are available; (2) the products sold are identical across retailers; (3) the sample spans a period of large fluctuations in the bilateral exchange rate; (4) the nature of the industry is such that physical distance is irrelevant beyond shipping costs which are observable; (5) nominal frictions in the form of menu costs are arguably minimal; and (6) proxies for sales are available for most retailers. Given the unique nature of our dataset, the first objective of the paper is to document the degree of price rigidity and price dispersion. Our main findings are: online book prices display significant stickiness; there is a large degree of heterogeneity across retailers in terms of price rigidity and pricing strategy; price dispersion is high both within and across borders. Also, price levels do not appear to respond to exchange rate fluctuations. Building on the predictions from a simple two-country, multi-firm model and by exploiting information contained both in prices and quantities, we show that market segmentation is probably behind this disconnect .
Jean Boivin Bank of Canada 234 Wellington Street Ottawa Ontario K1A 0G9 Canada and NBER [email protected] Robert Clark
Institute of Applied Economics HEC Montreal
3000, chemin de la Cote-Sainte-Catherine Montreal (Quebec) H3T 2A7
Canada [email protected] Nicolas Vincent HEC Montreal Montreal, Quebec Canada [email protected]
1. Introduction
How quickly and to what extent do prices respond to market forces? These questions are central to our understanding of what drives macroeconomic ‡uctuations and of how to best mitigate them. Di¤erent assumptions lead to fundamentally di¤erent views of how the economy works and the actual scope for stabilization policies. Given the importance of these questions, it is not surprising that a large empirical literature has developed to investigate the behaviour of prices.
The recent micro evidence on price setting behaviour …nds that prices are changed rela-tively frequently –compared to what is typically assumed in the macro literature –but also that there is considerable heterogeneity.1 While this unconditional micro evidence is
cer-tainly useful for checking whether a speci…c friction –e.g. menu cost –is consistent with the behaviour of disaggregated prices, it is not clear that it addresses the fundamental questions stated at the outset. Our view regarding the sources of macroeconomic ‡uctuations and the role of stabilization policies depends not only on how frequently prices are changing, but also on how they are adjusting to market forces. For instance, …rms could be implementing frequent price changes automatically through arbitrary rules of thumb without regard for the overall market conditions. Alternatively, …rms might be changing prices quickly in the face of some shocks and slowly when faced with others.2 It is therefore necessary to move 1Looking at disaggregated prices from the Consumer Price Index, Bills and Klenow (2005) …nd that
the average duration for prices is 4.3 months, with considerable heterogeneity across sectors and types of goods and services. This evidence is inconsistent with the duration needed in a macro model to match the persistence of aggregate prices. Nakamura en Steinsson (2008) and Klenow and Kryvtsov (2008) …nd a longer duration of prices, somewhere between 7 and 9 months. But Nakamura and Steinsson (2008) …nd that prices changes are highly seasonal and that the hazard function is downward sloping, both facts being inconsistent with the typical menu cost models considered in the macro literature.
2For instance the evidence reported in Boivin, Giannoni and Mihov (2009) and Mackowiac, Moench and
Wiederholt (2009) would be consistent with price setters responding more quickly to disturbances emanating from their sector than to economy wide forces.
beyond summary statistics on the frequency of price changes and to attempt to document whether and how prices are responding to particular developments.
For an open economy, one particularly important market force that should in princi-ple a¤ect the pricing decision is the exchange rate. For instance, in October of 2007, the Canadian dollar reached and went beyond parity against the US dollar for the …rst time in more than thirty years, having experienced a dramatic increase of about 30% against the US dollar over the previous three years. From the perspective of Canadian consumers, this rapid appreciation of the Canadian currency made many goods and services quite expensive at home compared to the US. This led to consumer uproar culminating on October 23rd with an explicit call by the Finance Minister for Canadian price setters to lower their prices, citing as an example the Harry Potter book, which at the time was selling for 20% less in the US. His argument was that “[t]here should not be large discrepancies between similar products just because they’re being sold on di¤erent sides of [the] border."3
However, it may not be surprising for prices to react very little or not at all to exchange rate ‡uctuations if …rms face constraints to price adjustment and/or there is a high degree of international market segmentation between the US and Canada. For example, we should expect that small frictions will prevent consumers from taking advantage of lower grocery prices across the border. In addition, products are often tailored to local markets, and may therefore not be perfect substitutes.4
In this paper we revisit the relationship between price adjustments and exchange rate ‡uctuations in the context of the US-Canada online book industry. This is a market in
3“Canadian retailers should lower prices ’as soon as possible’: Flaherty”,www.cbc.ca, October 23rd, 2007. 4This is why, for instance, in their empirical analysis, Burstein and Jaimovich (2009) and Gopinath et
al. (2009) study wholesale prices where the scale of transactions should give …rms a larger incentive to take advantage of deviations from the law of one price. One could argue, however, that while the bene…ts could be large, the costs for a retailer of switching wholesaler may also be sizeable.
which a priori we would expect nominal rigidities and trade frictions to be minimal. What are the features that make this market and our data set appropriate for this type of study? First, each product is identical across retailers, which makes our analysis immune to issues of quality, packaging, and size di¤erences which are present in the data used in earlier studies (e.g. Broda and Weinstein, 2008). Second, price comparisons can be readily done online and so shopping or search costs should be orders of magnitude lower than for non-online items. Third, according to the NAFTA agreement, books are not subject to trade restrictions or tari¤s and there are no constraints on buying books from foreign websites between these two countries. Fourth, the nature of the industry is such that the physical concept of distance is irrelevant: the consumer does not have to travel to purchase the good and rather must incur shipping costs, which we observe. Fifth, Canada and the US are among the most economically integrated countries in the world, with similar tastes and economic environments. Sixth, data for multiple retailers are available which is important for distinguishing between cross-country vs cross-retailer heterogeneity. Finally, for some websites, we have proxies for (relative) sales, which makes it possible to study the reaction of quantities to movements in international relative prices.
We collected data three times a week, between March 2008 and June 2009, from the websites of the main players in the online retail book market, both in the US (Amazon.com
andBN.com) and in Canada (Amazon.caandChapters.ca). A book is added to our sample as soon as it appears on one of the New York Times Bestsellers Hardcover lists. The subsample we use for this study consists of more than 140,000 price quotes. In line with previous studies, we …nd very little evidence that exchange rate ‡uctuations in‡uence local-currency prices.5 As the value of the Canadian dollar versus its American counterpart fell by more
5For recent empirical evidence on this topic, see for example Burstein and Jaimovich (2009), Crucini and
than 20% between June 2008 and March 2009, book prices moved from parity to being on average 22% cheaper in Canada.
Since price di¤erences across countries may naturally arise from the presence of nominal rigidities (see Engel and Rogers, 1996), we …rst document the unconditional behaviour of prices in our data set. This part of the empirical investigation also allows us to shed further light on the micro evidence on the frequency of price adjustment, for prices that should not be subject to important menu costs. Looking at summary statistics for all books and retailers in our data set, we …nd that online book prices change considerably more frequently than anything reported in the literature before: the average price duration in the U.S. is about one month, whereas the median is about one week. However, such summary statis-tics are misleading as they mask considerable heterogeneity across retailers and countries. For example, the median price duration for Amazon.ca is four times greater than for Ama-zon.com. Di¤erences across retailers also apply to most other pricing dimensions. Overall, despite the ease with which these prices can be changed online prices still display signi…cant price stickiness.
Deviations from the law of one price (LOP) could also be consistent with the presence of a border e¤ect: various frictions may lead to ade facto market segmentation across countries, which insulates prices from the need to respond to exchange rate movements.6 In our dataset,
deviations from the law of one price are widespread and sizeable, with cross-border discounts of the order of 10%-20% being quite common. However, before drawing conclusions about international market segmentation, we need to evaluate this variation in international prices in the context of the dispersion of online book prices within country. We …nd that price
6Such frictions could include: international transaction costs (such as those implied by the use of di¤erent
monies), regulatory costs, di¤erences in national tastes, market conditions, di¤erences in local production, and shipping costs.
di¤erences between the two US retailers are large: prices at BN.com are on average 20% higher than atAmazon.com, with more than 93% on the books in our data set being cheaper at Amazon.com. This is surprising if one comes from the view that the internet should reduce consumer search costs but is consistent with evidence previously documented in the industrial organization literature.7 Nonetheless, the presence of such a high dispersion in
the US highlights the challenge of attributing the dispersion in prices between Canada and the US to a border e¤ect. Once a friction is introduced to explain the large dispersion of prices within country, it is not clear how the e¤ect of this friction can be disentangled from a border e¤ect, at least not without imposing the restrictions of a theoretical model.8
Since international price di¤erences alone do not imply international market segmen-tation, to make further progress we use a simple two-country, multi-…rm model in which retailers in the same country are assumed to be distributed in consumer preference space (for example as a result of their website design) and where buying from a foreign retailer rep-resents a border cost leading to a form of home bias. This is a version of Salop (1979) where physical distance is re-interpreted as distance in the consumers’preference space. The model predicts that if markets are internationally integrated, retailers would react to the exchange rate for products whose prices are competitive relative to the foreign alternative. If markets are segmented, prices would not react. This result, however, is conditional on prices being ‡exible. In the presence of nominal rigidities, the task is more complex: the lack of response of prices to exchange rate ‡uctuations could be due to market segmentation or the fact that prices are sticky. To sort this out, we also look at the behaviour of (relative) quantities: if markets are completely segmented, quantities should not respond to the exchange rate.9
7Other studies have found similar evidence in various online markets. See for example Baye, Morgan and
Scholten (2004), Clay et al. (2002), Ellison and Ellison (2007),
8See Gorodnichenko and Tesar (2009) for a formal discussion of this identi…cation issue.
We test these predictions in our dataset. First, we …nd no signi…cant relationship between cross-border price di¤erentials and the timing of price changes: a book in violation of the law of one price is not more likely to be repriced. In addition, when prices do change, there is no conclusive evidence that they move in a direction consistent with the predictions of the model. In addition, the behavior of quantities does not seem to display any systematic relationship with the exchange rate. Overall, these results are consistent with the presence of international market segmentation.
The rest of the paper is organized as follows. Section 2 describes our dataset. Sec-tion 3 documents stylized facts about the frequency at which prices and reference prices are changing in our data set, while Section 4 describes the within and cross-country price dispersions. Section 5 presents a theoretical model that is consistent with the presence of both national and international price di¤erences. Section 6 investigates the predictions of the model empirically, and Section 7 concludes.
2. Data
We collect data from websites of the main players in the online book market, both in the US (Amazon.com and Barnes and Noble’s website, BN.com) and Canada (Amazon.ca
and Chapters.ca). Amazon.com is by far the leader in terms of market share on the US market, while the Canadian market appears to be more evenly split.10 Our main variable
of interest is the price advertised, but we also collect additional information such as the list price, membership price, sales rank (when available), author, title, publisher and publishing date. A book is added to our sampling universe as soon as it appears on the New York Times the US-Canada border responds to exchange rate movements.
10An interesting question is how distinct Amazon.com and Amazon.ca are in reality. In fact, the next
Bestsellers hardcover list, which includes four categories: Hardcover Fiction, Hardcover Non-Fiction, Hardcover Advice and Hardcover Business. Hardcovers are new to the market and don’t have competing editions, while paperbacks may have multiple ISBN numbers for multiple editions. Bestsellers lists are released each week on Saturday, except once a month for Hardcover Business. A given book is uniquely identi…ed by its ISBN, and is therefore identical in Canada and the US: there are no di¤erences in packaging, size or content. This also precludes potential product substitution (e.g. for a paperback version), since this would lead to a new ISBN. The period studied is from March 2008 to June 2009, and information is retrieved three times a week, on Mondays, Wednesdays and Fridays. It should also be noted that most books in our sample are printed in the US.
For most of our empirical analysis, we start the sample on June 2, 2008 in order to get a set of books of signi…cant size. The sampling period ends on June 29, 2009. Also, we restrict our attention to the 213 books for which price quotes are available on at least 95% of the sampling dates. This leaves us with a total of 141,646 price quotes. We also observe shipping costs for all retailers as well as sales rankings forAmazon.com, BN.com as well as
Amazon.ca. Though the algorithms behind the rankings are proprietary, we will still use them as proxies for (relative) sales. All retailers o¤er international shipping, and shipping charges can be computed for any order size. This information will be used in subsequent analysis.
Books in our sample range in price from $4.59 to $40, with an average of $18.75 and a median of $18.39 (all local currency dollars). The average book price has experienced an in‡ation of 6.5% over the 13 months of our sample.
3. Facts on nominal rigidity
We …rst document the degree of price rigidity in our dataset, delaying the discussion on price dispersion to Section 4.. The main …ndings in this section are: online book prices are sticky, with a frequency of price changes of less than 4%; the duration of price spells appears lower than for books sold in brick-and-mortar stores; the sampling frequency can alter signi…cantly the measure of price rigidity; small price changes are prevalent; and there is a tremendous degree of heterogeneity in pricing behavior across retailers.
As a …rst step, we compute the fraction of observations which are characterized by a price change over the period June 2, 2008 to June 29, 2009. At this point no attempt is made at purging our dataset of sales and temporary price changes. Therefore, for a given book, a price change occurs if the price of a given book/retailer is di¤erent than for the previous observation’s price. Recall that there are three price quotes per week.
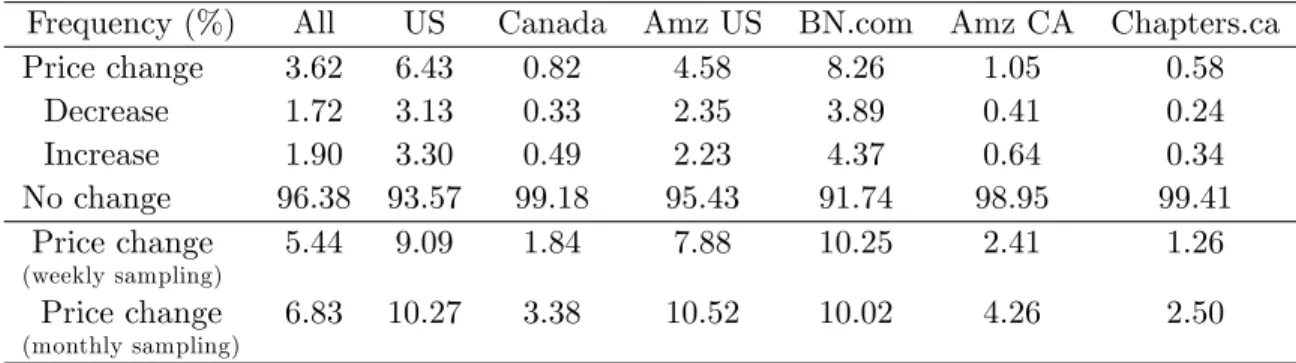
The …rst two columns of Table 1 show the presence of signi…cant price stickiness in our dataset, with only 3.6% of observations characterized by price changes. In other words, on average 96.4% of prices do not change between two sampling dates (2 or 3 days). As evidenced elsewhere in the literature, price decreases account for a large fraction of price changes despite signi…cant positive trend in‡ation over the sample: 48% and 52% of price changes are price decreases and increases respectively. There are, however, large di¤erences across retailers: the frequency of price changes is above 8% forBN.com but barely 0.5% for
Chapters.ca. One could hypothesize that …rms with brick-and-mortar operations (Barnes and Noble and Chapters) may wish to limit price ‡uctuations because of the presence of menu costs or in order to avoid creating wedges between store and online prices. Yet, there is no evidence in this dataset that …rms with physical stores have stickier prices than internet-only retailers.
We do not …nd any clear evidence that retailers change prices more frequently around Thanksgiving (November) and Christmas season. However, …rms appear to have changed prices most in January 2009, with a maximum frequency of 6.5%, and the least in May 2009 (1.9%). Time variation in the frequency of price changes is even more pronounced for individual retailers. For example in 2008, 10.5% of BN.com’s price observations were price changes, but only 5.6% in 2009. Part of the explanation seems to be that Barnes and Noble puts newer books on sale more frequently. However, for Amazon.com, the pattern is reversed: prices are stickier in the …rst half of the sample (2.6% in 2008 versus 7% in 2009).
Table 1: Frequency of price changes.
Frequency (%) All US Canada Amz US BN.com Amz CA Chapters.ca
Price change 3.62 6.43 0.82 4.58 8.26 1.05 0.58 Decrease 1.72 3.13 0.33 2.35 3.89 0.41 0.24 Increase 1.90 3.30 0.49 2.23 4.37 0.64 0.34 No change 96.38 93.57 99.18 95.43 91.74 98.95 99.41 Price change (weekly sampling) 5.44 9.09 1.84 7.88 10.25 2.41 1.26 Price change (monthly sampling) 6.83 10.27 3.38 10.52 10.02 4.26 2.50
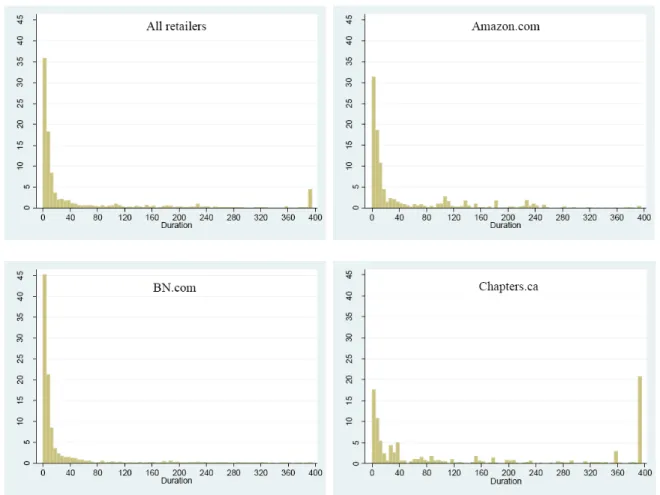
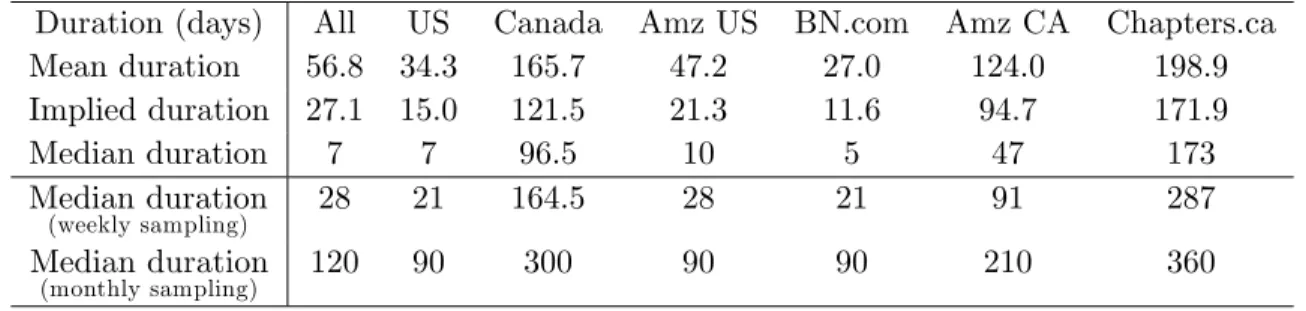
Next, individual price series are arranged into price spells. A spell starts when a new price is implemented and ends when it is changed again by the retailer. The maximum length of a price spell in our dataset is therefore thirteen months (392 days). This in turn means that due to censoring, the mean duration results are lower-bound estimates. Figure 1 shows histograms of price spell durations across all retailers as well as for three of the …rms in our sample. ForBN.com, barely 0.5% of price spells hit the upper bound of thirteen months. At the other extreme, more than 20% of price spells of Chapters.ca last 392 days. On aggregate, around 70% of price spells have a duration of less than a month. Table 2 shows that the average and median price durations are 56.8 and 7 days respectively, from a
Figure 1: Histogram of price spell durations, in days.
minimum median duration of 5 days for Barnes and Noble to a maximum of 173 days for Chapters.
Comparisons with other …ndings in the literature are complicated by the fact that our dataset uses a much higher sampling frequency than most other studies.11 For example,
Nakamura and Steinsson (2008) using CPI monthly data …nd that the frequency of price changes is 5.4% per month for the category "Books not purchased through book clubs" over
11In addition, other databases may include non-internet retailers as well as a sample of books which is
Table 2: Duration of price spells. Implied mean duration is equal to -1/log(1-f ), where f is the price change frequency.
Duration (days) All US Canada Amz US BN.com Amz CA Chapters.ca
Mean duration 56.8 34.3 165.7 47.2 27.0 124.0 198.9 Implied duration 27.1 15.0 121.5 21.3 11.6 94.7 171.9 Median duration 7 7 96.5 10 5 47 173 Median duration (weekly sampling) 28 21 164.5 28 21 91 287 Median duration (monthly sampling) 120 90 300 90 90 210 360
the 1998-2005 period. The average implied duration, at 18 months, is almost twenty times higher than in our sample. However, by construction the duration of a price spell in their case is bounded below at one month. It is possible that by using a monthly frequency they miss a large number of price changes between sampling dates. A natural question therefore arises: would our results be signi…cantly di¤erent with lower frequency data? The last two rows of Table 2 show the median duration when prices are instead sampled at weekly and monthly frequencies.12 We …nd that the median duration is now four times higher at 4
weeks. Duration results rise for all retailers. For monthly sampling, the median and mean increase to 4 and 5.3 months respectively. The evidence therefore seems to show that the sampling frequency used can signi…cantly alter the conclusions we reach about the degree of price rigidity present in the data. However, it remains that the monthly implied duration obtained using the frequencies from Table 4 is still only half that of Nakamura and Steinsson. This could be due to a number of factors: di¤erences in pricing behaviour between online stores and physical retail outlets, variations in sets of books or retailers, di¤erences in sample periods, etc.
12The weekly numbers are based on taking the Wednesday price observations. We obtain similar results
when considering Mondays or Fridays instead. For the monthly durations, sampling is done using the observation closest to the 25th day of each month.
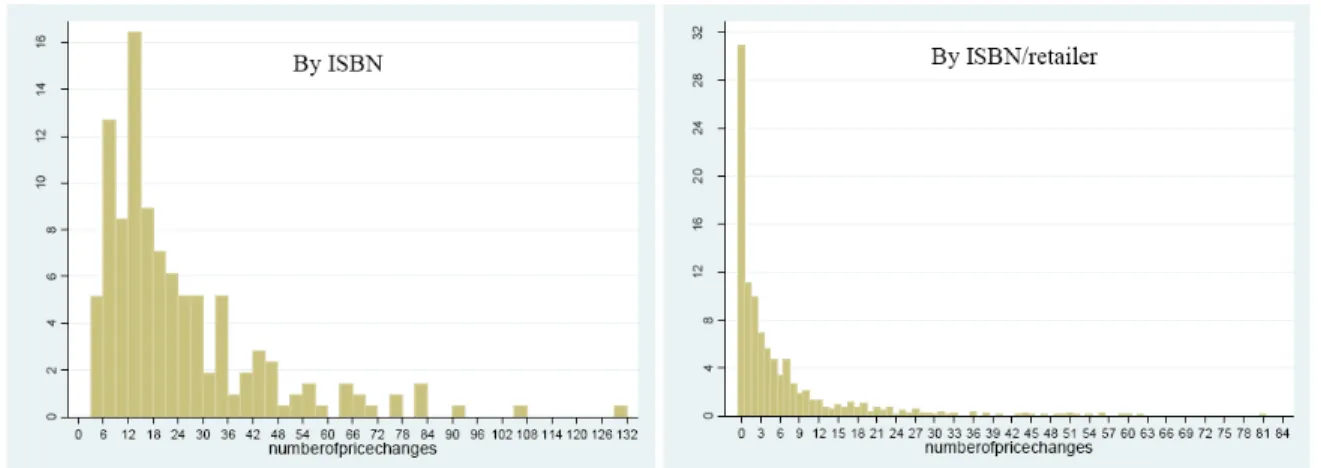
Figure 2: Distribution of the number of price changes
The plot on the left in Figure 2 shows the distribution of the number of price changes across books (ISBN), irrespective of retailers. There is actually no book whose price has not been changed by any retailer over the whole sample. The median is equal to 17, the mode is 14, and the maximum 131 price changes over thirteen months. There is a non-negligible set of books for which the number of price changes is greater or equal than 25 times over the sample period. However, this once again hides a large degree of retailer heterogeneity. The second plot in Figure 2 instead depicts the distribution of price changes across book-retailer pairs; in this case, slightly more than 30% of book-book-retailer pairs experienced no price changes. This con…rms that price ‡uctuations are largely driven by a few retailers.13
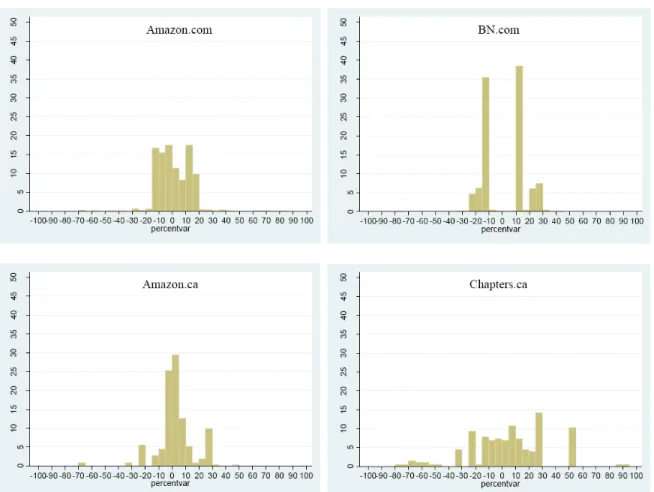
A look at Figure 3 shows the size of price changes varies widely across …rms. Barnes and Noble, for example, generally changes its prices by -14% or 12%, and almost never by less than 10%. Conversely, Amazon.ca implements numerous small price changes.
It is debatable whether price changes due to temporary, short-lived sales are particularly relevant to understand lower frequency macroeconomic phenomena. For this reason, most
13The median for the number of price changes by ISBN ranges from 0 for Chapters and Amazon.ca, to 8
macro studies on price data at the micro level discuss separately the behavior of "regular prices", i.e. prices purged from sales (see Nakamura and Steinsson, 2008, or Klenow and Kryvtsov, 2008). What "regular price" means is not always clear however: there is generally no clear marker for temporary sales.14 In this context, we adopt a concept similar to the reference price of Eichenbaum, Jaimovich and Rebelo (2008) to …lter out temporary price ‡uctuations. Conceptually, the reference price corresponds to the price most often observed over a given time period. For a product that experiences occasional temporary discounts, the reference price would therefore coincide with the "regular" price that the consumer generally faces.
Table 3 summarizes our …ndings for reference prices computed on a bi-weekly basis. The average duration of a reference price is 138 days in our sample, and the median is 84 days (versus 7 days for posted prices). The probability that a reference price changes on a bi-weekly basis is5:6%, and ranges from1:7%forChapters.ca to8:8% forAmazon.com. Notice that unlike posted prices, reference prices atBN.comandAmazon.com behave very similarly.
Table 3: Reference prices.
All US Canada Amz US BN.com Amz CA Chapters.ca
Bi-weekly frequency (%)
Ref. price change 5.55 8.68 2.41 8.78 8.58 3.16 1.67
Decrease 2.20 2.20 0.75 4.15 3.14 0.94 0.55 Increase 3.35 3.35 1.67 4.63 5.44 2.22 1.12 Duration (days) Mean 138 105 201 105 105 201 211 Median 84 42 168 42 42 168 182 Implied mean 245 154 574 152 156 436 831
How stable are the prices faced by online book consumers? One way to answer this
14One may consider that the list price is a form of regular price which is likely very sticky. In our sample,
a little more than 17% of online prices are equal to the posted price. But this number varies a lot across retailers: it is equal to 0% forAmazon.ca, 0.7% forAmazon.com, 13.6% forBN.comand 78% forChapters.ca.
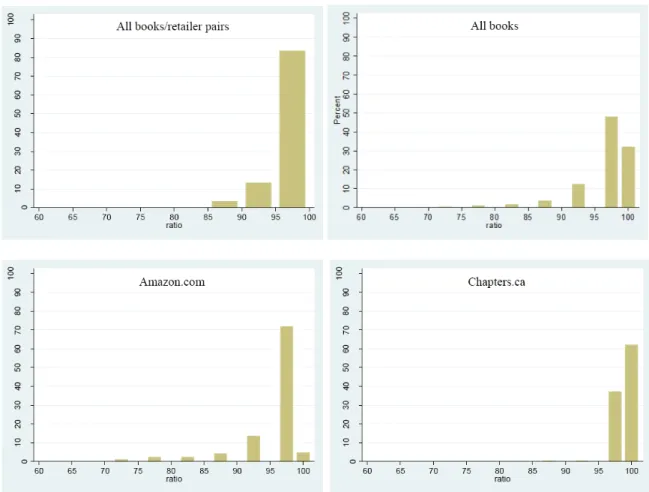
Figure 4: Prevalence of reference prices. Fraction of price quotes within a two-week period that are equal to that period’s reference price. For "All books/retailers", each observation is a book-retailer pair. For the other histograms, each observation is a book.
question is to look at the fraction of price observations within a two-week period that are equal to that period’s reference price. Figure 4 shows the distribution of this statistic in the aggregate as well as for all books two retailers. Across all book/retailer pairs, one third of the books have not experienced any deviation from the bi-weekly reference prices over the sample period. However, the top-right histogram shows that no single ISBN has been consistently equal to its bi-weeklyy reference price, once aggregated across all four retailers. Deviations have also been more frequent atAmazon.com than Chapters.ca, for example.
It is well known that for many products, prices tend to oscillate between two values: a regular and a sale price. To investigate the prevalence of such pricing behavior in our dataset, we compute the percentage of price changes which are of size similar (in absolute value) to the previous price change. If prices generally oscillate between two constant values, this percentage should be close to 100%. Results show that once again, heterogeneity is the norm: for BN.com, this number is equal to 94.4% over the whole sample. In other words, most price changes are temporary sales with the price returning to exactly its original level. ForAmazon.com andChapters.ca, the percentages are 59.3% and 50.8% respectively. In the case of Amazon.ca, however, oscillation is a less prevalent feature of their pricing strategy: only 28.7% of price changes are implemented to return the price to its original level.
4. Evidence on price dispersion
A number of studies have discussed whether the advent of internet has led to a reduction in the dispersion of prices, possibly by lowering consumer search costs. Our dataset includes a total of four retailers, two in each country, which allows us to study the topic of price dispersion in the context of online book retailing.
4.1. Within-country price dispersion
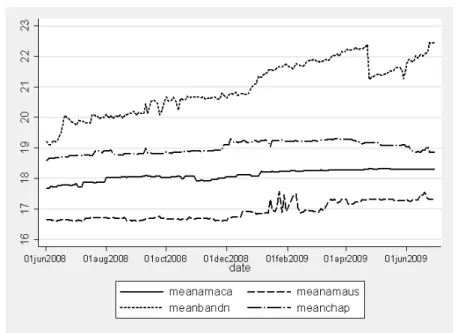
First, Figure 5 compares average book prices across retailers and time in each country. A striking …nding is that price di¤erences are large, particularly in the US: prices atBN.com
are about 20% higher than at Amazon.com on average. In Canada, di¤erences between the two main retailers are not as pronounced, with Chapters.ca being on average 5-6% more
Figure 5: Average prices in local currency. Evolution of the average price of a book, over time, by retailer. All prices are posted prices in local currency.
expensive.15 Prices at BN.com experienced visible in‡ation over thirteen months before a
substantial drop towards the end of the sample. The other retailers have maintained more stable prices on average.
The observed price dispersion does not appear to be the product of a few outliers having a large impact on the average price. Figure 6 plots the fraction of books that are cheaper at retailer x than retailer y. Clearly, price di¤erences are widespread for the books in our sample and not speci…c to a few titles. Using base posted prices, between 93% and 99% of books are cheaper atAmazon.com than atBN.com. This number goes down somewhat when member prices for BN.com are instead used for price comparisons. In Canada, this …gure
15Two retailers o¤er membership programs which, for an annual fee of $25 in local currency, give rebates of
5% (Chapters.ca) or 10% (BN.com) on posted online prices. Participants in those programs also periodically receive discount coupons that can be redeemed online. It is unclear how popular those membership programs are.
Figure 6: Fraction of books that are cheaper at retailer x than retailer y. Solid lines are based on comparisons of base prices; dotted lines use membership prices for BN.com and
Chapters.ca.
oscillates between 92% to 100%, with a declining trend in the last two months. However, price dispersion virtually disappears once member prices are used: Chapters.ca tends to set its member price a few cents lower thanAmazon.ca’s.
Even once shipping costs are taken into account, the conclusions remain unchanged: price dispersion, at least in the US, is high and mainly due to di¤erences in pricing strategies at the retailer level. This is in line with the …ndings by Clay, Krishan and Wol¤ (2001). In the context of a product as homogenous as books, it seems particularly challenging to explain what may lie behind such price dispersion.16
4.2. Inter-country price dispersion
The evidence on price dispersion presented in the previous section was only concerned with local currency prices. However, a large literature has studied the behavior of interna-tional prices in various contexts. In particular, a number of studies have been interested in
16Some have put forward branding (Clay et al., 2001) or di¤erentiated features such as reviews and loyalty
the following questions: Does the mere presence of international frontiers hinder trade? To what extent do borders lead to market segmentation? Our dataset is particularly well suited for analyzing these issues: both US retailers and both Canadian retailers ship internation-ally, products are homogenous, international transactions can be done without leaving one’s home, websites are similar in design and shipping costs are observable. Unlike other retail goods, trade frictions are not obvious in our context: consumers do not have to physically cross the border to take advantage of lower-priced goods. Consequently, deviations from the law of one price would arguably be more surprising in an online environment.
The main …nding from our dataset is that there is very little evidence of an impact of exchange rate ‡uctuations on local-currency prices. This was already evident from Figure 5 in the previous sub-section: despite a 20% depreciation of the Canadian dollar between June and November 2008, and a signi…cant appreciation afterwards, there was no visible impact on average prices at Amazon.ca and Chapters.ca. This in turn implies that prices expressed in a common currency (US dollars) must have ‡uctuated signi…cantly: the left-hand plot in Figure 7 shows that Canadian retailers moved from being similarly priced to their US competitors over the …rst third of the sample, to being relatively cheap afterwards. In fact, over the span of seven months, books went from being on average 2-3% more expensive in Canada than in the US to more than 22% cheaper (right-hand side plot). This price di¤erence mirrored almost perfectly the evolution of the exchange rate over our sample. This property is studied more systematically in Section 6.
While these price di¤erentials may seem substantial, in order to determine whether cross-border shopping can be advantageous, shipping costs need to be added to posted book prices.17 In this context, however, bundling issues are relevant: per-book costs are a function
Figure 7: International prices. Left: Average prices by retailer, in common currency (USD). Right: Exchange rate and average price di¤erence between US and Canadian retailers.
of the number of items ordered. For this reason, results for various order sizes are analyzed. Figure 8 plots over time the fraction of the 213 books in our sample that are cheaper in Canada than in the US, from the perspective of American consumers. A few things are worth highlighting. First, a signi…cant number of products can be found for cheaper across the border, even once shipping costs are factored in. This is particularly true for larger orders, since domestic shipping costs fall to zero once the consumer spends more than $25. When comparing prices at Amazon.com and Amazon.ca, up to 40% of items turn out to be cheaper in Canada based on bundles of four books. This fraction reaches 96% for the
BN.com-Amazon.ca pair, based on a 4-book order. Hence, and this is our second point, whether it is pro…table for a US consumer to order books in Canada depends highly on which retailers are compared. As will become clear in the next section, the implication is that it is di¢ cult to identify a border e¤ect based on international price di¤erences alone.
Third, in line with the previous evidence, the availability of cross-border deals is directly tied to the exchange rate: books in Canada were almost always more expensive than in the
Figure 8: Percentage of books which are cheaper in Canada, for a US resident, by pairs of retailers (including shipping costs). Various bundle sizes: 1 book (solid line), 4 books (dashed) and 8 books (dotted).
US in June 2008 when the Canadian dollar was at its peak, and again later in mid-2009. The opposite was true in late 2008 and early 2009.
Finally, deviations from the law of one price can be sizable. Figure 9 plots the distribution of discounts from shopping on Canadian websites, conditional on the book price being higher in the US (shipping costs are included). Discounts in excess of 10% are quite common, particularly for larger orders, and can be as high as 50% in some cases.18
From the perspective of a Canadian consumer, occasions to …nd books at a lower price in the US are scarcer over our sample. At the peak, 8% of books were cheaper atAmazon.ca
than Amazon.com. It goes up to 65% when comparing Amazon.ca and BN.com. However, most of these deals are observed only around mid-2008, before the depreciation of the Cana-dian dollar. Also, they apply mainly to single-book orders; for larger orders, di¤erences in posted prices are compensated by shipping cost disparities. For this reason, the rest of the paper will focus on cross-border price di¤erentials from the perspective of US consumers.
5. A model of international pricing
Section 4.2. demonstrated that the law of one price was often violated in our sample. In an online environment where trade frictions are few and search costs are low, are these seemingly arbitrage opportunities evidence of the presence of a border e¤ect?19 To answer
this question we develop a two-country model of price competition very similar to that of Gopinath et al. (2009). The setup is along the lines of the Salop (1979) circular city model of product di¤erentiation and is depicted in Figure 10. A border splits the circle into two
18These non-trivial price di¤erences cannot therefore be explained by the fees of 1% to 2.5% charged by
most credit cards for foreign currency transactions.
19Blum and Goldfarb (2006) show that Americans are more likely to visit websites from nearby countries
even controlling for language, income, etc. They conclude that distance proxies for taste di¤erences. In our case, since most of the books are bestsellers in both countries at the same time, taste di¤erences are unlikely to explain price dispersion.
Figure 9: Discounts from buying in Canada, for various pairs of retailers and order sizes. Shipping costs are included.
Figure 10: Two-country circular city model
countries (country 1 and country 2) with consumers and …rms from country 1 located along the circle on one side of the border and consumers and …rms from country 2 along the other side. We suppose that the circle is of unit length and that the border runs from 1/4 to 3/4. For simplicity and also because it is consistent with the dataset at hand, we focus on the situation in which there are just two …rms in each country: 1a and 1b in country 1 and 2a
and 2b in country 2. We assume maximal di¤erentiation and place 1a and 1b at 1/8 and 7/8 respectively and 2a and 2b at 3/8 and 5/8.
We suppose that there is a …rm-speci…c local variable cost that is in domestic currency:
cja and cjb for j = 1;2. In our context, it is also reasonable to assume that there is another
variable cost associated with the wholesale production of books. Most books are printed in country 1 (the US) and so there is a variable cost in U.S. dollars that is common across sellers. This cost is denoted byk.
Consumers are uniformly distributed along the circle, but there are potentially di¤erent sized masses on each side of the border. We normalize the mass of consumers in country 2 to be 1 and let the mass of consumers in country 1 (the US) be N. We suppose that
each consumer buys one unit of the product of their most preferred …rm. A consumer from countryj located at x who buys from …rmi located atxi gets utility
uji(x) =v pi sji tjxi xj bjI(xi; x): (1)
sji denotes the cost of shipping charged by …rm i for delivery to a consumer in country
j. For physical stores, it is natural to interpret t as a transportation cost. In the context of online retailing, this parameter encompasses all of the factors a¤ecting the cost for a consumer of consuming something other than his most preferred level of a particular characteristic, e.g. website layout, range of shipping options, availability of customer reviews, etc. I is an indicator function for whether the consumer and …rm are in di¤erent countries, andbj is the
border cost that must be paid in this case. Here, the border cost includes the uncertainty related to international transactions (e.g. currency exchange rate or extra fees charged by credit card company, shipping times, ease to return articles, etc.), as well as other factors that discourage consumers from buying from foreign sources.20
First, we are interested in …nding demand at each of the four …rms. Note that each …rm faces demand on two segments: one that is strictly domestic (ie. between 1b and 1a, and between 2a and 2b), and one that is international (ie. between 1a and 2a, and between 2b and 1b). Further note that there are three possibilities for the international segment: i) full market segmentation such that the indi¤erent consumer is right at the border (country 1 consumers buy from the country 1 …rm and country 2 consumers from the country 2 …rm),
20The border cost could even encompass informational frictions on the consumer side. For example, a
buyer may be simply unaware of the availability of cross-border deals. As price di¤erentials rise, such deals become better known either through word of mouth or media reports. Such an interpretation would be observationally equivalent to a preference-based friction.
ii) partial segmentation such that the indi¤erent consumer is in country 2 (all country 1 consumers buy from the country 1 …rm, as do some country 2 consumers), and iii) partial segmentation such that the indi¤erent consumer is in country 1 (all country 2 consumers buy from the country 2 …rm, as do some country 1 consumers).
Based on the utility function (1) and the setup of the model, it is possible to characterize the indi¤erent consumer on each segment of the circle (for instance, the indi¤erent consumer on the 1b-1a segment is ex11 b1a such that u 1 1a(xe 1 1b1a) = u 1 1b(ex 1
1b1a)). Then for the domestic
markets, demands are given by
d1b 1b1a =xe 1 1b1a = p1a p1b+s11a s11b 2t + 1 8; d1a 1b1a = 1 4 xe 1 1b1a = p1b p1a+s11b s11a 2t + 1 8; d2a 2a2b =xe 2 2a2b = p2b p2a+s22b s22a 2t + 1 8; d2b 2a2b = 1 4 ex 2 2a2b = p2a p2b+s22a s22b 2t + 1 8
where the superscript refers to the …rm and the subscript indicates which segment the demand refers to. Prices are in local currency, and for expositional purposes shipping costs are not included.
The task is a little bit more complex for the international segments (1a-2a and 1b-2b). For the 1a-2a segment, the indi¤erent country 1 and country 2 consumers are respectively
e x11a2a= p2ae+b1 p1a+s 1 2ae s11a 2t + 1 8 e x21a2a= p2a b2 p1a( 1 e) +s 2 2a s21a(1e) 2t + 1 8:
where e is the number of country 1 currency units that can be obtained from one unit of country 2 currency. Note that because of the discontinuity created by the border,xe1
1a2a 18
and xe2 1a2a
1
8. That is, we can never be in a situation where the indi¤erent country 1
consumer is bigger than 18 since then he would be located in country 2, in which case we should look at the problem from the perspective of a country 2 consumer. The reverse is also true: the indi¤erent country 2 consumer must be larger or equal to 18.
Further note that we assume that all consumers must buy at least one unit of the product. Therefore, there are three possible cases:
1. Full segmentation: ex1 1a2a = 1 8 and xe 2 1a2a= 1 8
If the border costs are such that
b1 p1a+s11a p2a+s12a e
and
b2 p2a+s22a p1a+s21a
1
e;
then the indi¤erent agent is at the border and the markets are fully segmented. 2. Partial segmentation with indi¤erent agent in country 1: ex11a2a< 18 if
b1 < p1a+s11a p2a+s12a e:
3. Partial segmentation with indi¤erent agent in country 2: ex2 1a2a> 1 8 if b2 < p2a+s22a p1a+s21a 1 e:
The conditions on the other international segment (2b-1b) are similar.
Next we derive predictions about how prices should adjust in response to the exchange rate and show that in order to identify international price segmentation, information from price and quantities needs to be used.
We assume that …rms maximize local currency pro…ts by choosing the optimal price for a given product. Without any loss of generality, we focus on …rms 1a and 2a.
We consider two cases:
1. Markets are fully segmented
The …rms’maximization problems are:
max p1a = (p1a c1a k)N 1 8+d 1a 1b1a = (p1a c1a k)N 1 4+ p1b p1a+s11b s11a 2t ; max p2a = (p2a c2a k 1 e) 1 8 +d 2a 2a2b = (p2a c2a k 1 e) 1 4 + p2b p2a+s22b s22a 2t :
Demand on the international segments is 18 for each …rm because of full segmentation. Not surprisingly, only domestic prices enter the demand functions, and sales are scaled by N for country 1 (though the relative size of the markets plays no role in the full segmentation case). The exchange rate only plays a role through movements in the
cost of imported inputs for country 2 …rms. Optimization leads to the following prices p1a = t 2+k+ 2c1a+c1b+s11b s11a 3 ; p2a = t 2+ k e + 2c2a+c2b +s22b s22a 3 :
This in turn implies that the elasticities of prices with respect to the exchange rate are respectively Ep1a;e = @p1a @e 1 p1a = 0; Ep2a;e = @p2a @e 1 p2a = 6k e(3te+ 6k+ 2c2be+ 4c2ae+ 2s22be 2s22ae) <0:
The price of a country 1 …rm is not a¤ected by exchange rate ‡uctuations when markets are fully segmented. In contrast, country 2 …rms react as long as a portion of their costs are denoted in foreign currency (Ep2a;e = 0 if k = 0). A su¢ cient condition for
the sign of this elasticity to be negative as expected is for domestic shipping costs to be equal; ie for s2
2b = s22a. In practice, domestic shipping costs are very similar across
retailers.
2. Partial segmentation with the indi¤erent agent located in country 1
max p1a = (p1a c1a k)N(d 1a 1b1a +xe 1 1a2a) = (p1a c1a k)N 1 4 + p1b+s11b p1a s11a 2t + (p2a+s12a)e+b1 p1a+s11a 2t ; max p2a = (p2a c2a k 1 e) d 2a 2a2b + 1 8 +N 1 8 ex 1 1a2a = (p2a c2a k 1 e) 1 4+ p2b p2a+s22b s22a 2t +N p1a+s11a (p2a+s12a)e b1 2t :
In this case, optimal prices and elasticities are complex expressions which are di¢ cult to analyze. Our main interest is in determining the sign of Ep2a;e. To do so, we …rst
derive the elasticity expressions at two extremes: when b1 = 0 (no border cost) and b1 = b1 (upper bound on the border cost that ensures partial segmentation). We can
show that under plausible parameter restrictions:21
Ep2a;ejb1=0 < 0;
Ep2a;ejb1=b1 < 0;
and
Ep2a;ejb1=0 > Ep2a;ejb1=b1:
3. In other words, a country 2 (Canadian) retailer …nds it optimal to raise its local cur-rency price following an appreciation of the US dollar for any value of the border cost such that markets are not fully segmented. The size of the price reaction is inversely proportional to the degree of market segmentation.22 When expressed in US dollars,
the model predicts that prices of Canadian retailers will fall but by less than the full movement in the exchange rate; that is, there is incomplete pass-through of exchange rate ‡uctuations into prices. There are two forces at play behind this prediction: the appreciation of the US dollar means that US retail prices become less competitive, and that USD-denominated marginal costs rise.
21These are mostly restrictions on the marginal costs, the shipping costs, and the exchange rate:
common-currency costs cannot be too di¤erent, either through a large dispersion in c’s or an exchange rate very di¤erent than 1, and similarly for shipping costs. In the context of our empirical study, it is reasonable to assume that the necessary conditions are satis…ed.
22We can also show that for the parameter space under consideration, the (absolute) elasticity is a
In contrast, the exchange rate elasticity is positive for country 1 …rm prices: as the value of their currency rises, American consumers …nd it more attractive to buy from Canadian retailers. US …rms respond by lowering their prices (in domestic currency) to remain competitive.
In the next section, we test whether the model predictions about prices are supported by our dataset. Any discussion on the behavior of quantities is postponed to Section 6.1.
6. Testing for international market segmentation
Earlier evidence already showed that average local currency prices did not seem to react to the large ‡uctuations of the exchange rate over the sample. Figure 11 goes one step further: it plots the distribution of the correlations between the prices in Canadian dollars and the exchange rate, for the two Canadian retailers. Under partial market segmentation, one would expect to see a majority of negative correlations: as the US dollar appreciates (e falls), Canadian …rms become relatively more competitive and respond by raising their prices. Looking at the plots in the left column, there does not seem to be much evidence of such behaviour for the books in our dataset. For Amazon.ca, close to 60% of books have a correlation of virtually zero, while for Chapters.ca it is 42%. In light of the evidence on price rigidity from Section 3., this may not be surprising: by construction, products which seldom experience price changes will have low correlation. While there is some evidence that negative correlations are more frequent, this could be due to the fact that over the sample period, prices have displayed an in‡ationary trend while the Canadian dollar depreciated.
The model of the previous section predicts that retailers will react to exchange rate ‡uc-tuations for products whose prices are competitive relative to foreign alternatives. The plots in the second column of Figure 11 report similar correlations, but for booksthat werecheaper
Figure 11: Correlations between local prices of Canadian retailers and exchange rate. Each observation is a book. "Competitive books" refers to items which are cheaper in Canada than at Amazon.com for at least 8 weeks (perspective of a US consumer).
in Canada (from the perspective of a US consumer) for at least 8 weeks over the sample. There does not appear to be any signi…cant di¤erence with the full sample; in fact, an even larger portion of books have prices uncorrelated with the exchange rate. In other words, there is no evidence that Canadian online retailers react to changes in the relative price of their goods on the North American market.
Alternatively, one can look at how prices in a common currency react to exchange rate movements. If markets are integrated, exchange rate pass-through is expected to be
incom-plete: for example, a 1% appreciation of the US dollar leads to a smaller-than-1% fall in the prices of Canadian retailers, expressed in USD. In other words, a portion of the currency ‡uctuations are absorbed in markups due to the presence of foreign competition. To deter-mine whether this happens in the online book market, a regression of the log price on its own lags and the log of the exchange rate is run for Canadian retailers. Figure 12 reports the average response over time of prices (in USD) to a permanent 1% appreciation of the US dollar.23 Impulse responses tend to be more stable for Amazon.ca, and there is no sign of incomplete pass-through: on impact, at t = 1, prices react fully to the 1% change in the exchange rate. Notice that this is true for the full sample as well as for books which were cheaper in Canada on at least twelve occasions over the sample period: Amazon.ca does not appear to react di¤erently based on how competitive their prices are versus foreign …rms.24
For Chapters.ca, prices react one-for-one on impact. There is some evidence of a reversal in the …rst few periods following the shock for books which are cheaper than in the US. However, this may be an artifact of small sample bias: as was clear from Figure 8, Chapters has a smaller portion of products which are cheaper than atAmazon.com.
These results may not however be a sign of market segmentation; instead, they could be an artifact of the pervasive price stickiness in our dataset. If retailers seldom reset prices, movements in a highly volatile variable such as the exchange rate will lead to large ‡uctuations in international relative prices. In fact, even if markets were integrated, if retailers face costs of changing prices they may …nd it optimal to avoid repricing items following exchange rate ‡uctuations.
The detailed nature of our dataset allows us to go a step further by taking into account
23An implicit assumption in computing the impulse responses is that shocks to prices and the exchange
rate are orthogonal.
24Choosing other tresholds does not alter the conclusions. However, impulse responses become noisier as
Figure 12: Average reaction of book prices to a 1% appreciation of the US dollar. Prices of Canadian retailers expressed in USD. Left: all books. Right: only books which are cheaper in Canada than at Amazon.com, for a US resident (4-book bundle).
the presence of price stickiness while testing for the presence of market segmentation. In particular, we are interested in answering the following questions: (1) Are prices more likely to be adjusted for books which are in violation of the law of one price (LOP)? (2) When prices of books are reset, is it in a direction that restores parity? (3) Is the size of price changes related to the degree of deviation from LOP? The underlying idea is simple: if international markets are integrated to some degree, large cross-border price di¤erentials should represent an additional incentive for retailers to change prices. In addition, even if a …rm’s actions are limited by the presence of menu costs, we should expect that conditional on modifying its price it does so optimally. Our dataset is ideal for answering these questions: price quotes are sampled at high frequency for a large number of items, and a control group is available since the sample includes books both cheaper and more expensive across the border.
Recall that from the point of view of a Canadian retailer j, in each period their products can be sorted into three categories:
books which are cheaper than in the US for a US consumer;
e pCA;jit +sCA!U S;j <minnpU S;kit +sU S!U S;ko
k2fAmazon:com;BN:comg
books which a Canadian consumer can …nd for less at a US store;
e pCA;jit +sCA!CA;j >minnpU S;kit +sU S!CA;ko
k2fAmazon:com;BN:comg
all others.
If markets are not fully segmented and …rms internalize cross-country price di¤erences when making their pricing decisions, one would expect more frequent price changes for the …rst two categories of books (those in violation of the law of one price). The top half of Table 4 compares the frequencies of price changes using all price quotes. Only results for the …rst and third categories are presented: there are too few books which are cheaper for a Canadian resident to buy from a US retailer (maximum of 164 across pairs). Results are reported for each pair of retailers. In general, it does not seem that deviations from the law of one price make Canadian retailers more likely to change prices. However, there are some intriguing results: Amazon.com implements price changes more often for books which can be found for less in Canada. Yet, the opposite seems to be true for BN.com. In fact, these di¤erences are likely due to the changes in pricing strategies documented in Section 3.. For the books in our dataset, Amazon.com implemented more frequent sales in the second half of the sample while BN.com did the opposite. This is also when the Canadian dollar was at its lowest point against the US dollar. Results from the bottom half of Table 4 are consistent with such bias. Two-week reference prices are constructed and price change
frequencies computed.25 As previously discussed, this is likely to …lter out most temporary sales. The use of reference prices does not alter signi…cantly our ealier conclusions. It does however yield more similar frequencies across categories for the two US retailers.
Table 4: Frequencies of price changes for books in violation of the law of one price. Probability of a price change at t+ 1 conditional on a violation of the law of one price at t. Number of observations are in brackets.
All observations
Amazon.ca Amazon.com Chapters.ca Amazon.com
Cheaper in Canada (U S c o n s u m e r) 1:05% (4458) 7:72% (4458) 0:90% (2672) 9:58% (2672) Others (n o t in v io la t io n o f L O P ) 1:06% (29361) 4:05% (29361) 0:52% (30881) 4:03% (30881)
Amazon.ca BN.com Chapters.ca BN.com
Cheaper in Canada (U S c o n s u m e r) 0:70% (22652) 3:58% (22652) 0:54% (19457) 4:90% (19457) Others (n o t in v io la t io n o f L O P ) 1:78% (11320) 13:59% (11320) 0:58% (14386) 12:51% (14386)
2-week reference prices
Amazon.ca Amazon.com Chapters.ca Amazon.com
Cheaper in Canada (U S c o n s u m e r) 5:22% (670) 11:49% (670) 2:06% (389) 11:83% (389) Others (n o t in v io la t io n o f L O P ) 3:04% (5260) 8:69% (5260) 1:66% (5498) 8:73% (5498)
Amazon.ca BN.com Chapters.ca BN.com
Cheaper in Canada (U S c o n s u m e r) 2:85% (3825) 6:69% (22720) 1:49% (3299) 6:76% (3299) Others (n o t in v io la t io n o f L O P ) 4:03% (2133) 12:80% (2133) 1:93% (2641) 11:36% (2641)
Next, we study more carefully and methodically whether the decision to reset a price is a function of the deviation from the law of one price, controlling for a host of other factors. Unfortunately, the prevalence of temporary sales for some retailers involves a potential bias in the estimation. Consider this simple illustrative example: Amazon.ca normally sells a book for a price 5% higher than in the US, from the perspective of an American consumer. Suppose that it randomly implements one-period, 10% sale on this item, making it 5%
cheaper than in the US. Mechanically, the probability of a price change conditional on being initially in violation of the law of one price is 100%. In this example, the econometrician will mistakenly be led to conclude thatAmazon.ca’s re-pricing decision is sensitive to foreign competition. The bias towards partial market segmentation is similar for US retailers.
To minimize this bias, one could focus on reference prices. However, because of their lower frequency, these series leave us with too few price changes in the sample. Instead, we …lter out temporary sales from our dataset: we drop price changes which are preceded or followed within a given time window (here one week) by another price change of similar magnitude but opposite sign.26 This technique leaves us with enough observations to carry
out the empirical analysis.
Table 5 presents the results for the …rst set of regressions. Here, the question is whether retailers are more likely to change prices for books in deviation from the law of one price. For example, for Amazon.ca, the following relationship is estimated using our dataset:
P PitAM ACA 6= 0 = eP~itAM CA1 <P~itAM U S1 ; log P AM ACA it 1 PCH it 1 ; Xit (2) whereP~AM CA
it 1 =PitAM ACA1 +sAM CA!U S is the price (in domestic currency) of booki sold by Amazon.ca at timetincluding Canada-to-US shipping cost; P~AM U S
it 1 =PitAM AU S1 +sAM U S!U S
is the price of Amazon.com, including domestic shipping. Results are reported based on shipping charges for four-book bundles. We also include the (lagged absolute) price di¤erence with the local competitor to control for repricing due to domestic competition. The controls
Xitj;CA include month dummies, the number of months since …rst publication of book i, one lag of the log price level, as well as lagged Amazon.com sales rankings. Similar regressions
26By similar magnitude, we mean plus-or-minus 10%. Our results are quite robust to the use of wider
time windows or stricter de…nitions of sales. Also, while we report here only results based on the …ltered series, it turns out that conclusions are generally very similar if one instead relies on the raw data.
are also run for US retailers.
Table 5: Law of one price and probability of changing price. Probit regressions. Robust standard errors allowing for correlation within clusters (ISBN) are in brackets. , and indicate signi…cance at the 10, 5 and 1 percent level respectively.
Amazon.ca P PitAM CA 6= 0 Chapters.ca P PitCH 6= 0 (2) (3) (2) (3) eP~itCA1 <P~itAM U S1 0:22 (0:15) (00:12):14 log eP~ CA it 1 ~ PAM U S it 1 0:58 (0:82) 5:41 (2:60) log P AM CA it 1 PCH it 1 1:64 (0:22) 1:(056:39) 1:(003:20) (00::5384) Pseudo-R2 0.15 0.29 0.11 0.12 Obs. 34358 3977 34358 1992 Amazon.com P PAM U S it 6= 0 BN.com P PBN it 6= 0 (2) (3) (2) (3) eP~itAM CA1 <P~itU S1 0:18 (0:07) 0(0:23:07) log eP~ AM CA it 1 ~ PU S it 1 0:18 (0:48) 0:21 (0:40) log P AM U S it 1 PBN it 1 0:70 (0:28) 0:(086:21) 1(0:03:35) 0:48 (0:34) Pseudo-R2 0.07 0.07 0.04 0.03 Obs. 34358 4458 34358 22361
Results from a probit estimation of (2) for each retailer are reported in Table 5. For conciseness, coe¢ cients for the control variables Xit are not reported. Notice that the price
di¤erence between a …rm and its domestic competitor is generally signi…cant and of the right sign, with the exception of BN.com. However, coe¢ cients for the LOP dummy are only marginally signi…cant, if at all. In fact, for Chapters.ca and BN.com, the coe¢ cients are of the wrong sign: for example, Chapters.ca is less likely to reprice a book in violation of the law of one price.
The lack of clear results for regression 2 may be due to the fact that the LOP dummy is correlated with some unobserved characteristic. It could also be that the threshold is wrongly de…ned: for example, a bookseller may only …nd it worthwhile to react to large deviations from LOP. Next, we focus on the instances when there is violation of the law of one price and run the following probit regression, usingAmazon.ca as an example:
P PitAM CA 6= 0 eP~itAM CA1 <P~itAM U S1 = " log e ~ PAM CA it 1 ~ PAM U S it 1 ! ; log P AM CA it 1 PCH it 1 ; Xit # : (3)
In other words, the probability of a price change is estimated as a function of the di¤erence in price with the least expensive foreign competitor, using only the observations for which there is violation of the law of one price. From Table 5, it appears that for most retailers, the decision to reset a price is not signi…cantly a¤ected by the relative prices of foreign competitors. The only exception is Chapters.ca, but the coe¢ cient is of the wrong sign. The marginal e¤ects are also of little economic signi…cance: setting all other independent variables to their mean values, a book which is equally priced atAmazon.comandAmazon.ca
has a 1:2% probability of being repriced in any given period by Amazon.com. If this book becomes 20% cheaper at Amazon.ca, the price change probability only rises to 1:3%.27
Even if the timing of price changes does not seem to be a¤ected by law of one price deviations, this is not necessarily evidence of international market segmentation. For exam-ple, …rms may have time-dependent repricing rules (e.g. review prices once a year), and yet take into account cross-border price di¤erentials when choosing a new price. We study this hypothesis next. The …rst question we aim to answer using our dataset is the following: are books in large violation of the law of one price more likely to be repriced in a direction that
27These price change frequencies are signi…cantly di¤erent than the ones reported in Section 3. for two
restores parity? Once again, due to data availability, the focus is on instances when a US consumer can …nd a book for less in Canada than the US. In these cases, the theoretical model implies that under partial market segmentation, Canadian retailers should have an incentive to increase prices, while US booksellers …nd it optimal to lower theirs in order to remain competitive.
TakingAmazon.com as an example, the following probit regression is run for observations in violation of LOP: P PitAM U S<0 eP~itAM CA1 <P~itAM U S1 = " log e ~ PitAM CA1 ~ PAM U S it 1 ! ;log P AM U S it 1 PBN it 1 ; Xit # : (4)
All variables have been described earlier and Xit includes the same controls as before.
Results presented in Table 6 show that none of the LOP coe¢ cients are signi…cant, except marginally so for Chapters.ca. In fact, for the two US retailers, the e¤ects are of the wrong sign: as a book becomes cheaper in Canada, Amazon.com and BN.com become less likely to decrease that item’s price. Conversely, …rms generally appear to react signi…cantly to domestic competition (note that the price di¤erence between domestic competitors is not expressed in absolute value).
We then turn our attention to another question: conditional on a price being reset, is
Amazon.com more likely to implement a price decrease for a book that initially sells for less in Canada? And vice-versa for Canadian retailers? Speci…cally, the following discrete choice model is estimated using:
P PitAM U S <0 PitAM U S 6= 0 = eP~itCA1 <P~itAM U S1 ;log P AM U S it 1 PBN it 1 ; Xit : (5)
Results in Table 6 show that there is little support for this hypothesis, with the exception of Amazon.com. The LOP indicator is not signi…cant for the three other retailers, and of the wrong sign for Amazon.ca.
Table 6: Law of one price and sign of price change. Probit regressions. Robust standard errors allowing for correlation within clusters (ISBN) are in brackets. , and indicate signi…cance at the 10, 5 and 1 percent level respectively.
P PitCA >0 eP~itCA1 <P~itU S1 P PitCA >0 PitCA 6= 0 Amazon.ca (4) Chapters.ca (4) Amazon.ca (5) Chapters.ca (5) eP~itCA1 <P~itAM U S1 0:59 (0:49) 0:49 (0:39) log eP~ CA it 1 ~ PAM U S it 1 0:67 (0:97) 20(10::7397) log PitAM CA1 PCH it 1 2:85 (0:73) 6:20 (3:08) 5:67 (2:00) 3:01 (1:24) Pseudo-R2 0:37 0:18 0:24 0:51 Obs. 3977 1658 279 195 P PU S it <0 eP~itCA1 <P~itU S1 P PitU S <0 PitU S 6= 0 Amazon.com (4) BN.com (4) Amazon.com (5) BN.com (5) eP~AM CA it 1 <P~itU S1 0:64 (0:20) (00::1434) log eP~itAM CA1 ~ PU S it 1 0:24 (0:45) 0:28 (0:30) log P AM U S it 1 PBN it 1 0:84 (0:19) 0:01 (0:29) 0:39 (0:54) 6(1:97:87) Pseudo-R2 0:05 0:07 0:10 0:59 Obs. 4458 19887 602 305
For the last empirical exercise of this section, we estimate a linear model by using the size of price changes, logPit, as the dependent variable.
logPitAM U S = 0+ 1zitU S1+ 2log P AM U S it 1 PBN +X 0 it +"it (6)
Explanatory variables again include domestic price di¤erentials as well as the usual con-trols. The regressor of interest is a variable zit equal to the cross-border price di¤erential
when a book is in violation of LOP, and zero otherwise:
zit 1 = 8 > < > : log eP~ CA it 1 ~ PU S it 1 if eP~CA it 1 <P~itU S1 0 otherwise:
Here, as in the previous regression, we take as given the timing of …rms’pricing decisions and rely only on observations characterized by a price change.
Once again, it appears di¢ cult to reject the hypothesis of international market segmenta-tion in the context of online bookselling. Based on the results in Table 7, online booksellers do not seem to implement more sizeable price changes for books in large deviation of LOP. In fact, only Amazon.ca exhibits a statistically signi…cant relationship between these two variables, but it is of the wrong sign: a book which already sells for much less than in the US (from the perspective of an American consumer) on average experiences a larger price drop. On the other hand, coe¢ cients on domestic price di¤erentials are more in line with the model predictions and are indicative of market integration at the domestic level.
In general, the results from this section do not allow us to reject the hypothesis of full international market segmentation in the context of online bookselling over our sample period. Yet, the lack of conclusive evidence in favor of partial segmentation could be due to the pervasive price rigidity present in our database: when prices are seldom adjusted to start with, making conclusive conditional statements about variations in price-setting strategies represents a challenge.28
28The lack of price response to exchange rate ‡uctuations is particularly surprising for Canadian retailers:
since most, if not all, of the books in our sample are printed in the US, one may think that exchange rate ‡uctuations would lead to signi…cant marginal cost changes forAmazon.ca andChapters.ca. However,
Table 7: Law of one price and size of price changes. Linear regression (6) using observa-tions characterized by a price change. Robust standard errors allowing for correlation within clusters (ISBN) are in brackets. , and indicate signi…cance at the 10, 5 and 1 percent level respectively.
Amazon.ca Chapters.ca Amazon.com BN.com zit 0:64 (0:13) 3:25 (2:83) 0:14 (0:18) 0:23 (0:14) log P AM CA it 1 PCH it 1 0:54 (0:09) 0:59 (0:35) log P AM U S it 1 PBN it 1 0:25 (0:07) 0:41 (0:13) R2 0:28 0:44 0:28 0:62 Obs. 279 195 602 330
But then, if indeed nominal prices do not react to exchange rate shocks, it must imply that international relative prices are highly volatile. Under partial market segmentation, this in turn should have an impact on quantities. The next section analyzes this issue.
6.1. Ranking analysis
In the previous section, prices were used to test international market segmentation. How-ever, as was already clear from Section 3., this task is complicated by the fact that prices in our online environment are very sticky. If nominal rigidities are indeed very large, it may simply not be worth it for retailers to adjust prices even when markets are in fact integrated. Yet, the model from Section 5. naturally predicts that even if prices do not to adjust to deviations from the law of one price, quantities should: if markets were not fully segmented, variations in the relative price of domestic and foreign retailers would lead to ‡uctuations in quantities sold as consumers switch retailer.29 This is something we aim to test next. rigorously testing this channel requires information on marginal cost, which we do not have.
29This is true under the condition that prices are sticky. For example, consider the case where there is
partial segmentation with the indi¤erent agent in country 1. We are interested in the impact of a change in eonex1
1a2a, holding constantp1a and p2a. Recall from above thatxe11a2a =
p2ae+b1 p1a
2t +
1
Book sales disaggregated at the retailer level are not public information. However, sales rankings are available for all of our retailers except Chapters. Using a few experiments, Chevalier and Golsbee (2003) show that a Pareto relationship approximate