Associations amongst Mental Health Indicators and Adolescent Risk Behaviors: The 2003 North Carolina High School Youth Risk Behavior Survey
Tonya Ann Gscheidle
A dissertation submitted to the faculty of the University of North Carolina at Chapel Hill in partial fulfillment of the requirements for the degree of Doctor of Philosophy in the School of Education (School Psychology).
Chapel Hill 2007
Approved By:
©2007
Abstract
Tonya Ann Gscheidle: Associations amongst Mental Health Indicators and Adolescent Risk Behaviors: The 2003 North Carolina High School Youth Risk Behavior
Survey
(Under the direction of Rune J. Simeonsson and Janey Sturtz McMillen)
Acknowledgements
To complete a project of this magnitude requires a network of support and I am indebted to many people.
I would like to extend special thanks to Dr. Janey Sturtz McMillen who was kind enough to serve as my dissertation committee advisor. Janey guided me through the entire dissertation process, from the conceptualization, to providing me feedback on each chapter of my dissertation as it was written. It was an honor and a privilege to be able to work so closely with such a dedicated researcher. Special thank to Dr. Brad McMillen who was kind and patient enough to guide me through understanding the dataset and my statistical analyses. My doctoral committee is also deserving of recognition and I thank them for their guidance.
I have also had the great opportunity to work with many great mentors in the fields of psychology and education that have contributed to my development as a psychologist. Drs. James Gallagher and Rune Simeonsson of UNC-Chapel Hill and Dr. Connie Wilson of the Dallas Independent School District took me under their wings at different points in my training, answered my never-ending questions, and challenged me to truly think about the hurdles facing the field of school psychology.
Table of Contents
List of Tables………..viii
Chapter I. Review of the Literature………1
Models of Psychopathology and Risk Behavior for Adolescents……….7
Variables Impacting Psychopathology………..9
Mental Health Indicators………..11
Risk Behavior Indicators………..18
Purpose of Study and Research Questions………...…21
II. Research Design & Methodology………23
III. Statistical Analyses & Results………...34
IV. Discussion………66
Appendix...………...80
List of Tables
Table
1.1 Leading Health Indicators of Healthy People 2010………...2 2.1 Research Questions and Methodology………...23 2.2 Sample Size, Response Rates, and Demographics –
National and NC YRBS, 2003……….25 2.3 Descriptions of Variables Selected from the 2003 NC YRBS…………....30 3.1 Response Rates for the 2003 NC YRBS………….……….35 3.2 Logistic Regression Analysis of Suicidal Ideation as
a Function of Gender, Race, and Disability Status………..37 3.3 Logistic Regression Analysis of Depression as
a Function of Gender, Race, and Disability Status………..38 3.4 Logistic Regression Analysis of Self-Esteem as
a Function of Gender, Race, and Disability Status………..40 3.5 Logistic Regression Analysis of Quality of Life as
a Function of Gender, Race, and Disability Status………..42 3.6 Logistic Regression Analysis of Loneliness as
a Function of Gender, Race, and Disability Status………..44 3.7 Logistic Regression Analysis of Stress as
a Function of Gender, Race, and Disability Status………..45 3.8 Logistic Regression Analyses of Drug Use as a
Function of Mental Health Indicators………..………53 3.9 Significant Interactions between Mental Health Indicators and
Gender, Race, and Disability Status as a Function of Violence…………..58 3.10 Significant Interactions between Mental Health Indicators and
Gender, Race and Disability Status as a Function of Alcohol
Use and Abuse……….61 3.11 Significant Interactions between Mental Health Indicators and
3.12 Significant Interactions between Mental Health Indicators and Gender, Race and Disability Status as a Function of Sexual
Behaviors……….64 4.1 Characteristics of Children and Adolescents in the Great
Chapter 1
Review of the Literature
Mental and behavioral disorders can lead to school failure, alcohol use and abuse, substance abuse, violence, or suicide (NASP, 1998). In order to prevent these negative outcomes, it is vitally important for mental health disorders to be identified as early as possible in order to implement effective interventions. Better services and collaboration for children who have mental health needs will result in more positive outcomes for these children and youth such as greater school completion, decreased contact with the juvenile justice system, increased stability in living arrangements, and improved educational, emotional and behavioral development [U.S. Department of Health and Human Services (USDHHS), 2000; Quinn & Poirier, 2004]. Some school districts around the country are turning to school-based mental health services to try and combat these problems (e.g., Casat, Sobolewski, & Gordon, 1999; Flaherty & Weist, 1999; Adelsheim, Carillo, & Colletta, 2001) since comprehensive school-based programs increase the likelihood that at-risk students will stay in school (United States General Accounting Office, 1993).
(Report of the Surgeon General, 1999). Federal regulations also define a sub-population of children and adolescents with more severe functional limitations, known as ‘‘serious emotional disturbance’’ (SED) or behaviorally-emotionally disabled (BED).
Children and adolescents with SED number approximately 5 to 9 percent of children ages 9 to 17. Not all mental disorders identified in childhood and adolescence persist into adulthood, even though the prevalence of mental disorders in children and adolescents is about the same as that for adults (i.e., about 20 percent of each age population). While some disorders do continue into adulthood, a substantial fraction of children and adolescents
recover or ‘‘grow out of’’ a disorder, whereas, a substantial fraction of adults develops mental disorders in adulthood (Report of the Surgeon General, 1999, p. 46).
Thus, the nature and distribution of mental disorders in young people are somewhat different from those of adults. About five percent of children and adolescents are severely impaired by mental, behavioral and emotional disorders. Of young people aged 9 to 17 years who have a mental health disorder, 27 percent receive treatment in the health sector and an additional 20 percent use mental health services in their schools (USDHHS, 2000). One way to improve mental health and access to services is to identify risk-factors that lead to the development of emotional and behavioral problems in students.
The Youth Risk Behavior Surveillance System (YRBSS) is one mechanism that the Centers for Disease Control (CDC) use to evaluate progress toward the Healthy People 2010 leading health indicators (USDHHS, 2000). Those indicators are listed in Table 1.1.
Table 1.1 Leading Health Indicators of Healthy People 2010
10 Leading Health Indicators of Healthy People 2010
• Physical Activity
• Overweight and Obesity • Tobacco Use
• Responsible Sexual Behavior
• Mental Health
• Injury and Violence • Environmental Quality
• Immunization
• Access to Health Care
The Healthy People 2010 objectives provide a comprehensive agenda for improving the health of all persons in the United States during the first decade of the 21st century (Grunbaum,Kann, Kinchen, Ross, Hawkins, Lowry, Harris, McManus, Chyen, & Collins, 2004). State and local agencies and nongovernmental organizations use Youth Risk Behavior Survey (YRBS) data to set health education and health promotion goals, support curricula or program modifications, support legislation that promotes health, and seek funding for new initiatives (Grunbaum et al. 2004). As an example, the CDC uses YRBS data to assess trends in priority health-risk behaviors among high school students (Grunbaum et al., 2004). Each state can also use the data to assess the behavior of their students and then implement programs to prevent engagement in risk behaviors. These risk behaviors include those in the mental health realm, such as experiencing suicidal ideation, stress, loneliness, and depression.
This initiative is focused on promoting healthier student behaviors to support learning in the classroom, using the following eight components:
• Health Education
• Safe Environment
• Mental and Social Health
• Staff Wellness
• Health Services
• Nutrition Services
• Physical Education
• Family Involvement
The mental and social health component of NC Healthy Schools has the overall goal of “promoting provision of adequate resources and service coordination to ensure access by students, families, and staff to mental health services” by addressing the students’
• Acceptance of self
• The ability to express thoughts and feelings in a responsible manner • Understanding and respect for differences in others
• Positive interpersonal relationships • The ability to give and receive support
• Awareness of stresses which interfere with healthy development • Willingness to request assistance when needed
The goals of the eight components of healthy schools are tracked by several databases maintained by NCDPI, including yearly YRBS data (Center for Health and Care in Schools, 2004).
Given the proportion of time children and youth spend attending school, one promising way to address the mental health needs of children and adolescents is through prevention and identification efforts at the local school system level. The National Association of School Psychologists (NASP, 1998) issued a position statement on mental health services in the schools outlining the need for collaboration between home, school, and community to meet the needs of children and adolescents to assure positive academic and behavioral outcomes. Approximately 70% of behaviorally and emotionally disabled (BED) students are performing below grade level, with the extent of academic deficits increasing with age (Knitzer, Steinberg, & Fleisch, 1990). In addition, only one third of high school students classified as BED are able to pass minimum competency exams (Knitzer et al., 1990).
Modern school-based mental health services were conceived in the 1950s with the Primary Mental Health Project (PMHP; Cowen, Hightower, Pedro-Carroll, Work, Wyman, and Haffey, 2003). Prior to the development of the PMHP, mental health services for children and adolescents mirrored that of adults, and were characterized by similar problems of cost, access, and focused on repair or “damage control” rather than prevention. Early services also focused on the most severely disabled children, requiring the most time and resources.
Slowly there was a shift from focusing on treatment of dysfunction to focusing on prevention. Schools were recognized as a key force in child development. According to Cowen et al. (2003), the PMHP was based on the following premise:
Young children, are, relatively speaking, flexible, malleable organisms. Whatever the nature of the difficulties they experience in their early development, those difficulties are less likely, than for older children, to have rooted or fanned out. Thus, the
facilitating qualities of having (a) less crystallized problems; (b) fewer set, maladaptive ways of coping with such problems; and (c) the ability to pick up
flexibly on new learning and alternatives, each characteristic of the young child, made that age group the logical target for informed prevention programming (p. 13).
Thus, school-based mental health services began to take on a prevention approach and focus on risk indicators of children and adolescents, rather than waiting for a serious disorder to develop before beginning treatment.
2004). Research demonstrates that the majority of severe and chronic problem behaviors demonstrated by school-age children and adolescents originate from behavior patterns established in early childhood (Webster-Stratton, 2000). However, current identification and intervention practices are reactive, once behavior problems are established and more difficult to impact (Conroy, Hendrickson, & Hester, 2004).
Rates of emotional and behavioral problems in 2-year olds range from 12% to 16%, with one third of those toddlers demonstrating a significant delay in emotional competence (Webster-Stratton, 2000). It has been estimated that 7-25% of all preschool age children demonstrate significant behavioral difficulties; 24% of children in Head Start have externalizing behavior problems in the clinical or borderline range and 6.5% have internalizing problems such as withdrawal (Webster-Stratton, 2000). Campbell (1994) determined that many children displaying significant problem behaviors in early childhood were at high risk for school failure and for being identified as having emotional or behavioral disorders in school. In fact, Campbell noted that preschool-age children who demonstrate significant problem behaviors have a 50% chance of demonstrating continued problems such as peer rejection, drug abuse, depression, juvenile delinquency, and school dropout during adolescence.
In addition to addressing the mental health needs of students through service
likelihood of indicating they experience loneliness, suicidal ideation, lower self-esteem, and a lower overall quality of life.
Models of Psychopathology and Risk Behaviors for Adolescents
Engel (1983) suggested that illnesses and diseases do not have one major cause but rather are a product of several factors. Specifically, Engel’s framework focused on the biological, psychological, and social factors that influence disease and coined this framework the ‘biopsychosocial model of disease.’ The purpose of the biopsychosocial model is to take a broad view, to assert that simply looking at biological factors alone is not enough.
According to Engel’s model, biopsychosocial factors are involved in the causes,
manifestation, course, and outcome of health and disease, including mental disorders (Report of the Surgeon General, 1999).
One single factor in isolation---biological, psychological, or social---may weigh heavily or hardly at all, depending on the behavioral trait or mental disorder. That is, the relative importance or role of any one factor in causation often varies. But this does not mean that genetic factors completely preordain or fix the nature of the disorder and that psychological and social factors are unimportant. These social factors modify expression and outcome of disorders. The relative roles of biological, psychological, or social factors also may vary across individuals and across stages of the life span. In some people, for example, depression arises primarily as a result of exposure to stressful life events, whereas in others the foremost cause of depression is genetic predisposition (Report of the Surgeon General, 1999, p. 51).
Thus, it is important not to look at one single factor in isolation of the others. Engel’s biopsychosocial model is widely used in the fields of psychology and public health today to explain the effects of psychopathology (or disease) beyond the biological realm and to stress the importance that biology (in the form of the disease or genetics), psychology (in the form of emotional development) and sociology (in the form of secure support networks and family) all influence how the pathology is manifested.
or her emotional development, emphasizing the interpersonal relationships that arise between the child and parents throughout the child’s lifespan (Erikson, 1950).
Erikson conceived of the life course, from birth to old age, as a series of eight epigenetic stages that, proceed in a stepwise fashion, the next dependent upon how well the previous has been mastered: trust versus mistrust; autonomy versus shame and doubt; initiative versus guilt; industry versus inferiority; identity versus role diffusion; intimacy versus isolation; generativity versus stagnation; ego integrity versus despair (Santrock, 2003). Erikson portrayed each stage as a crisis or conflict that needed resolution, either at the time or at a subsequent stage. Each successive stage presents its own challenges but, at the same time, offers the opportunity for correction of unresolved challenges of previous stages. Psychopathology, in the form of a mental disorder, would arise if a stage was ultimately not mastered successfully. The stage that focuses on adolescence (identity vs. identity confusion) centers on the adolescent being able to explore new roles as they head into adulthood. If the adolescent is prohibited from being allowed to explore such roles or is pushed into a role by parents or others, then identity confusion will arise (Santrock, 2003).
Susceptibility Theory. Keilitz & Dunivant (1987) postulated that delinquency can result from ‘‘behaviors that are a direct result of the defining characteristics of the disability. These characteristics (e.g., personality traits, cognitive deficits) lead to a lack of impulse control, suggestibility, and poor perceptions of social cues, which in turn put these children and adolescents at greater risk for delinquent behavior’’ (p. 125). Thus, students with disabilities can be more susceptible to participating in risk behaviors compared to their non-disabled peers because they are looking for ways to fit in with other students.
Variables Impacting Psychopathology
There are a number of factors that may influence or impact psychopathology. The factors examined in this study include gender, race and ethnicity, and whether or not a student reports a disability. Many times these factors overlap (e.g., a student’s race and gender may impact psychopathology) making it difficult to tease out the contribution of individual factors.
Ethnicity. Culture is a critical variable with regard to the individual’s manifestation of symptoms, coping styles, social supports, and use of professional services and the
provider’s delivery of services (Nastasi, Moore, & Varjas, 2004). Mental illness is prevalent across all racial and ethnic groups; prevalence rates among ethnic and minority groups are similar to that of Whites. Exceptions to the above statement include the following two
which minorities seek out mental health care include the stigma of mental illness, mistrust of providers, and miscommunication between patients and providers (Nastasi et al., 2004; Sue & Sue, 1999).
Minorities experience social and economic inequalities (poverty, violence, racism, discrimination) that influence mental health. The most influential of these inequalities is poverty (Nastasi et al., 2004). Poverty is associated with school difficulties (retention, expulsion, dropout), teen pregnancy, low birth weight and infant mortality, lead poisoning, limited educational attainment, poor employment opportunities and unemployment, limited emotional support and cognitive stimulation (Children’s Defense Fund, 2002). In 1999, 16% of children lived in poverty. Approximately 25-50% of behaviorally and emotionally
disabled students live in poverty (Knitzer et al., 1990). Children living in female headed households had a greater likelihood of being poor compared to those living in two parent households. The risk of poverty was also greater for African American and Hispanic children compared to White children (Federal Interagency Forum on Child and Family Statistics, 2001).
anxiety and depression. “Children whose normal functional abilities are limited face the greatest challenges in everyday activities, which in turn increases behavioral, social, and school adjustment difficulties” (Mash & Wolfe, 2002, p. 341). Other studies examining the effects of disability status on overall quality of life will be discussed below.
Mental Health Indicators
As with factors impacting psychopathology discussed above, it can be very difficult to isolate different mental health symptoms or indicators. Students can exhibit multiple symptoms or diagnoses, known as comorbidity. Many symptoms are also related to each other (e.g., depression, loneliness, low self-esteem can cluster together). Listed below is research on the mental heath indicators analyzed in the current study.
Suicide. Suicide is the third leading cause of death for adolescents and young adults (15-24) and the fourth leading cause of death for children 5-14 (NIMH, 1999). The suicide rate has increased by 200 to 300% over the 30 year period from the 1960s to 1990s (Malley, Kush, & Bogo, 1994).
According to 2001 YRBS data, 8.8% of high school students (grades 9-12; N= 13,601; 11.2% female; 6.2% male) reported attempting suicide at least one time during the preceding 12 months while 2.6% of respondents (3.1% female; 2.1% male) reported making a suicide attempt during that same period that resulted in injury, overdose, or poisoning that required medical treatment. Overall, 14.8% of students (17.7% female; 11.8% male) reported serious suicidal ideation (made a specific plan); 19% (23.6% female; 14.2% male) seriously considered attempting suicide and 28.3 % (female students 34.5%; male students 21.6%) reported feeling sad or hopeless enough to discontinue some usual activities (CDC, 2002).
In another study examining the relationship between self-esteem in adolescent boys and girls and participation in risk behaviors, it was found that eighth grade boys reported higher self-esteem than eighth grade girls (Wild, Fisher, Bhana, & Lombard, 2004). When comparing eighth graders to eleventh graders in the study, the authors found that eighth grade girls reported higher self-esteem than eleventh grade girls. Eleventh grade boys also had higher self-esteem on all self-esteem subscales other than school self-esteem when compared to eleventh grade girls. When examining participation in risk behaviors (alcohol use, drug use, sexual behavior, violent behavior, and suicidal ideation), boys in both groups reported engaging in significantly more risk behaviors than girls. Girls, however, were more likely to report suicidal ideation. Overall, the authors found that low global self-worth was
significantly associated with an increased likelihood of suicidality in both sexes, of having been bullied and using alcohol in boys, and with risky sexual behavior in girls (Wild et al., 2004).
Stress. Although daily stressors of an individual may include family, school, or community events, it is the individual’s perception of these events that determines whether it is considered stressful or not. When individuals experience major life stress, such as chronic violence exposure, it is possible that smaller changes in daily life can contribute to
Quality of Life. Life satisfaction or quality of life in adolescents is a complicated concept to measure. ‘‘In effect, life satisfaction reflects both the extent to which basic needs are met and the extent to which a variety of other goals are attainable, with basic needs fulfillment being more central for individuals in less advantaged circumstances’’ (Bradley & Corwyn, 2004, p. 385). Some believe that life satisfaction is likely to emerge as meaningful during adolescence as they learn to assess how their basic needs will be met (Cummins & Nistico, 2002). Although in adults a perceived good quality of life is associated with how the adult feels, life satisfaction in adolescents is thought to be more reflective of both how the adolescent feels and their experiences (Bradley & Corwyn, 2004).
authors hypothesized that this could be due more to social comparison (how one’s income compares to other’s in the same neighborhood) than to absolute income alone. Finally, the authors found no relationship between level of academic competence and overall quality of life.
Adding to the complexity of teasing out factors that contribute to quality of life ratings is how having a physical disability may impact how an adolescent perceives their quality of life. While Bradley and Corwyn (2004) found that health status was positively related to overall life satisfaction, Padua, Rendeli, Ausili, Aprile, Caliandro, Tonali, and Salvaggio (2004) found that ratings of quality of life by adolescents with spina bifida are inversely related to severity of disability. Specifically, the authors found that the less severe the disability, the lower the adolescent rated their quality of life because these adolescents spend more time around healthy people and are more aware of their disability and have greater emotional difficulties trying to ‘‘fit in’’ with their non-disabled peers. Those with greater damage to their lower limb muscles and lower physical quality of life were found to rate themselves as having higher self-esteem and an overall greater quality of life. The authors hypothesize that this is because the more severely disabled adolescents spend most of their time around other disabled peers and are not constantly comparing themselves to non-disabled adolescents and therefore are not as acutely aware of the differences their disability poses. Other studies (e.g., Sawyer, Reynolds, Couper, French, Kennedy, Martin, Staugas, Ziaian, & Baghurst, 2004) have also found that while overall quality of life was rated lower by those who had a chronic illness compared to a community sample, self-ratings of quality of life were not directly related to the severity of the illness.
Brazil, Canada, Italy, and China authors found that different characteristics predicted loneliness for different cultures (Chen, He, DeOliveira, LoCoco, Zappulla, Kaspar,
Schneider, Valdina, Tse, & DeSouza, 2004). Specifically, while sociability was positively associated with loneliness in all four cultures, aggression only indirectly predicted loneliness in Chinese children. Shyness-sensitivity was associated directly with loneliness in Brazilian and Italian children, indirectly in Canadian children, but not at all in Chinese children (Chen et al., 2004). This study illustrates the fact that loneliness and the factors contributing to it may not be universal and that cultural considerations should be taken when assessing loneliness in children.
Studies of loneliness in American adolescents have found links between relational and overt victimization and loneliness. Prinstein, Boergers, & Vernberg (2001) found that adolescents that are overtly and relationally victimized may have more serious risk for poor adjustment than someone who experiences only one form of aggression. Overt victimization is defined as physical actions or threats while relational victimization is spreading rumors or excluding someone from their peer groups (Prinstein et al., 2001). Higher levels of
Violence. There has been increased concern by educators and mental health
practitioners over the impact of school and community violence on children and adolescents. Homicide is the second leading cause of death for adolescents and young adults (ages 15-24 in the United States (Nastasi et al., 2004) and the third leading cause of death among children ages 5 to 14 (Children’s Defense Fund, 1999). In a 1999 study of 94 inner-city adolescents, 93% of respondents reported they had been exposed to at least one community violent event (Mazza & Reynolds, 1999).
Adolescents have also been the perpetrators of violent crime. The rate of serious violent crimes committed by juvenile offenders (ages 12-17) in 1999 was 26 per 1000 (Federal Interagency Forum on Child and Family Statistics, 2001). According to the 2001 High School YRBS data, 33% of students participated in one or more physical fights during the past 12 months and 4% required medical treatment for injuries resulting from those fights (CDC, 2002). Violence exposure has both direct and indirect relationships to a range of mental health difficulties, behavioral problems, and academic struggles. Research has shown that exposure to violence has been identified as the strongest predictor of violence among adolescents (Nastasi et al., 2004).
Research has documented the association among peer victimization, perpetration of violence, and mental health problems. Specifically, peer victimization has been associated with anxiety and depression (Bond, Carlin, Thomas, Rubin, & Patton, 2001). Both
Sourander, Helstela, Helenius, & Piha (2000) found that victims of violence were more likely to experience internalizing problems such as anxiety, depression, and psychosomatic
complaints while those who are bullies experience more externalizing disorders such as oppositional defiant and conduct disorders.
Alcohol Use and Abuse. Alcohol is the most commonly used drug by adolescents, followed by tobacco and marijuana (CDC, 2002). The use of alcohol by adolescents increases with age. For example, Johnston, O’Malley, & Bachman (2001) indicated that 50% of twelfth graders reported using alcohol in the past 30 days compared to 22% of eighth graders. Rates of heavy drinking (at least 5 drinks in a row in a short period of time) also increased with age, with 30% of twelfth graders and 14% of eighth graders reporting they engaged in binge drinking (Johnston et al., 2001). Almost one-third (29%) of the students surveyed in the 2001 High School YRBS study reported that they had consumed alcohol before the age of 13 (CDC, 2002). In a study by the Institute for Community Research (Schensul, 2001), 70% of self-identified drug-using urban adolescents reported that it was easy or very easy to get alcohol in or around school. Alcohol use has been linked to participation in other risk behaviors such as drinking and driving. Sells and Blum (1996) concluded from statistics from the U.S. Department of Transportation that adolescents aged 16 to 20 who were involved in fatal automobile accidents were more likely to have been under the influence of alcohol compared with any other age group.
Drug Use. In a study examining practices of self-identified drug-using urban
behavior of 1494 African American students found that risk factors for marijuana use included age, being hit by a parent, affiliation with gangs, and having a tolerant attitude toward drug use by peers (Wright & Fitzpatrick, 2004). Older students and males were more likely to report marijuana use. Academic achievement and parent monitoring were found to be variables that protected students from drug use with better grades and more parental involvement significantly correlated with fewer reports of marijuana use (Wright & Fitzpatrick, 2004).
Sexual Behavior. Approximately 60% of high school students have engaged in sexual intercourse by the time they reach twelfth grade (CDC, 2002). Rates of pregnancy, birth and abortion among U.S. adolescents are considered to be the highest for industrialized nations (Sells & Blum, 1996). NASP (1997) estimated that almost 1000 adolescents become pregnant every day. In 1999, the birth rate among girls aged 15 to 17 was 29 per 1000 and 88% of those births were to unmarried mothers (Federal Interagency Forum on Child and Family Statistics, 2001). Teen pregnancy is a concern because it can interrupt the mother’s education and have socioeconomic consequences such as being at a higher risk for poverty and unemployment (Federal Interagency Forum on Child and Family Statistics, 2001).
There is also concern about the risk of adolescents acquiring sexually transmitted diseases from sexual behavior. AIDS has been identified at the sixth leading cause of death among those ages 15-24 in the United States, with 20% of all AIDS cases occurring among young adults ages 20-29. Most acquire the disease during adolescence (Sells & Blum, 1996). Sells & Blum identified the leading causes of AIDS transmission for adolescents (ages 13-24) as sexual contact and intravenous drug use.
The above research illustrates how schools can serve as an important resource in identifying students with mental health needs as well as providing services. However, many of those students identified are usually referred for services based on teacher or parent request for formal testing to determine eligibility for special education services (Conroy et al., 2004). This study examined whether intra-individual differences (gender, race, and students with self-reported disabilities) of high school students in North Carolina influence students’ report of mental health indicators such as suicidal ideation, depression, self-esteem, quality of life, loneliness, and stress on a state-wide measure. This study also examined whether students who reported mental health indicators were more likely to self-report engaging in risk behaviors (violence, alcohol use and abuse, drug use, and sexual behaviors). Finally, interactions between those who reported mental health indicators and their specific subpopulations (gender, race, disability status) were analyzed to see if being a member of a subpopulation strengthened the relationship between experience of mental health indicators and engagement in risk behaviors.
The specific questions that were addressed in the current research study are listed below:
1. Do specific student characteristics (gender, race, disability status) predict student report of mental health indicators (suicidal ideation, depression, loneliness, self-esteem, quality of life, stress) on the YRBS?
2. Are students who report experiencing the mental health indicators (suicide,
Chapter 2
Research Design & Methodology
The object of this study was to determine which factors, or combination of factors, best predict experience of mental health indicators on the 2003 Youth Risk Behavior Survey (YRBS). These include intra-individual characteristics, including the ethnicity, gender, and self-report of disability status of the students who completed the YRBS. In addition, this study also examined whether students who reported experiencing the mental health indicators on the YRBS also reported engaging in other risk behaviors such as violence, alcohol use, drug use and sexual behaviors. Many of these factors are interrelated and the use of direct logistic regression analyses discussed below was designed to attempt to parse out the predictive ability of each of the variables. Table 2.1 describes the methodology used to answer each research question.
Table 2.1. Research Questions and Methodology
Research Question Participants Instrument Data Analysis 1. Do specific
student
characteristics (gender, race, disability status) predict self-report of mental health
indicators (suicidal ideation, depression, loneliness, self-esteem, quality of life, stress) on the YRBS?
Students who completed 2003 NC HS YRBS
2003 NC High School YRBS
2. Are students who report experiencing the mental health indicators
(depression, loneliness, self-esteem, stress) more likely to report engaging in risk behaviors (violence, alcohol use and abuse, drug use, sexual behavior)?
Students who completed 2003 NC HS YRBS
2003 NC High School YRBS
Direct Logistic Regression
3. Does being a member of a sub-population who also self-reported mental health indicators predict engagement in risk behaviors?
Students who completed 2003 NC HS YRBS
2003 NC High School YRBS
Heirarchical Logistic Regression
Participants
The participants for the 2003 NC High School YRBS were selected using a two-stage process. The process used for the NC YRBS by the State Department of Public Instruction is the same process used nationally and set forth by the Centers for Disease Control
(Grunbaum, et al., 2004; McMillen, 2004). McMillen (2004) has documented the process used to collect the 2003 NC YRBS data. First, all regular public high schools containing students in grades 9, 10, 11, or 12 were included in the sample. Schools were selected systematically with probability proportional to enrollment in grades 9-12 using a random start. Overall, 72 schools were sampled and 51 of those schools participated (73%). Within those sampled schools, all classes in a required subject or all classes meeting during a particular period of the day, depending on the school, were included in the sample.
each school that participated in the survey. Overall, 2,553 of the 3,108 sampled students (83%) completed useable questionnaires and were representative of all students in grades 9-12; males made up 48.6% of students while females comprised 51.4% of the students who participated. The students surveyed in NC were comparable to the overall national sample (see Table 2.2).
Table 2.2. Sample Size, Response Rates, and Demographics – National and NC YRBS,
2003
National North Carolina
Sample Size 15,214 2,553
Overall Response Rate 67% 61%
Student 83% 83%
School 81% 71%
Male Female Male Female
Gender
48.6% 51.4% 49.5% 50.5%
W AA H O W AA H O
Race/Ethnicity
61.4% 29.4% 16.6% 8.2% 63.8% 29.4% 2.3% 4.5% Self-Reported
Disability
Not Measured 25.9%
W = White/Caucasian
AA= Black/African American H = Hispanic
O = Other
were impaired in any activities resulting from a health problem or impairment. The third asked if the students had any difficulties learning, remembering, or concentrating due to an impairment or health problem. The choice options for these questions included “Yes,” “No,” or “Not Sure.” Each option was converted into a dichotomous variable (yes/no) and then the three questions were collapsed into a single variable. Those students endorsing “Yes” to any of the three disability indicators were included in the subgroup of students with a disability. Those who responded “Not Sure” were coded as not having a disability for the purpose of this study. Note that students who self-reported disability in the above areas may or may not be also identified as having a disability as defined by federal guidelines. This study only focuses on students with self-perceived disabilities rather than those disabilities that are formally diagnosed.
Race. Students were directed to choose one or more of the following responses to describe themselves: “American Indian or Alaska Native;” “Asian,” “Black or African American,” “Hispanic or Latino,” “Native Hawaiian or Other Pacific Islander, and “White.” Those choosing more than one response were coded as being “Multi-racial, Hispanic” or “Multi-racial – Non-Hispanic.” The responses from this question were recoded to allow for four categories: African American, Hispanic, White, and Other. Students were coded as “other” if they stated they were either American Indian or Alaska Native, Asian, Native Hawaiian or Pacific Islander, or Multi-racial.
Measure
The YRBS is one component of the Youth Risk Behavior Surveillance System developed by the Centers for Disease Control and Prevention in collaboration with
agencies, and national education and health organizations (Grunbaum et al., 2004). The Youth Risk Behavior Surveillance System was designed to focus the nation on behaviors among youth related to the leading causes of mortality and morbidity among both youth and adults and to assess how these risk behaviors change over time. The Youth Risk Behavior Surveillance System measures behaviors that fall into six categories:
1. Behaviors that result in unintentional injuries and violence; 2. Tobacco use;
3. Alcohol and other drug use;
4. Sexual behaviors that result in HIV infection, other sexually transmitted diseases, and unintended pregnancies;
5. Dietary behaviors; and 6. Physical activity.
Students completed a self-administered, anonymous, 93-item questionnaire. Previous versions of this instrument have shown moderate (kappa value > 41%) to substantial (kappa value > 61%) test-retest reliability (Brener, Kann, McManus, Kinchen, Sundberg, & Ross, 2002). Specific questions that are the focus of this study (unintentional injury and violence, alcohol and other drug use, and sexual behaviors that result in HIV infection, other sexually transmitted diseases, and unintended pregnancies) have collectively shown a mean kappa value in the moderate range (Brener et al., 2002). A copy of the specific questions selected from the 2003 NC High School YRBS can be found in Appendix A.
Mental Health Indicators.
one single area. The first part of this study focused on using parts of the NC High School YRBS to answer the research questions; specifically demographic variables (e.g., gender, race) as well as questions asking about mental health experiences (e.g., suicidal ideation). Questions that served as the ‘mental health indicators’ asked participants to self-report
mental health experiences that involve feelings about suicide, depression, self-esteem, quality of life, feeling alone, and stress levels. A total of six questions served as mental health indicator questions on the YRBS. The responses to each question were recoded to be dichotomous and each mental health indicator was analyzed separately. Table 2.3 summarizes how each variable was coded.
Suicidal Ideation. The question on the YRBS that assesses suicidal ideation asks “During the past 12 months, did you ever seriously consider attempting suicide?”
Depression. Students were asked, “During the past 12 months did you ever feel so sad or hopeless almost every day for two weeks or more in a row that you stopped doing some usual activities?”
Self-esteem. Students were asked to indicate their response to the statement “I feel good about myself” by choosing one of five response choices ranging from “Strongly disagree” to “Strongly agree.”
Quality of Life. Participants were asked to respond to the statement “In general, how would you rate the quality of your life” by choosing one of five response choices ranging from “Poor” to “Excellent.”
Stress. The item assessing stress asked students, “How often do you feel stress in your life?” Students chose one of five response options ranging from “Never” to “All of the time.”
Risk Behavior Indicators.
Questions that served as ‘risk behavior indicators’ asked participants to self-report risk behaviors in the areas of violence, drug and alcohol use and abuse, and sexual behaviors. Each group of risk indicators (violence, drug use, alcohol use and abuse, and sexual
behaviors) was analyzed separately. The responses to the questions in each group were recoded to be dichotomous (those who engaged in the activity vs. those who did not). Table 2.3 summarizes how each variable was coded.
Violence. A total of five questions were analyzed to examine violence-related behaviors. Specific violent behaviors included carrying a weapon on school property, not attending school due to feelings of being unsafe, being threatened or injured with a weapon on school property, having property deliberately damaged or stolen while at school, and participating in a physical fight on school property. Each question was analyzed
individually. Students who reported that they carried a weapon or participated in a physical fight on school property at least one time in the past 30 days (weapon) or 12 months
Alcohol Use and Abuse. A total of two questions on the YRBS were used to examine alcohol use and abuse. The first question asked students to self-report how many days they have had at least one drink of alcohol in the past 30 days. The second question asked on how many days did students drink five or more drinks in a row over a couple of hours in the last 30 days. These questions were analyzed separately.
Drug Use. A total of eight questions on the YRBS were used to examine drug use. These questions asked students to self-report how many times, in their lifetime, did they use marijuana, cocaine, ecstasy, hallucinogens (such as LSD or PCP), heroin,
methamphetamines, sniffed glue or inhalants, or taken steroid pills or shots. Responses to these questions were combined for the purpose of analysis; students who reported that they used at least one of the drugs listed above at least once in their lifetime were coded as engaging in drug behavior.
Sexual Behavior. A total of two questions on the YRBS were used to examine sexual behaviors. These questions asked whether or not adolescents ever had sexual intercourse and whether or not alcohol or drugs were used before the last time students engaged in sexual intercourse. Each question was analyzed separately.
Table 2.3. Descriptions of Variables Selected from the 2003 NC YRBS.
Variable Item Format Variable as used in Analyses
Mental Health Indicators
Suicidal Ideation Yes/No 1 = Yes
0 = No
Depression Yes/No 1 = Yes
0 = No Self-Esteem 5 options ranging from
“Strongly Disagree” to “Strongly Agree”
1 = Agree, Strongly Agree 0 = Strongly Disagree,
“Poor” to “Excellent” Excellent 0 = Fair, Poor
Loneliness 5 options ranging from
“Strongly Disagree” to “Strongly Agree”
1 = Agree, Strongly Agree 0 = Strongly Disagree,
Disagree, Not Sure
Stress 5 options ranging from
“Never” to “All of the Time”
1 = Most of the Time or All of the Time
0 = Never, Rarely, Sometimes Risk Behavior Indicators
Violence
Carrying a Weapon 5 options ranging from 0 days to 6 or more days
1 = Yes, at least one day 0 = No or 0 days
Physical Fight 8 options ranging from 0 times to 12 or more times
1 = Yes, at least one time 0 = No, not one time Felt Unsafe 5 options ranging from 0
days to 6 or more days
1 = Yes, at least one day 0 = No or 0 days
Threatened 8 options ranging from 0 times to 12 or more times
1 = Yes, at least one time 0 = No, not one time Property
Stolen/Damaged
8 options ranging from 0 times to 12 or more times
1 = Yes, at least one time 0 = No, not one time Alcohol
Use Alcohol in Past 30 Days
7 options ranging from 0 days to all 30 days
1 = Yes, at least one day 0 = No or 0 days
Had 5 or More Drinks In Short Period of Time
7 options ranging from 0 days to 20 or more days
1 = Yes, at least one day 0 = No or 0 days
Drug Use 8 Items with multiple
scales
1= Yes, at least one time on any of 8 items
0 = No, 0 times on all of 8 items
Sexual Behavior Ever had Sexual Intercourse
Yes/No 1 = Yes
0 = No Used Drugs or Alcohol
Prior to Last Sexual Intercourse
Never Had Sex, Yes, No 1 = Yes
0 = Never Had Sex, No
Procedure
from education and health agencies at the state and local levels to administer the survey in these 51 schools. Information on standardized survey administration procedures, as well as sets of materials for administering the survey, were disseminated at regional training sessions held by staff from the North Carolina Department of Public Instruction (McMillen, 2004). Administrators then made arrangements with each school to conduct the surveys between February and April 2003.Students completed the self-administered questionnaire during one class period and recorded their responses directly onto a computer-scannable questionnaire booklet or answer sheet (McMillen, 2004). The core national questionnaire contained 87 multiple-choice questions. To meet individual needs, 21 states and 12 cities added or deleted questions, including North Carolina (Grunbaum et al., 2004). Survey procedures were designed to protect the privacy of students by allowing for anonymous and voluntary participation. Before the survey was conducted, parental permission procedures were followed in each school district as per their individual requirements (McMillen, 2004).
Statistical Analyses
The variables taken from the YRBS were used to define group membership; that is, whether or not a student self-reports that they belong in a group defined by mental health difficulties. The independent variables used to predict group membership were gender of the student, ethnicity of the student, and whether or not a student self-identified as having a disability by endorsing one of the three disability indicators on the YRBS. The second research question also focused on group membership; that is whether or not a student who reported experiencing mental health indicators predicted those who also reported
experience of the mental health indicator questions on the YRBS. Logistic regression analyses were also used to examine whether or not students who reported experiencing the mental health indicators were more likely to experience other risk behaviors. “Logistic regression allows one to predict a discrete outcome such as group membership from a set of variables that may be continuous, discrete, dichotomous, or a mix” (Tabachnick & Fidell, 2001, p.571).
Chapter 3
Results
Prior to examining the results to the individual research questions, descriptive
statistics were run to show response rate by demographics to each indicator. Those results are displayed in Table 3.1.
Question #1: Do specific student characteristics (gender, race, disability status) predict student report of mental health indicators (suicidal ideation, depression, loneliness, self-esteem, quality of life, stress) on the YRBS?
All analyses were conducted using SPSS Logistic Regression. Direct logistic regression analyses were performed individually on all mental health indicators as an outcome variable and three predictors: gender, race, and self-report of disability. All data were screened for multicollinearity and for outliers in the solution. No problems with convergence were noted in any of the analyses below and tests of model fit were adequate. Mental Health Indicators
Suicidal Ideation. Overall, 18.1% of the participants stated that they seriously considered suicide in the past 12 months. Data from 2467 students were available for
Table 3.1. Response Rates for the 2003 NC High School YRBS
Variable Overall Male Female White African American Hispanic Other Mental Health Indicators Suicidal Ideation
18.1% 14.3% 21.8% 20.1% 13.4% 17.4% 19.1%
Depression 29.3% 20.8% 38.0% 28.8% 30.3% 27.5% 30.4%
Self-Esteem 76.4% 79.1% 73.8% 76.8% 76.9% 75.6% 70.5%
Quality of Life 83.7% 83.6% 83.8% 85.4% 80.8% 84.2% 80.8%
Loneliness 14.9% 12.5% 17.2% 14.8% 14.6% 18.4% 15.0%
Stress 37.8% 28.5% 47.2% 41.9% 30.6% 28.1% 30.1%
Risk Behavior Indicators
Violence Carrying a Weapon
6.3% 8.3% 4.4% 6.1% 6.3% 5.4% 8.3%
Physical Fight 10.7% 14.5% 6.9% 8.2% 15.7% 13.6% 10.2%
Felt Unsafe 5.2% 6.1% 4.3% 3.2% 8.3% 7.8% 11.8%
Threatened 7.2% 8.2% 6.1% 6.7% 7.3% 6.9% 12.7%
Property
Stolen/Damaged
26.0% 26.6% 25.2% 25.6% 25.9% 23.5% 30.1%
Alcohol
Use Alcohol in Past 30 Days
39.4% 41.5% 37.3% 43.6% 30.3% 33.0% 40.0%
Had 5 or More Drinks in Short Period of Time
21.0% 25.1% 16.7% 25.6% 10.3% 19.9% 22.8%
Drug Use 12.6% 13.4% 11.7% 13.7% 9.6% 9.8% 15.0%
Sexual Behavior Ever had Sexual Intercourse
52.5% 51.4% 53.7% 44.1% 52.8% 50.2% 53.5%
Used Drugs or Alcohol Prior to Last Sexual Intercourse
18.1% 22.1% 14.5% 20.6% 14.7% Less
than 1%
measures goodness of fit of the data, was not significant 2(6, N = 2467) = 2.66, p = .75). The nonsignificant chi-square produced from the Hosmer and Lemeshow test indicates that the predicted values are a good fit compared to the observed data (Tabachnick & Fidell, 2001). It is important to note that the Hosmer-Lemeshow test is not intended to measure outcome or model specification, rather it is useful in determining whether the data are appropriate to use in logistic regression analyses. The data is statistically appropriate for analyses when a nonsignificant chi-square result is achieved. The variance in suicidal ideation accounted for is small, with Nagelkerke’s R2= 0.10.
The model successfully predicted 100% of the students who did not report
experiencing suicidal ideation, but did not predict any of the students who did report having suicidal thoughts, for an overall success rate of 80.8%. However, this success rate of
prediction is not any better than what would be predicted by chance alone. Although the full model was statistically different from the constant-only model, it did not improve overall classification of the students.
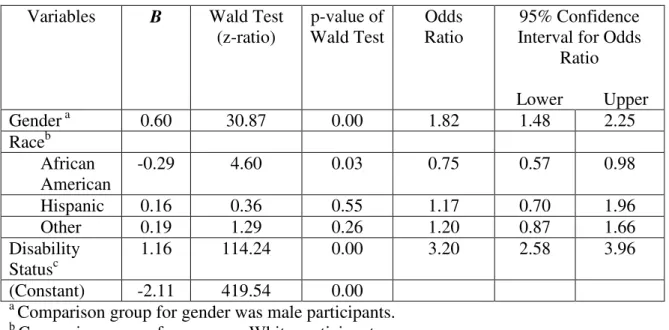
Table 3.2. Logistic Regression Analysis of Suicidal Ideation as a Function of Gender,
Race, and Disability Status (N=2467).
Variables B Wald Test
(z-ratio) p-value of Wald Test Odds Ratio 95% Confidence Interval for Odds
Ratio
Lower Upper
Gendera 0.60 30.87 0.00 1.82 1.48 2.25
Raceb African American
-0.29 4.60 0.03 0.75 0.57 0.98
Hispanic 0.16 0.36 0.55 1.17 0.70 1.96
Other 0.19 1.29 0.26 1.20 0.87 1.66
Disability Statusc
1.16 114.24 0.00 3.20 2.58 3.96
(Constant) -2.11 419.54 0.00
a
Comparison group for gender was male participants. b
Comparison group for race was White participants. c
Comparison group for disability status was non-disabled students
Depression. Overall, 29.3% of the participants stated they did feel sad or hopeless. Data from 2494 students were available for analysis. A test of the full model with all three predictors against a constant-only model was statistically reliable 2 (5, N = 2494) = 207.80, p < .001, indicating that the predictors, as a set, reliably distinguished between students who report feeling sad or hopeless and those who did not. Results of the Hosmer and Lemeshow test, which measures goodness of fit of the data, was not significant 2(6, N = 2494) = 1.95, p = .86). The nonsignificant chi-square produced from the Hosmer and Lemeshow test
are appropriate to use in logistic regression analyses. The data is statistically appropriate for analyses when a nonsignificant chi-square result is achieved. The variance that feeling sad or hopeless accounted for is small, with Nagelkerke’s R2= 0.11. The model successfully
predicted 92.1% of the students who did not report experiencing sad and hopeless feelings and 26.3% of the students who did report feeling depressed, for an overall success rate of 71.7%.
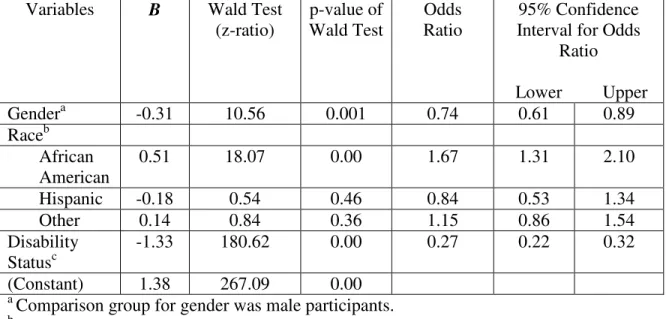
Table 3.3 shows regression coefficients, Wald statistics, p-values for the Wald statistics, odds ratios, and 95% confidence intervals for odds ratios for each of the three predictors. According to the Wald criterion, gender (z = 72.23, p < .001) and disability status (z = 124.03, p < .001) reliably predicted whether or not a student reported feeling sad or hopeless. Females were 2.18 times more likely to report feelings of depression compared to males. Students who self-reported having a disability were 2.96 times more likely to report feeling sad or hopeless compared to their non-disabled peers.
Table 3.3. Logistic Regression Analysis of Depression as a Function of Gender, Race,
and Disability Status (N=2494).
a
Comparison group for gender was male participants. b
Comparison group for race was White participants.
Variables B Wald Test
(z-ratio) p-value of Wald Test Odds Ratio 95% Confidence Interval for Odds
Ratio
Lower Upper
Gendera 0.78 72.22 0.00 2.18 1.82 2.61
Raceb African American
-0.92 0.70 0.41 0.91 0.74 1.13
Hispanic 0.44 3.59 0.06 1.55 0.99 2.43
Other 0.20 1.96 0.16 1.22 0.92 1.62
Disability Statusc
1.09 124.03 0.00 2.96 2.45 3.59
c
Comparison group for disability status was non-disabled students
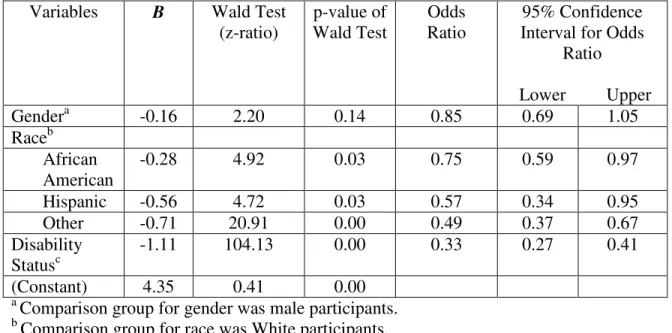
Self-esteem. Overall, 76.4% of the participants stated that they agreed or strongly agreed with the statement, “I feel good about myself.” After deletion of 65 cases with missing values on the variables analyzed, data from 2488 students were available for
analysis. A test of the full model with all three predictors against a constant-only model was statistically reliable 2(5, N = 2488) = 216.15, p < .001, indicating that the predictors, as a set, reliably distinguished between students who reported having self-esteem and those who did not. Results of the Hosmer and Lemeshow test, which measures goodness of fit of the data, were not significant 2(6, N = 2488) = 2.85, p = .83). The nonsignificant chi-square produced from the Hosmer and Lemeshow test indicates that predicted values are a good fit compared to the observed data (Tabachnick & Fidell, 2001). It is important to note that the Hosmer-Lemeshow test is not intended to measure outcome or model specification, rather it is useful in determining whether the data are appropriate to use in logistic regression
analyses. The data is statistically appropriate for analyses when a nonsignificant chi-square result is achieved. The variance in self-esteem accounted for is small, with Nagelkerke’s R2 = 0.12. The model successfully predicted 93.2% of the students who reported they felt good about themselves and 21.1% of students who stated they had lower self-esteem, for an overall success rate of 72.9%.
about themselves compared to males, while African American students were 1.67 times more likely to respond that they did feel good about themselves compared to White students. Students with a reported disability were 73% less likely to state that they had high self-esteem.
Table 3.4. Logistic Regression Analysis of Self-Esteem as a Function of Gender, Race,
and Disability Status (N=2488).
Variables B Wald Test
(z-ratio) p-value of Wald Test Odds Ratio 95% Confidence Interval for Odds
Ratio
Lower Upper
Gendera -0.31 10.56 0.001 0.74 0.61 0.89
Raceb African American
0.51 18.07 0.00 1.67 1.31 2.10
Hispanic -0.18 0.54 0.46 0.84 0.53 1.34
Other 0.14 0.84 0.36 1.15 0.86 1.54
Disability Statusc
-1.33 180.62 0.00 0.27 0.22 0.32
(Constant) 1.38 267.09 0.00
a
Comparison group for gender was male participants. b
Comparison group for race was White participants. c
Comparison group for disability status was non-disabled students
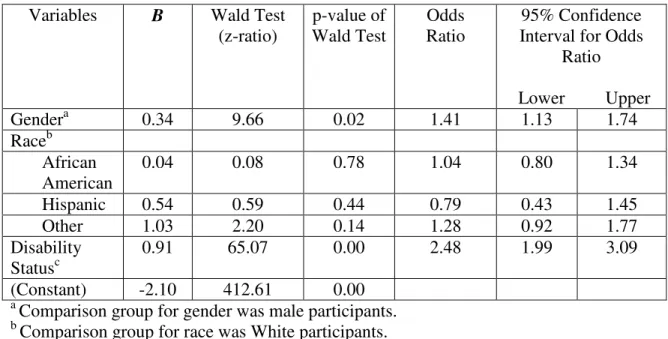
p = .85). The nonsignificant chi-square produced from the Hosmer and Lemeshow test indicates that the predicted values are a good fit compared to the observed data (Tabachnick & Fidell, 2001). It is important to note that the Hosmer-Lemeshow test is not intended to measure outcome or model specification, rather it is useful in determining whether the data are appropriate to use in logistic regression analyses. The data is statistically appropriate for analyses when a nonsignificant chi-square result is achieved. The variance quality of life accounted for is small, with Nagelkerke’s R2= 0.08. The model successfully predicted 100% of the students who reported a good or better quality of life and none of the students who stated they did not have a good quality of life, for an overall success rate of 81.4%.
However, this success rate of prediction is not any better than what would be predicted by chance alone. Although the full model was statistically different from the constant-only model, it did not improve overall classification of the students.
Table 3.5. Logistic Regression Analysis of Quality of Life as a Function of Gender,
Race, and Disability Status (N=2491).
Variables B Wald Test
(z-ratio) p-value of Wald Test Odds Ratio 95% Confidence Interval for Odds
Ratio
Lower Upper
Gendera -0.16 2.20 0.14 0.85 0.69 1.05
Raceb African American
-0.28 4.92 0.03 0.75 0.59 0.97
Hispanic -0.56 4.72 0.03 0.57 0.34 0.95
Other -0.71 20.91 0.00 0.49 0.37 0.67
Disability Statusc
-1.11 104.13 0.00 0.33 0.27 0.41
(Constant) 4.35 0.41 0.00
a
Comparison group for gender was male participants. b
Comparison group for race was White participants. c
Comparison group for disability status was non-disabled students
Loneliness. Overall, 14.9% of students indicated they agreed or strongly agreed with the statement “I feel alone in my life.” After deletion of 54 cases with missing values on the variables analyzed, data from 2499 students were available for analysis. A test of the full model with all three predictors against a constant-only model was statistically reliable 2(5, N = 2499) = 76.05, p < .001, indicating the predictors, as a set, reliably distinguished
whether the data are appropriate to use in logistic regression analyses. The data is statistically appropriate for analyses when a nonsignificant chi-square result is achieved. The variance that feeling lonely accounted for is small, with Nagelkerke’s R2= 0.05. The model
successfully predicted 100% of the students who did not report experiencing sad and hopeless feelings and none of the students who did report feeling lonely, for an overall success rate of 83.2%. However, this success rate of prediction is not any better than what would be predicted by chance alone. Although the full model was statistically different from the constant-only model, it did not improve overall classification of the students.
Table 3.6 shows regression coefficients, Wald statistics, p-values for the Wald statistics, odds ratios, and 95% confidence intervals for odds ratios for each of the three predictors. According to the Wald criterion, gender (z = 9.66, p < .01) and disability status (z = 65.07, p < .001) reliably predicted feeling lonely. Female students were 1.41 times more likely to report they felt lonely compared to their male cohort, while students with self-reported disabilities were 2.48 times more likely to report loneliness compared to their non-disabled peers.
Table 3.6. Logistic Regression Analysis of Loneliness as a Function of Gender, Race,
and Disability Status (N=2499).
a
Comparison group for gender was male participants. b
Comparison group for race was White participants. c
Comparison group for disability status was non-disabled students
measures goodness of fit of the data, were not significant 2(6, N = 2503) = 0.89, p = .99). The nonsignificant chi-square produced from the Hosmer and Lemeshow test indicates the predicted values are a good fit compared to the observed data (Tabachnick & Fidell, 2001). It is important to note that the Hosmer-Lemeshow test is not intended to measure outcome or model specification, rather it is useful in determining whether the data are appropriate to use in logistic regression analyses. The data is statistically appropriate for analyses when a nonsignificant chi-square result is achieved. The variance that feeling stress accounted for is small, with Nagelkerke’s R2= 0.13. The model successfully predicted 92.2% of the students who did not report experiencing stress and 23.3% of the students who did report feeling stress, for an overall success rate of 66.9%.
Variables B Wald Test
(z-ratio) p-value of Wald Test Odds Ratio 95% Confidence Interval for Odds
Ratio
Lower Upper
Gendera 0.34 9.66 0.02 1.41 1.13 1.74
Raceb African American
0.04 0.08 0.78 1.04 0.80 1.34
Hispanic 0.54 0.59 0.44 0.79 0.43 1.45
Other 1.03 2.20 0.14 1.28 0.92 1.77
Disability Statusc
0.91 65.07 0.00 2.48 1.99 3.09
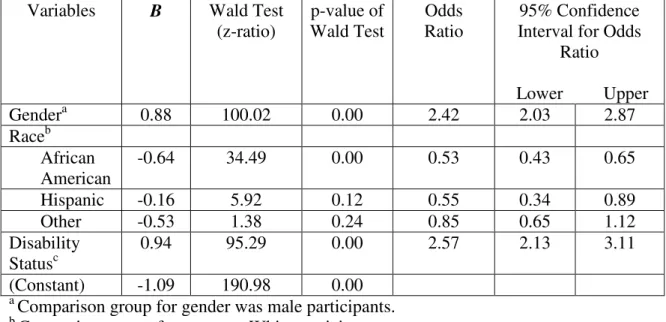
Table 3.7 shows regression coefficients, Wald statistics, p-values for the Wald statistics, odds ratios, and 95% confidence intervals for odds ratios for each of the three predictors. According to the Wald criterion, gender, race, and disability status all reliably predicted feeling stress. Females were 2.42 times as likely to report feeling stress compared to males. African American students were 47% less likely to report feeling stress compared to their white peers. Students who self-reported having a disability were 2.57 times more likely to report feeling stress compared to their non-disabled peers.
Table 3.7. Logistic Regression Analysis of Stress as a Function of Gender, Race, and
Disability Status (N=2503).
Variables B Wald Test
(z-ratio) p-value of Wald Test Odds Ratio 95% Confidence Interval for Odds
Ratio
Lower Upper
Gendera 0.88 100.02 0.00 2.42 2.03 2.87
Raceb African American
-0.64 34.49 0.00 0.53 0.43 0.65
Hispanic -0.16 5.92 0.12 0.55 0.34 0.89
Other -0.53 1.38 0.24 0.85 0.65 1.12
Disability Statusc
0.94 95.29 0.00 2.57 2.13 3.11
(Constant) -1.09 190.98 0.00
a
Comparison group for gender was male participants. b
Comparison group for race was White participants. c
Comparison group for disability status was non-disabled students
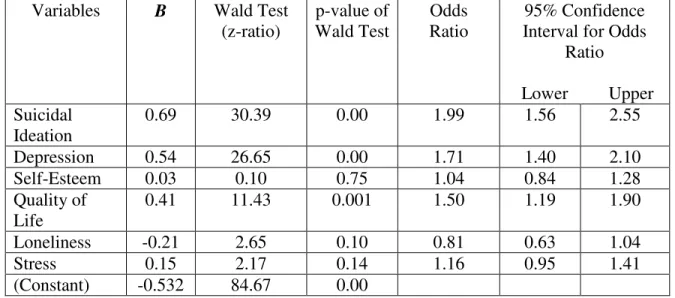
All analyses were conducted using SPSS Logistic Regression. Direct logistic regression analyses were performed individually on all risk behavior indicators as an
outcome variable and six predictors: suicidal ideation, depression, self-esteem, quality of life, loneliness, and stress. All data was screened for multicollinearity and for outliers in the solution. No problems with convergence were noted in any of the analyses below and tests of model fit were adequate.
Risk Behavior Indicators
statistically different from the constant-only model, it did not improve overall classification of the students.
According to the Wald criterion, suicidal ideation (z = 10.68, p = .001) and quality of life (z = 9.89, p < .01) reliably predicted whether or not a student reported participation in a physical fight. Specifically, students who reported engaging in suicidal ideation were 1.8 times and students who reported having a fair or poor quality of life were 1.7 times more likely to report being in a physical fight than peers in their comparison groups.
Students were also asked whether or not they carried a weapon on school property in the past 12 months. The percentage of students who stated they did carry a weapon was 6.3%. Data from 2400 students were available for analysis. A test of the full model with all six predictors against a constant-only model was statistically reliable 2(6, N = 2400) = 36.22, p < .001, indicating the predictors, as a set, reliably distinguished between students who reported carrying a weapon on school property within the past 12 months and those who have not. Results of the Hosmer and Lemeshow test, which measures goodness of fit of the data, were not significant 2(5, N = 2400) = 5.33, p = .38). The variance accounted for is small, with Nagelkerke’s R2= 0.04. The model successfully predicted 100% of the students who did not report carrying a weapon but did not predict any of the students who did
participate, for an overall success rate of 93.4%. However, this success rate of prediction is not any better than what would be predicted by chance alone. Although the full model was statistically different from the constant-only model, it did not improve overall classification of the students.
school. Specifically, students who experienced feelings of suicidal ideation were 1.8 times and students who reported feeling sad or hopeless were 1.7 times more likely to report bringing a weapon to school than peers in their comparison groups.
The next set of questions asked students about being a victim of violent acts. The first question asked students whether or not they felt unsafe at school or walking to and from school in the past 30 days. Overall, 5.2% of students reported feeling unsafe at least one day. Data from 2419 students were available for analysis. A test of the full model with all six predictors against a constant-only model was statistically reliable 2(6, N = 2419) = 67.46, p < .001, indicating the predictors, as a set, reliably distinguished between students who
reported feeling unsafe at school within the past 12 months and those who did not. Results of the Hosmer and Lemeshow test, which measures goodness of fit of the data, were not
significant 2(6, N = 2419) = 4.21, p = .65). The variance accounted for is small, with
Nagelkerke’s R2= 0.09. The model successfully predicted 100% of the students who did not report feeling unsafe but did not predict any of the students who did feel unsafe, for an overall success rate of 95.5%. However, this success rate of prediction is not any better than what would be predicted by chance alone. Although the full model was statistically different from the constant-only model, it did not improve overall classification of the students.
Students were also asked how many times they were threatened or injured with a weapon on school property in the past 12 months. A total of 7.2% of the students responded they had felt threatened. Data from 2409 students were available for analysis. A test of the full model with all six predictors against a constant-only model was statistically reliable 2(6, N = 2409) = 87.20, p < .001, indicating the predictors, as a set, reliably distinguished
between students who reported feeling threatened at school within the past 12 months and those who did not. Results of the Hosmer and Lemeshow test, which measures goodness of fit of the data, were not significant 2(5, N = 2409) = 6.74, p = .24). The variance accounted for is small, with Nagelkerke’s R2= 0.09. The model successfully predicted 100% of the students who did not report feeling threatened but did not predict any of the students who did feel unsafe, for an overall success rate of 92.2%. However, this success rate of prediction is not any better than what would be predicted by chance alone. Although the full model was statistically different from the constant-only model, it did not improve overall classification of the students.
According to the Wald criterion, suicidal ideation (z = 16.68, p < .001), depression (z = 9.58, p < .01) and quality of life (z = 8.45, p < .01) reliably predicted whether or not a student reported feeling threatened at school. Students who reported experiencing suicidal ideation were 2.2 times more likely, those feeling sad or hopeless were 1.8 times more likely, while students describing their quality of life as fair or poor were 1.7 times more likely to report feeling threatened.
test of the full model with all six predictors against a constant-only model was statistically reliable 2(6, N = 2418) = 51.03, p < .001, indicating the predictors, as a set, reliably
distinguished between students who reported having their property stolen at school within the past 12 months and those who did not. Results of the Hosmer and Lemeshow test, which measures goodness of fit of the data, were not significant 2(5, N = 2418) = 3.98, p = .55). The variance accounted for is small, with Nagelkerke’s R2= 0.03. The model successfully predicted 100% of the students who did not report having their property damaged or stolen, but did not predict any of the students who did have property damaged or stolen, for an overall success rate of 73.7%. However, this success rate of prediction is not any better than what would be predicted by chance alone. Although the full model was statistically different from the constant-only model, it did not improve overall classification of the students.
According to the Wald criterion, depression (z = 11.35, p = .001) and feeling lonely (z = 5.82, p < .05) reliably predicted whether or not a student reported having their property damaged or stolen. Students who reported feeling sad or hopeless were 1.5 times more likely while students experiencing loneliness were 1.4 times more likely to report their property being damaged or stolen while at school.