The Journal of Infectious Diseases
M A J O R A R T I C L E
Severe Flooding and Malaria Transmission in the Western
Ugandan Highlands: Implications for Disease Control in
an Era of Global Climate Change
Ross Boyce,1Raquel Reyes,2Michael Matte,6Moses Ntaro,6Edgar Mulogo,6Joshua P. Metlay,4Lawrence Band,3and Mark J. Siedner5 1
Division of Infectious Diseases,2
Division of General Medicine and Clinical Epidemiology, University of North Carolina School of Medicine,3
Department of Geography, University of North Carolina, Chapel Hill;4
Division of General Internal Medicine, Massachusetts General Hospital,5
Department of Medicine, Harvard Medical School and Massachusetts General Hospital, Boston; and6 Department of Community Health, Mbarara University of Science and Technology, Uganda
(See the editorial commentary by Caminade, Mclntyre, and Jones on pages 1300–1.)
Background. There are several mechanisms by which global climate change may impact malaria transmission. We sought to assess how the increased frequency of extreme precipitation events associated with global climate change will influence malaria trans-mission in highland areas of East Africa.
Methods. We used a differences-in-differences, quasi-experimental design to examine spatial variability in the incidence rate of laboratory-confirmed malaria cases and malaria-related hospitalizations between villages (1) at high versus low elevations, (2) with versus without rivers, and (3) upstream versus downstream before and after severeflooding that occurred in Kasese District, Western Region, Uganda, in May 2013.
Results. During the study period, 7596 diagnostic tests were performed, and 1285 patients were admitted with a diagnosis of malaria. We observed that extremeflooding resulted in an increase of approximately 30% in the risk of an individual having a positive result of a malaria diagnostic test in the postflood period in villages bordering aflood-affected river, compared with villages farther from a river, with a larger relative impact on upstream versus downstream villages (adjusted rate ratio, 1.91 vs 1.33).
Conclusions. Extreme precipitation such as theflooding described here may pose significant challenges to malaria control pro-grams and will demand timely responses to mitigate deleterious impacts on human health.
Keywords. Malaria; climate change; epidemiology; Uganda; disasters;flooding.
The effect of global climate change on the incidence of vector-borne diseases, including malaria, is of both great interest and debate [1,2]. Many analyses have suggested that rising global tem-peratures may result in a resurgence of malaria [3–5]. One region that has received particular attention is the East African highlands. A number of studies have attributed a resurgence of malaria in this region, especially at higher altitudes, to warming surface tempera-tures and changing rainfall patterns [5–8]. Others, however, are more skeptical of long-term impacts on climate [9,10].
In addition to rising global temperatures, the manifold effects of climate change also entail an increased frequency of weather extremes, such as droughts andfloods [11,12]. Approximately 50% of global disasters between 2003 and 2012 were attributable to extreme precipitation andflooding [13]. Populations in de-veloping countries are thought to be particularly at risk of ad-verse health consequences fromfloods, given unregulated land
use inflood-prone areas, limited public-health infrastructure, and inadequate emergency response capability [14].
Over the past 100 years, East Africa has become wetter on av-erage by around 10%–20% [15]. The frequency of majorflood events in this region has also been increasing [16]. Uganda is not only expected to see a relatively large increase in the mean annual temperature, but the country may also experience increases in extreme precipitation [8,15,17]. Like warming tem-peratures, weather extremes—particularly heavy precipitation andflooding—have been associated with increasing malaria transmission [18]. Changing precipitation patterns can have both short-term and long-term effects on vector habitats and disease transmission [4,19]. However, there is little empirical evidence outside offield reports and mathematical models about the relationship between individualflood events and ma-laria transmission.
On 1 May and again on 5 May 2013, heavy rains exacerbated existing glacial snowmelt [20,21] and submerged 9 subcounties of Kasese District, Western Region, Uganda. Using this event as a natural experiment, we sought to estimate the temporal and spatial changes in malaria epidemiology associated withfl ood-ing in this rural, malaria-endemic area of western Uganda. The overall objective of the study was to estimate the excess burden
Received 26 April 2016; accepted 28 June 2016; published online 17 August 2016. Correspondence: R. M. Boyce, Division of Infectious Diseases, University of North Carolina at Chapel Hill, 130 Mason Farm Rd, Chapel Hill, NC 27599 ([email protected]).
The Journal of Infectious Diseases®
2016;214:1403–10
of malaria attributable to flooding and, more specifically, to identify the geographic areas most vulnerable to postflood epi-demic malaria, using the method of differences in differences.
METHODS
Study Site
The Bugoye Level III Health Center (BHC), located in Kasese District (0° 18′N, 30° 5′E), functions as the primary referral center for the Bugoye subcounty, serving a rural population of approximately 50 000 residents. Clinical officers, nurses, midwives, and laboratory technicians from the Ugandan Min-istry of Health staff the health center, and care is available at no cost to patients. Malaria rapid diagnostic tests (mRDTs) were
first introduced at the BHC in 2011 [22].
The climate in Bugoye permits year-round malaria transmis-sion. There are semiannual transmission peaks that occur De-cember–February and May–July, following the end of the traditional rainy seasons [23]. The geography of the Bugoye subcounty is also highly varied. Narrow river valleys and steep hillsides with elevations up to 2000 m define the western-most villages of the subcounty along the boundary of the Rwen-zori National Park. In contrast, the villages located to the east and southeast are composed of relatively level terrain at eleva-tions nearly 1000 m lower than those to the west. Three large rivers—the Mubuku to the north, the Nyabyagi to the south, and the Sabo, which bisects the middle of the subcounty—
flow down the hillsides from west to east.
Theflooding of May 2013, considered the worst since April 1966, swept away houses, cattle, and infrastructure, including multiple bridges, the municipal wastewater treatment facility, and the district hospital. More than 1000 houses were de-stroyed, and nearly 10 000 residents were displaced [24]. Heavy rains caused overflowing of the Mubuku and Sabo rivers in the Bugoye subcounty, one of 9 affected subcounties in the region.
Study Design
We used a quasi-experimental design and differences-in-differ-ences regression analysis to examine malaria diagnostic testing results and malaria-related hospitalizations before and after se-vereflooding in Kasese District. Results of malaria diagnostic tests, defined as either microscopy or mRDT, were obtained from health center laboratory registries. Information on pa-tients admitted with a diagnosis of malaria was collected from inpatient medical records. For each record, we abstracted the following information: age, sex, village of residence, and diag-nostic test result.
To estimate associations between geographic factors and ma-laria risk, we completed village-level geographic information system (GIS) mapping of the subcounty and surrounding envi-rons, composing an area of approximately 55 km2. These data were entered into ArcGIS (Redlands, California) to create a
reference map, from which we calculated the mean elevation and area of each village. We divided the data into quartiles based on mean elevation (Figure 1) and defined villages by the presence or absence of aflood-affected river within or along the village boundaries. In a secondary analysis based on observed geographical trends, we subdivided the villages with
flood-affected rivers into 2 categories:“upstream”(defined as <6 km from the river source) and“downstream”(>6 km).
Of the 32 villages in the subcounty, we included 31 villages in the analyses. We excluded 1 village, where international relief organizations established temporary camps with healthcare ser-vices for individuals displaced byflooding. We included 2 vil-lages outside of the Bugoye subcounty but for which BHC is the closest medical center. Village populations were taken from the 2014 national census, from which we estimated a 3% annual population growth rate [25]. Villages that are tradition-ally subdivided for administrative purposes, such as Muramba 1 and Muramba 2, were considered 1 village for the analysis.
Statistical Analysis
To assess the impact offlooding on malaria transmission, we selected 2 primary outcomes of interest: (1) theP. falciparum test positivity rate (PfPR), defined as the percentage of malaria diagnostic tests positive forP. falciparummalaria per 100 tests conducted [26], and (2) the incidence rate of severe malaria, as measured by the number of malaria-related inpatient admis-sions per village per month, using 2014 census data to provide village-level population offsets. Our primary explanatory vari-able of interest was calendar time, which we divided into a 12-month“preflood”period (May 2012 to April 2013) and a 12-month“postflood”period (June 2013 to May 2014).
Wefirst graphically depicted trends in diagnostic test results and inpatient malaria admissions rates over calendar time to ex-amine patterns of malaria outcomes in relation to theflooding. We then compared malaria incidence before and after theflood byfitting generalized linear models and estimated the incidence rate ratio (IRR) of hospitalization before and after theflood, using generalized negative binomial regression models. We ac-counted for clustering within villages, using a clustered sand-wich estimator. We added potentially confounding covariates in multivariable models including age, sex, the presence of an affected river in the village, mean village elevation, and rainy versus dry season. We included in multivariable regression models all variables that were significant in univariable models with a prespecifiedPvalue of <.25 [27]. A resultingPvalue of <.05 infinal models was considered statistically significant.
increasingly used in public health to study the effects of external events or policies at different times by treating the event as a quasi-experiment [29,30]. Whereas conventional observational studies are valid only if there are no underlying secular trends in the outcomes of interest, the difference-in-differences study de-sign addresses this problem by using a comparison group that is experiencing the same trends but is not exposed to the event or policy. This method allows the investigator to subtract out back-ground changes.
Finally, we calculated the topographic convergence index (TCI) [31], which estimates drainage patterns based on a math-ematical measurement of upslope drainage and the slope of the terrain for our geographic area of interest. High values indicate areas with large upslope drainage area and relatively low slope, leading to higher potential for water to slow or stagnate. As the slope increases or the upslope drainage area decreases, the po-tential for water to pool in these regions drops, indicated by a drop in the TCI. All data were analyzed with Stata 12.1 (College Station, TX).
Ethics Statement
Ethical approval of the study was provided by the institutional review boards of Partners Healthcare and the Mbarara Univer-sity of Science and Technology. Informed consent was not re-quired by the ethical review committees because of the programmatic nature of original data collection and retrospec-tive review of data.
RESULTS
Diagnostic Test Positivity Rate
A total of 10 134 individuals underwent diagnostic testing for malaria by mRDT and/or microscopy during the study period. Village of residence information was not available for 630 test results (6.2%). Missing data were more common in the
post-flood than the preflood period (6.7% vs 5.2%;P= .004). We ex-cluded data from 1858 individuals (18.3%) who presented for testing from villages outside of the defined study area.
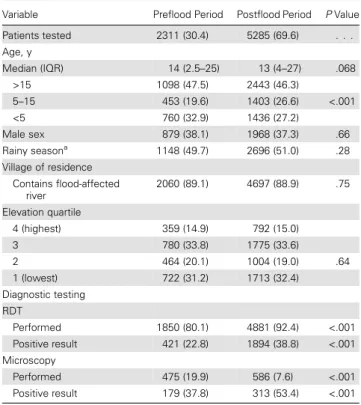
Complete clinical and demographic information was avail-able for 7596 individuals who presented from villages in the
de-fined study area during the observation period (Table1). The median age of those undergoing testing was 13 years, with ap-proximately 2 in 3 being female. The majority of those who had a malaria diagnostic test performed (6757 [89.0%]) presented from villages containing aflood-affected river.
More than twice as many patients underwent malaria testing in the postflood period as compared to the preflood period (5285 vs 2311). The test positivity rate increased from 25.8%
Figure 1. A, Mean village elevations divided in quartiles, highlighting the generally higher terrain to the west of the subcounty and the lower terrain to the southeast between the Mubuku and Sabo rivers.B,Plasmodium falciparumtest positivity rate (PfPR) in each village before the flood, with the highest rates in villages at lower elevation and along the major rivers.C, PfPR in each village after the flood, with relatively high positivity rates in the majority of villages.D, Absolute difference in the PfPR from the preflood to postflood periods. The PfPR for villages with <30 tests performed in the respective period is not shown.
Table 1. Characteristics of Patients Undergoing Diagnostic Testing for Malaria During Each Study Period
Variable Preflood Period Postflood Period PValue
Patients tested 2311 (30.4) 5285 (69.6) . . .
Age, y
Median (IQR) 14 (2.5–25) 13 (4–27) .068
>15 1098 (47.5) 2443 (46.3)
5–15 453 (19.6) 1403 (26.6) <.001
<5 760 (32.9) 1436 (27.2)
Male sex 879 (38.1) 1968 (37.3) .66
Rainy seasona
1148 (49.7) 2696 (51.0) .28 Village of residence
Contains flood-affected river
2060 (89.1) 4697 (88.9) .75
Elevation quartile
4 (highest) 359 (14.9) 792 (15.0)
3 780 (33.8) 1775 (33.6)
2 464 (20.1) 1004 (19.0) .64
1 (lowest) 722 (31.2) 1713 (32.4)
Diagnostic testing RDT
Performed 1850 (80.1) 4881 (92.4) <.001 Positive result 421 (22.8) 1894 (38.8) <.001
Microscopy
Performed 475 (19.9) 586 (7.6) <.001
Positive result 179 (37.8) 313 (53.4) <.001
Data are no. (%) of patients, unless otherwise indicated.
Abbreviations: IQR, interquartile range; RDT, rapid diagnostic test.
a
to 39.4% from the preflood to the postflood period (unadjusted relative risk [RR], 1.53; 95% confidence interval [CI], 1.42–1.65;
P< .001;Supplementary Table 1). This relationship remained statistically significant after adjustment for confounding vari-ables, such that 47% more tests were positive in the postflood period than the preflood period (adjusted RR [ARR], 1.47; 95% CI, 1.36–1.58;P< .001). When analyzed by month, the in-creased percentage of tests with positive results was most pro-nounced in November, typically a low transmission period, when the percentage of tests with positive results increased from approximately 7.3% to 33.6% from the preflood to the postflood period (ARR, 4.30; 95% CI, 2.33–7.92; P< .001; Figure2).
We identified significant interaction effects between geo-graphic characteristics and malaria test positivity (Table2), which we subsequently explored in the differences-in-difference analysis.
Presence of a Flood-Affected River
In the preflood period, the test positivity rate was 25.8% in vil-lages that bordered aflood-affected river and 25.5% in those that did not. In the postflood period, test positivity rates were statistically similar in those villages farther from a river (PfPR, 27.0%;P= .66) but were significantly higher in villages border-ing theflood-affected rivers (PfPR, 40.9%;P< .001). Using a re-gression model stratified by the presence or absence of a river and adjusted for confounding variables, we see that there was little relative change from the preflood to postflood period in villages farther from a river (ARR, 1.03; 95% CI, .81–1.33;
P= .78) but a significantly higher risk of a positive test in
those villages bordering a flood-affected river (ARR, 1.53; 95% CI, 1.41–1.66P< .001). Overall, there was an increase of 30% in the risk of an individual having a positive malaria diag-nostic test result in the postflood period in villages bordering a
flood-affected river, compared with villages farther from a river (ARR, 1.30; 95% 1.16–1.46;P< .001).
Upstream Versus Downstream
Among those villages bordering aflood-affected river, in the
pre-flood period, the test positivity rate was 29.1% in the downstream villages and 21.3% in the upstream villages. In the postflood pe-riod, however, the test positivity rate was 40.4% (P< .001) in the downstream villages and 41.6% (P< .001) in the upstream villag-es. Again, using a regression model stratified by the relative loca-tion of the village along the river and adjusted for confounding variables, we found that there was larger relative change from the preflood to the postflood period in upstream villages (ARR, 1.91; 95% CI, 1.67–2.20;P< .001), compared with downstream villages (ARR, 1.33; 95% CI, 1.20–1.46;P< .001). In the postflood period, there was no difference in the risk of an individual having a pos-itive malaria diagnostic test result in the upstream villages, com-pared with the downstream villages (ARR, 0.98; 95% 0.95–1.01;
P= .24), whereas in the preflood period, upstream villages were relatively protected.
Elevation
The effect of elevation was largely consistent between the preflood and postflood periods, with higher elevations experi-encing a lower risk of malaria transmission during both periods (Table2).
Individual Villages
In addition to the overall increase in the test positivity rate from the preflood to the postflood period at the subcounty level, significant increases were identified in 8 individual villages (Figure3A). Aflood-affected river was present in all 8 villages with significant changes in the relative malaria risk. The greatest magnitude of effect was observed in the upstream villages. When the results of changes in the risk of a positive test result at the village level were overlaid on the convergence index (Figure4), we see that the villages with the largest relative risk for an increase in the test positivity rate were upstream villages, which generally have well-organized, branching drainage networks. In contrast, the downstream villages, which were less impacted in the postflood period, generally had disorga-nized drainage networks consistent with the more level terrain.
Malaria Admissions
Over the study period, 1744 patients were admitted to the inpa-tient ward with a diagnosis of malaria. Only 25 painpa-tients (1.4%)
did not have village of residence information included in the clinical record. We excluded 229 individuals (13.1%) who pre-sented for testing from villages outside of the defined study area and 200 patients (11.5%) who presented from the village where the temporary camps were established.
Relevant demographic and clinical data was available for >98% of included individuals. The only significant difference in the demographic characteristics of admitted patients was a greater proportion of patients aged 5–15 years old in the
post-flood period, with a lower proportion of those <5 years of age (Supplementary Table 3).
The number of patients admitted with a diagnosis of malaria increased by >50% in the postflood period (781 vs 504;P< .001). Additionally, malaria-related admissions as a proportion of all medical admissions increased significantly (54.1% vs 45.4%;
P< .001). After adjustment for the presence of a river and mean village elevation, the incidence rate ratio (AIRR) of admis-sions for malaria remained significantly higher in the postflood periods, compared with the preflood period (AIRR, 1.40; 95% CI, .1.16–1.69;P< .001; Supplementary Table 2). Similar to the trends seen with PfPR, we found that all 5 villages that experi-enced increasing incidence of malaria admissions after the
flood were in close proximity to aflood-affected river (Figure3B). We found trends in the interaction effects betweenflooding, the presence of a river, the relative location along the river (upstream vs downstream), or village elevation on the rates of malaria ad-mission, but these associations did not reach the threshold of stat-istical significance.
DISCUSSION
Our results demonstrate a significant and sustained increase in malaria transmission following catastrophicflooding in a rural, highland area of western Uganda. We observed an increase of approximately 30% in the risk of an individual having a positive
Table 2. Interactions Between Village Characteristics and Study Periods and the Risk of a Positive Malaria Test Result
Characteristic
Preflood Period Postflood Period
Interaction RR P Value RR P Value P Value
Contains river 1.01 .92 1.50 <.001 .003
Location from river
Downstream Reference Reference <.001
Upstream 0.86 <.001 1.02 .41 Elevation quartile
1 (lowest) Reference Reference
2 0.76 .005 0.70 <.001 .44
3 0.73 <.001 0.96 .24 .004
4 (highest) 0.60 <.001 0.59 <.001 .90
Abbreviation: RR, relative risk.
malaria diagnostic test in the postflood period in villages border-ing aflood-affected river compared with villages farther from a river. Among villages bordering aflood-affected river, we saw a larger relative impact on upstream versus downstream villages (ARR, 1.91 vs 1.33). We also observed a 40% increase in the in-cidence rate of malaria admission in the postflood period, using the conventional preflood versus postflood analysis, but did not observe similar changes using the differences-in-differences model, afinding that may reflect the smaller absolute number of admissions from affected areas. Overall, these results suggest that the increasingly frequent extreme precipitation events asso-ciated with global climate change have great potential to adverse-ly affect malaria-related health in highland areas of East Africa.
Our study identified a number of geographical factors of
post-flood malaria that may inform emergency response and malaria control programs. First, the observed impacts of theflood were most pronounced in villages along flood-affected rivers. This
finding is consistent with previous work showing that most pro-ductive breeding sites are usually located close to rivers and streams [32,33] and that households in close proximity to breed-ing sites generally exhibit higher adult mosquito densities [34].
Second, we found the greatest relative increase in malaria test positivity in upstream areas. When we overlaid the postflood malaria risk map on TCI results (Figure4), we found that the upstream villages were generally those with organized, branch-ing drainage systems. Under normal conditions, these areas are
well drained, and accessible surface water is largely limited to fast-moving streams that are unsuitable breeding habitats [35,
36]. However, during periods of extreme, prolonged precipita-tion, well-drained areas may become saturated to the extent that stagnant pools are formed, creating ideal habitats for the
Anophelesvector [32,35]. Despite the greater relative impact on upstream villages, the absolute effect of theflood was most pronounced in lower downstream villages. In such areas, stag-nant pools are a permanent feature of the terrain, which favors stable breeding habitats and malaria transmission even in the absence offlooding.
Third, we observed a 3-month lag between theflooding and the peak of the postflood malaria epidemic. This delay may be the result of heavy rainfallflushing out existing breeding sites. Lyndsay et al hypothesized that such aflushing effect could ex-plain the lower postflood malaria prevalence in northeastern Tanzania seen after the heavy precipitation of the 1997–1998 El Nino southern oscillation [37]. However, as thefloodwaters recede, the vectors can reestablish productive habitats in new areas typically with a delay of 6–8 weeks, although this may vary by geographic and climactic conditions [38]. In Mozam-bique, for example, malaria incidence peaked approximately 1 month afterflooding, while in northeastern Kenya and south-west Uganda, peak incidence was seen 2–3 months afterfl ood-ing, which is consistent with ourfindings [39–41]. In our study, the impact offlooding on malaria transmission was greatest during what is typically the low transmission season, with a >4-fold increased risk of a positive malaria test in the postflood period, compared with the preflood period (Figure2). We hy-pothesize that this“unseasonal epidemic”was due to surface waters from theflood that accumulated and persisted, allowing mosquito larvae to complete the full life cycle at times and in areas not normally hospitable to breeding [42].
Our study has a number of important policy and programmat-ic implprogrammat-ications. First, the initial delay between theflood and the postflood epidemic may provide an important opportunity for targeted interventions to mitigate the postflood epidemic [43]. Additionally, our results show that control efforts must be sus-tained, as the effects of theflood on malaria transmission may continue for up to 1 year after the initial event. Finally, our study demonstrates the importance of understanding local micro-environments. Most of the villages we studied averaged <2 km2in size, yet we observed stark contrasts in both the preflood and postflood epidemiology of malaria, even between neighboring villages.
Our study has a number of methodological limitations. While more robust than conventional preevent versus postevent analyses, the difference-in-differences study design relies on the assumption that preexisting trends in malaria transmission would have been the same in the postflood period in the ab-sence of severeflooding. Differential trends in the exposed and unexposed villages in the period leading up to theflooding
would have biased our results. We assessed these trends prior to the“shock”of theflood by examining the parallel trends and presenting graphical displays of the raw data that clearly dem-onstrate this assumption was met (Figure5).
Second, because we abstracted information from routinely collected clinical records, our study is subject to error in pro-grammatic medical record data collection. In general, missing clinical or demographic data was rare, and we did not observe a differential rate of missing data by geographic location, al-though there was a small increase in the postflood period as compared to the preflood period (6.7% vs 5.2%;P= .004).
Finally, it is not possible to attribute this specific event to cli-mate change or to predict whether similar events will occur in this or other flood-prone malaria-endemic areas. However, changing precipitation patterns over the last century and increas-ing frequency of extremeflooding events both in East Africa and other regions mandate increased attention to relationships be-tween such events and human health [5,8,11,16].
In summary, we have observed increased malaria transmis-sion and morbidity following a majorflood event in a highland area of western Uganda. Thesefindings highlight that extreme
weather conditions during periods of increased global weather emergencies have great potential to adversely affect human health in malaria-endemic and epidemic-prone areas. Events such as theflooding described here may pose significant chal-lenges to malaria control and elimination programs, and will demand timely and sustained responses to prevent and mitigate deleterious impacts on human health.
Supplementary Data
Supplementary materialsare available athttp://jid.oxfordjournals.org. Consisting of data provided by the author to benefit the reader, the posted materials are not copyedited and are the sole responsibility of the author, so questions or comments should be addressed to the author.
Notes
Acknowledgments. We thank Drs Alexander Tsai and Atheendar Ven-kataramani, along with John Lovette, for their editorial input on manuscript drafts; the Harvard Global Health Initiative and Thrasher Research Fund, for support to R. M. B.; and the National Institutes of Health, for support via grant K23MH099916 to M. J. S.
Potential conflicts of interest. All authors: No reported conflicts. All authors have submitted the ICMJE Form for Disclosure of Potential Con-flicts of Interest. Conflicts that the editors consider relevant to the content of the manuscript have been disclosed.
References
1. Patz JA, Epstein PR, Burke TA, Balbus JM. Global climate change and emerging infectious diseases. JAMA1996; 275:217–23.
2. McMichael AJ, Woodruff RE, Hales S. Climate change and human health: present and future risks. Lancet2006; 367:859–69.
3. Tanser FC, Sharp B, le Sueur D. Potential effect of climate change on malaria transmission in Africa. Lancet2003; 362:1792–8.
4. Githeko AK, Lindsay SW, Confalonieri UE, Patz JA. Climate change and vector-borne diseases: a regional analysis. Bull World Health Organ2000; 78:1136–47. 5. Caminade C, Kovats S, Rocklov J, et al. Impact of climate change on global malaria
distribution. Proc Natl Acad Sci U S A2014; 111:3286–91.
6. Siraj AS, Santos-Vega M, Bouma MJ, Yadeta D, Ruiz Carrascal D, Pascual M. Al-titudinal changes in malaria incidence in highlands of Ethiopia and Colombia. Sci-ence2014; 343:1154–8.
7. Zhou G, Minakawa N, Githeko AK, Yan G. Association between climate variability and malaria epidemics in the East African highlands. Proc Natl Acad Sci U S A 2004; 101:2375–80.
8. Leedale J, Tompkins AM, Caminade C, Jones AE, Nikulin G, Morse AP. Projecting malaria hazard from climate change in eastern Africa using large ensembles to es-timate uncertainty. Geospat Health2016; 11:393.
9. Hay SI, Cox J, Rogers DJ, et al. Climate change and the resurgence of malaria in the East African highlands. Nature2002; 415:905–9.
10. Gething PW, Smith DL, Patil AP, Tatem AJ, Snow RW, Hay SI. Climate change and the global malaria recession. Nature2010; 465:342–5.
11. Smith KR, Woodward A, Campbell-Lendrum D, et al. Human health: impacts, ad-aptation, and co-benefits. In: Climate change 2014: impacts, adaptation, and vul-nerability. Part A: global and sectoral aspects. Contribution of Working Group II to the Fifth Assessment Report of the Intergovernmental Panel on Climate Chan-ge. Cambridge, United Kingdom,2014:709–54.
12. Zhang X, Wan H, Zwiers FW, Hegerl GC, Min S-K. Attributing intensification of precipitation extremes to human influence. Geophys Res Lett2013; 40:5252–7. 13. Guha-Sapir D, Below R, Ponserre S. Annual Disaster statistical review 2013: the
numbers and trends. Brussels: Centre for Research on the Epidemiology of Disas-ters,2014.
14. Haines A, Kovats RS, Campbell-Lendrum D, Corvalan C. Climate change and human health: impacts, vulnerability, and mitigation. Lancet2006; 367:2101–9. 15. Hepworth N, Goulden M. Climate change in uganda: understanding the
implica-tions and appraising the response. Edinburgh: LTS International,2008. 16. Niang I, Ruppel OC, Abdrabo MA, et al. Africa. In: Barros VR, Field CB, Dokken
DJ, et al., eds. Africa. Climate change 2014: impacts, adaptation, and vulnerability. Part B: regional aspects. Contribution of Working Group II to the Fifth Assessment Report of the Intergovernmental Panel on Climate Change. Cambridge, United Kingdom and New York, NY: Cambridge University Press,2014:1199–265. 17. Goulden M. Livelihood diversification, social capital and resilience to climate
var-iability amongst natural resource dependent societies in Uganda [dissertation]. Norwich, United Kingdom: University of East Anglia,2006.
18. Watts N, Adger WN, Agnolucci P, et al. Health and climate change: policy re-sponses to protect public health. Lancet2015; 15:12.
19. Pascual M, Cazelles B, Bouma MJ, Chaves LF, Koelle K. Shifting patterns: malaria dynamics and rainfall variability in an African highland. Proc R Soc B2008; 275:123–32.
20. Kaggwa R, Hogan R, Hall B, eds. Enhancing the contribution of weather, climate and climate change to growth, employment and prosperity. Kampala, Uganda: UNDP/NEMA/UNEP Poverty Environment Initiative,2009.
21. Taylor RG, Mileham L, Tindimugaya C, Mwebembezi L. Recent glacial recession and its impact on alpine riverflow in the Rwenzori Mountains of Uganda. J Afr Earth Sci2009; 55:205–13.
22. Boyce RM, Muiru A, Reyes R, et al. Impact of rapid diagnostic tests for the diag-nosis and treatment of malaria at a peripheral health facility in Western Uganda: an interrupted time series analysis. Malar J2015; 14:203.
23. Boyce R, Reyes R, Ntaro M, et al. Association between HRP–2/pLDH rapid diag-nostic test band positivity and malaria–related anemia at a peripheral health facil-ity in Western Uganda. J Glob Health2015; 5:020402.
24. International Federation of the Red Cross and Crescent. DREF Preliminary Final Report. Uganda: Kasese Floods,2014.
25. Uganda Bureau of Statistics. National population and housing census 2014: provisional results. Revised ed. Kampala, Uganda: Uganda Bureau of Statistics, November 2014.
26. World Health Organization (WHO). Disease surveillance for malaria control: an operational manual. Geneva: WHO,2012:6–19.
27. Hosmer D, Lemeshow S. Applied logistic regression. New York: Wiley,2000. 28. Dimick JB, Ryan AM. Methods for evaluating changes in health care policy: the
difference-in-differences approach. JAMA2014; 312:2401–2.
29. Chatterjee P, Venkataramani AS, Vijayan A, Wellen JR, Martin EG. THe effect of state policies on organ donation and transplantation in the United States. JAMA Intern Med2015; 175:1323–9.
30. McWilliams JM, Chernew ME, Landon BE, Schwartz AL. Performance differences in year 1 of pioneer accountable care organizations. N Engl J Med2015; 372:1927–36.
31. Beven KJ, Kirkby MJ. A physically based variable contributing area model of basin hydrology. Hydrological Sciences Bulletin1979; 24:43–69.
32. Zhou G, Munga S, Minakawa N, Githeko AK, Yan G. Spatial relationship between adult malaria vector abundance and environmental factors in western Kenya high-lands. Am J Trop Med Hyg2007; 77:29–35.
33. Majambere S, Pinder M, Fillinger U, et al. Is mosquito larval source management appropriate for reducing malaria in areas of extensiveflooding in The Gambia? A cross-over intervention trial. Am J Trop Med Hyg2010; 82:176–84.
34. Cano J, Descalzo MA, Moreno M, et al. Spatial variability in the density, distribu-tion and vectorial capacity of anopheline species in a high transmission village (Equatorial Guinea). Malar J2006; 5:21.
35. Githeko AK, Ototo EN, Guiyun Y. Progress towards understanding the ecology and epidemiology of malaria in the western Kenya highlands: opportuni-ties and challenges for control under climate change risk. Acta Trop2012; 121:19–25.
36. Githeko AK, Ayisi JM, Odada PK, et al. Topography and malaria transmission het-erogeneity in western Kenya highlands: prospects for focal vector control. Malar J 2006; 5:107.
37. Lindsay SW, Bodker R, Malima R, Msangeni HA, Kisinza W. Effect of 1997–98 El Nino on highland malaria in Tanzania. Lancet2000; 355:989–90.
38. World Health Organization. Flooding and communicable diseases fact sheet. Risk assessment and preventive measures. Geneva: World Health Organization,2005. 39. Kondo H, Seo N, Yasuda T, et al. Post-flood–infectious diseases in Mozambique.
Prehosp Disaster Med2002; 17:126–33.
40. Kilian AHA. Rainfall pattern, El Niño and malaria in Uganda. Trans R Soc Trop Med Hyg1999; 93:22–3.
41. Brown V, Abdir Issak M, Rossi M, Barboza P, Paugam A. Epidemic of malaria in north-eastern Kenya. Lancet1998; 352:1356–7.
42. Minakawa N, Munga S, Atieli F, et al. Spatial distribution of anopheline larval hab-itats in Western Kenyan highlands: effects of land cover types and topography. Am J Trop Med Hyg2005; 73:157–65.