THE RELATIONSHIP BETWEEN THE PROPORTION OF NATIVE AMERICAN ADOLESCENTS IN SCHOOLS AND SOCIO-EMOTIONAL FUNCTIONING
Carly Kaye Hoffend
A dissertation submitted to the faculty of the University of North Carolina at Chapel Hill in partial fulfillment of the requirements for the degree of Doctor of Philosophy in the
Department of School Psychology in the School of Education.
Chapel Hill 2013
Abstract
CARLY KAYE HOFFEND: The Relationship Between the Proportion of Native American Adolescents in Schools and Socio-Emotional Functioning
(Under the direction of Barbara H. Wasik)
A relationship between racial/ethnic school composition and socio-emotional
functioning for Native American adolescents is assumed to exist, but little empirical research is available describing this relationship. Such research could contribute to understanding the school adjustment of these adolescents. The present study examined school composition, social-emotional functioning, and relational experiences with peers, parents, and teachers as contributors to the self-esteem and adjustment. The sample included a total of 1080 Native American students in grades six through eight from the 19 schools in Robeson County, North Carolina. The Robeson County population is made up of 38.4% Native American and
Alaska Native and approximately 96% of residents who identified as Native American
specifically identified as being a part of the Lumbee tribe (US Census, 2010a). Data from the adolescents were collected on socio-emotional variables, including adjustment, self-esteem, and perceptions about various peer, parent, and teacher relationship factors. Data were primarily analyzed through Structural Equation Modeling (SEM) to examine direct and indirect effects of proportion of Lumbee students on socio-emotional outcomes through social variables.
Acknowledgements
The successful completion of this dissertation is the result of the support I received from many individuals. First, thank you to my dissertation chair, Barbara Wasik, for all of the time and energy you invested in my professional and personal success throughout graduate school. I would like to extend my sincerest gratitude to Natasha Bowen for your honesty, mentorship, and selfless guidance throughout this process. To Danielle Swick, thank you for your continued encouragement, kindness, and invaluable help. Thank you to the rest of my committee for your on-going support toward my professional goals. In addition, this dissertation would not have been possible without the generosity of Paul Smokowski and his research team, whose attention to detail and data management give me security and confidence in my study results.
Table of Contents
List of Tables ...x
List of Figures ... xi
List of Abbreviations ... xii
Chapter I. Introduction ...1
II. Literature Review...3
Theoretical Underpinnings of Adolescent Social Development...3
Mental Health and Social Experiences in Early Adolescence ...6
Positive peer relationships...6
Negative peer relationships ...8
Parent-adolescent relationship...9
Teacher-student relationship ...9
School climate factors ...10
Racial/Ethnic Factors in the School Environment ...11
Racial/ethnic minorities and socio-emotional outcomes...12
Racial/Ethnic stratification...14
Native Americans and Mental Health...14
Lumbee Native Americans ...16
Historical overview ...16
Lumbee adolescent mental health research ...24
School Racial/Ethnic Composition ...25
Belongingness and Socio-emotional Outcomes...28
Native Americans and Belongingness...29
Lumbee Native Americans and School Racial/Ethnic Composition...32
Rationale for Current Study ...33
Research Questions and Hypotheses ...35
Research question 1...36
Hypothesis 1a ...36
Hypothesis 1b ...36
Research question 2...36
Hypothesis 2a ...36
Hypothesis 2b ...36
Research question 3...37
Hypothesis 3a ...37
Hypothesis 3b ...37
III. Method ...38
Participants...38
Procedure ...40
Measures ...40
School racial/ethnic composition ...40
School Success Profile-PLUS (SSP-PLUS)...41
Analytic Procedure...44
Research questions 1 ...44
Research questions 2 and 3 ...44
IV. Results...49
Hypothesis 1a...49
Univariate descriptive analysis ...49
ANOVA results...50
Hypothesis 1b...51
Univariate descriptive analysis ...51
ANOVA results...52
Research Question 2 ...53
Preliminary analysis...53
Measurement model analysis...53
SEM analysis ...54
Direct and indirect effects of proportion of Lumbee students ....56
Research Question 3 ...57
Preliminary analysis...57
Measurement model analysis...57
SEM analysis ...57
Direct and indirect effects of proportion of Lumbee students ....60
V. Discussion ...62
Minimum threshold and socio-emotional outcomes...62
Study Limitations and Future Research...66
Conclusion ...69
Appendices...71
Appendix A. Parent Information Sheet...71
Appendix B. Student Assent Screen ...72
Appendix C. Text of Contact Information Handout ...73
Appendix D. Proportion of Lumbee Students in Robeson County Schools ...74
Appendix E. Hypothesis 1a: Means Plot Slope for Adjustment...75
Appendix F. Hypothesis 1b: Means Plot Slope for Self-Esteem ...76
Appendix G. School Success Profile-PLUS (SSP-PLUS): Instructions, Items, and Response Choices by Subscale...77
Appendix H. Adjustment Measurement Model Factor Loadings...79
Appendix I. Adjustment Final SEM Correlation Matrix ...81
Appendix J. Adjustment Final SEM Factor Loadings ...86
Appendix K. Self-Esteem Measurement Model Factor Loadings ...88
Appendix L. Self-Esteem Final SEM Correlation Matrix ...90
Appendix M. Self-Esteem Final SEM Factor Loadings ...96
List of Tables Table
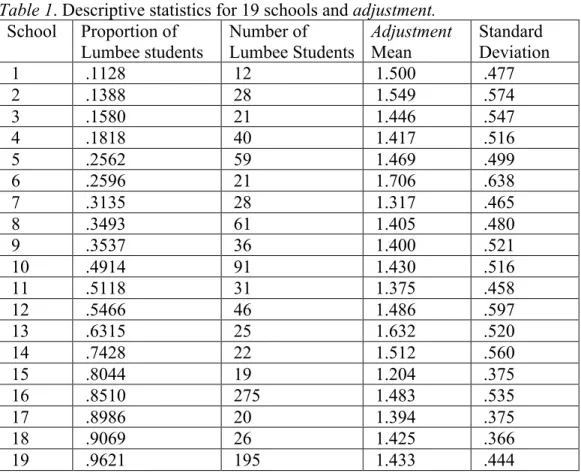
1. Descriptive statistics for 19 schools and adjustment...49
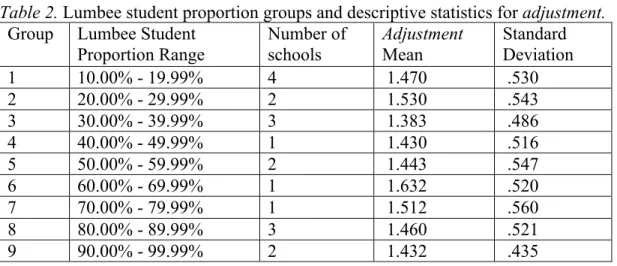
2. Lumbee student proportion groups and descriptive statistics for adjustment...50
3. Descriptive statistics for 2 groups and adjustment...51
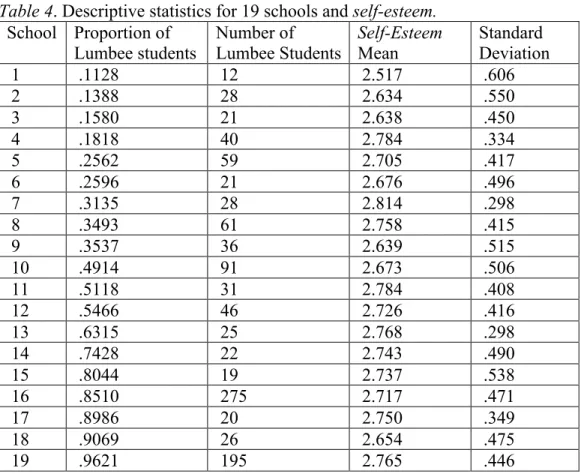
4. Descriptive statistics for 19 schools and self-esteem...51
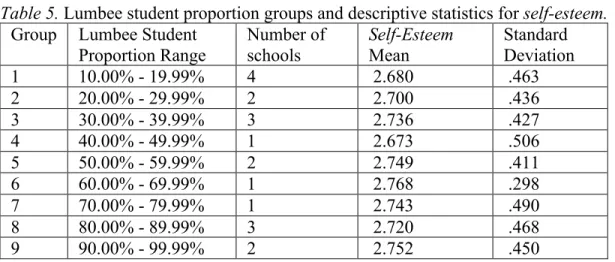
5. Lumbee student proportion groups and descriptive statistics for self-esteem...52
6. Descriptive statistics for 2 groups and self-esteem...53
7. R2 values for latent mediator variables and adjustment...56
List of Figures Figure
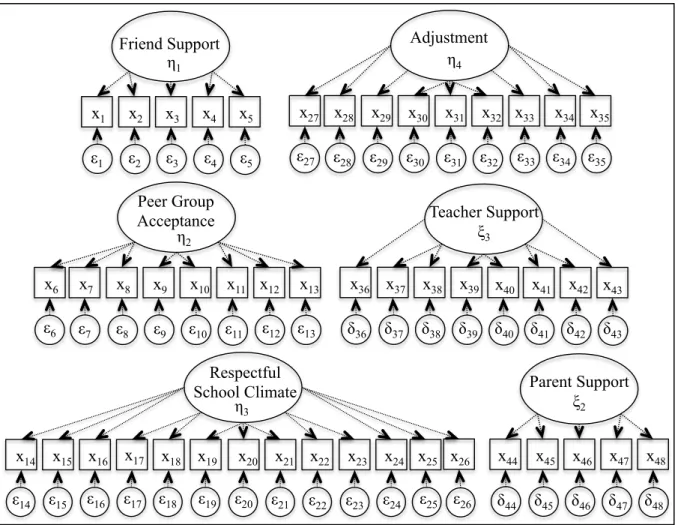
1. Measurement model for adjustment...45
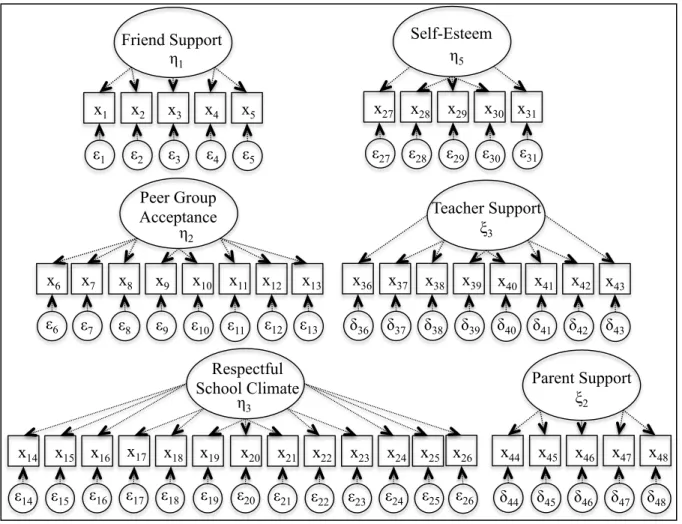
2. Measurement model for self-esteem...46
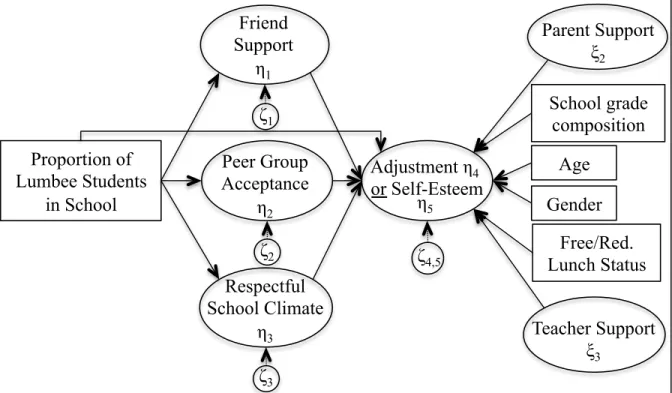
3. Proposed structural model for adjustment and self-esteem...47
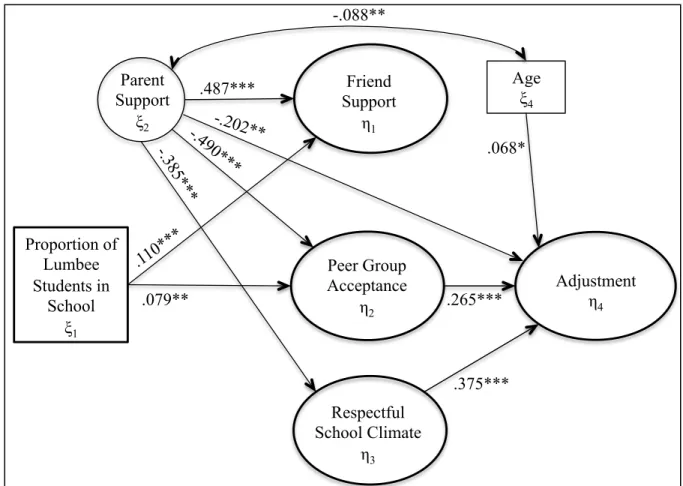
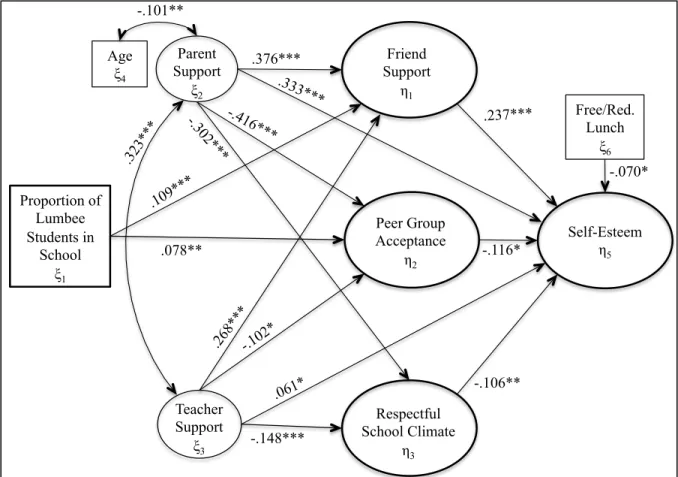
4. Standardized coefficients for final adjustment SEM ...55
List of Abbreviations CFI Comparative Fit Index
NC-ACE North Carolina Academic Center for Excellence in Youth Violence Prevention
RMSEA Root Mean Square Error of Approximation SEM Structural Equation Modeling
SSP School Success Profile
SSP-PLUS School Success Profile – PLUS TLI Tucker-Lewis Index
CHAPTER I Introduction
Across their lives, children and youth develop within interpersonal contexts and participate in relationships with caregivers, peers, and significant adults. Such relationships play a significant role in mental health and well-being (Hartup, 2009). The contribution of each relationship on a child’s socio-emotional development varies as the child ages. As children mature into adolescence, a gradual shift occurs in that peer relationships become more meaningful and influential (Fabes, Martin, & Hanish, 2009; Furman & Buhrmester, 1992). Particularly during early adolescence, ages 11 to 13 years (Harter, 2012), peers develop into key providers of support, companionship, advice, and affirmation (Collins & Laursen, 2004).
School settings are prime contexts in which to study peer relationships and related influences on socio-emotional outcomes. Though considerable research has been conducted on peer relationships, often missing in the literature is a focus on the broader sociocultural context in which individuals develop, including ethnic groups, classrooms, and peer groups (Graham, 2006). Furthermore, while racial/ethnic group membership contributes to the way that peers relate, few studies take into consideration the varying racial/ethnic composition of school contexts in the examination of peer relationships (Graham, Taylor, & Ho, 2009).
integration of public schools and prompted research on numerous topics related to students’ academic performance and social well-being. Among the research topics following from this Supreme Court decision was how adolescents’ sense of belonging within the school context is related to the school’s racial/ethnic composition. For example, as school racial/ethnic heterogeneity increases, adjustment outcomes and sense of belongingness also increase while feelings of victimization and loneliness decrease (Graham, 2006; Juvonen, Nishina, &
Graham, 2006). The research that examines school diversity has included Caucasian, African American, Asian American, and Latino youth (e.g., Benner & Crosnoe, 2011; Benner, Graham, & Mistry, 2008; Goldsmith, 2004; Johnson, Crosnoe, & Elder, 2001;
Rosenberg, 1975), but a review of the research reveals that few studies have examined Native American populations in relation to socio-emotional outcomes and racial/ethnic school composition.
The current study aims to address the significant literature gap regarding school composition in relation to socio-emotional functioning for Native American students who are members of the Lumbee nation, one of the largest tribes in the United States (US Census Bureau, 2010b). This study provided data to help understand the Native American
CHAPTER II Literature Review
Theoretical Underpinnings of Adolescent Social Development
The influence of interpersonal relationships on adolescent development has been a focus of study within developmental psychology for several decades. Direct and indirect impacts of various significant relationships, such as peers, parents, and teachers within the adolescent’s culture, are described through the lenses of several theoretical perspectives. Most applicable to the adolescent social world include Bronfenbrenner’s ecological systems model (1977, 1979), Bowlby’s theory of attachment (1969), and Erikson’s theory of
psychosocial development (1968).
culture, and economies. Bronfenbrenner also suggested that the relationships shift over time, which is represented by the chronosystem (Bronfenbrenner, 1979).
Bronfenbrenner’s model of interconnected social contexts demonstrates the complex process of an individual’s development within and between immediate and distal settings, such as the home, school, neighborhood, and the larger society and culture (Andrews, 1985; Bronfenbrenner, 1977, 1986). Using an ecological perspective requires an examination of the various influences on an individual’s development, such as peers, parents, teachers, and culture. Because this theory is applicable across the lifespan (Moen, Elder, & Luscher, 1995) and focuses on the development of the individual within various relationships,
Bronfenbrenner’s (1979) ecological model is used as an organizing heuristic to discuss and examine these critical relationships and their influences on adolescent mental health. Specifically, the direct impact of relationships with significant individuals within the
microsystem can be further explored through an attachment framework and Erikson’s theory of psychosocial development.
From an attachment perspective, adolescent peer relationships are influenced by the early protective and nurturing caregiver role within the parent-child relationship.
Specifically, adolescents carry with them an internal working model (Bowlby, 1969) from early attachment relationships as a framework from which to explore their peer relationships (Hartup, 2009). The parent-child relationship functions as an underlying influence on adolescent peer relationships, demonstrating that family and peer relationships are complex and intertwined in their influence on adolescent social development (Hartup, 2009).
toward friends, who become vital sources of emotional comfort (Allen, 2008; Nickerson & Nagle, 2005). Though the parent-child relationship continues to be an important source of influence during this developmental period, particularly reducing the susceptibility of adolescents to peer pressure (Farrell & White, 1998; Galambos, Barker, & Almeida, 2003; Vitaro, Brendgen, & Tremblay, 2000; Wood, Read, Mitchell, & Brand, 2004), adolescents spend significantly more time with peers as they do with parents and other adults
(Csikszentmihalyi & Larson, 1984; Rubin, Begle, & McDonald, 2012).
Through the shift in attachment figure from parent to peer during early adolescence, friend relationships often embody characteristics of parent attachment relations, such as acceptance, trust, close communication, proximity seeking (Cotterell, 2007; Weiss, 1982), companionship, and enhancement of personal worth (Rubin, Bukowski, & Parker, 2006). Adolescents begin to seek intimacy and closeness with friends (Buhrmester, 1996), and friendships take on higher levels of support and self-disclosure (Meece & Laird, 2006). Interestingly, those who are strongly attached to their parents and receive support from their parents are more likely to find support from peers (Freeman & Brown, 2001; Nickerson & Nagle, 2005). At the same time, adolescents prefer their friends to be trusted confidants more so than their parents (Fischer, Munsch, & Greene, 1996). Micucci (2009) also found that adolescents seek the approval and attention of peers more than that of adults.
toward successful identity development. Building on this model, contemporary literature demonstrates that such social comparisons enable adolescents to develop a better
understanding of their unique characteristics, differentiate themselves from their peers, and evaluate their own values and self-concept (Harter, 2006b; Harter, 2012; Meece & Daniels, 2008).
Mental Health and Social Experiences in Early Adolescence
Peer relationships are not only important for identity development during adolescence, but these social interactions are also related to mental health outcomes. In general, adolescents are at an increased risk for developing mental health difficulties. During adolescence, low self-esteem and adjustment difficulties are highly prevalent, including depressive and anxiety symptoms (Blazer, Kessler, McGonagle, & Swartz, 1994; Costello, Erkanli, & Angold, 2006; Kazdin, 1993; Kessler et al., 2005; Roeser & Eccles, 1998). Self-esteem, defined as the general evaluation of one’s overall self-worth, involves examining one’s abilities, traits, and characteristics (Harter, 2006a), often decreases during early and middle adolescence (Seidman, Allen, Aber, Mitchell, & Feinman, 1994, Simmons & Blyth, 1987) and tends to fluctuate across events and time (Abernathy, Massad, &
Romano-Dwyer, 1995; Harter, 2012) as well as across relationships (Harter, 2012). In fact, global self-worth for these age groups is most significantly predicted by approval of
classmates (Harter, 2012).
conflict (Parker & Asher, 1993). The literature on social support indicates that feelings of self-worth, self-efficacy, and competence are enhanced by positive peer relationships (Parker & Asher, 1987; Parker, Rubin, Price, & DeRosier, 1995; Rubin et al., 2006). Peer support has been shown to predict higher self-esteem in adolescent boys and girls, as well as lower levels of depression in boys (Colarossi & Eccles, 2003).
Transactional models that link peer relationships and adjustment often focus on the interactions between children and the environment and the reciprocal influences they have on each other (Meece & Laird, 2006). One such model is Crick and Dodge’s (1994)
reformulation of social information processing theory. According to their theory, characteristics of individual children and the environment interact through reciprocal feedback loops over time. More specifically, an individual’s social cognitions
simultaneously influence, and are affected by, social experiences in the environment. Therefore, positive peer relationship experiences tend to lead toward positive socio-emotional outcomes and vice versa. In fact, research has shown that social support is a significant protective factor, defined as a feature of the individual or environment that can act as a buffer against the effects of stress and adversity (Luster, Bates, & Johnson, 2006).
those coming from less optimal family environments (Gauze, Bukowski, Aquan-Assee, & Sippola, 1996).
Moreover, children tended to be victimized less when they identified the presence of a best friend (Cowie, 2000), and having close friends has been related to reductions in the impact of peer victimization (Cowie, 2000; Owens, Shute, & Slee, 2000). Victimized individuals tend to be less lonely when they have positive social relationships with peers (Storch, Brassard, & Masia-Warner, 2003). In addition, higher self-esteem and lower rates of negative outcomes, such as school problems, hostility, psychiatric symptoms, and delinquent behavior, have been linked with supportive adolescent friendships (Hirsch & DuBois, 1992).
Negative peer relationships. Difficulties with peer relationships can have an immense effect on the psychological adjustment of youth (Kupersmidt, Coie, & Dodge, 1990; Parker et al., 1995; Rubin et al., 2006). A lack of, or disruptions in, peer relationships can have significant impacts on adolescent adjustment and psychopathology
(Deater-Deckard, 2004). Negative feelings such as grief, despair, and loneliness result from a lack of peer attachment, which further supports the theory that attachment shifts toward the peers during adolescence (Cotterell, 2007). Disruptions in close friendships have been associated with depression (Parker & Seal, 1996) and maintenance of mood disturbance (Goodyer, Herbert, Tamplin, Secher, & Pearson, 1997).
depression, poor school achievement, school drop-out, and delinquent behavior (Parker & Asher, 1987; Parker et al., 1995; Savin-Wiliams & Berndt, 1990). Furthermore, those who have poor peer relationships tend to be at the greatest risk for developing academic problems and antisocial behaviors (Meece & Daniels, 2008).
Parent-adolescent relationship. As the peer culture becomes more influential when individuals transition from late childhood to early adolescence, it is important to note the contributions of significant adult relationships. While peers have in increasingly greater impact on self-esteem in early adolescence, the influence of parental support does not decline (Harter, 2006a). Research has demonstrated that the lack of both parental and peer support predicts low self-worth, hopelessness, and depressed affect (Harter, 2006b). In a sample of adolescents, Laible, Carlo, and Raffaelli (2000) found that students were best adjusted when reporting high levels of both parent and peer attachment when compared with students who reported low levels of parental and peer attachment. The findings, however, also
demonstrated that adolescents were better adjusted when they reported high peer attachment but low parent attachment when compared with adolescents who reported low peer
attachment but high parent attachment (Laible et al., 2000).
seventh to eight grade, Roeser and Eccles (1998) found that perceptions of teacher support were related to increases in self-esteem and decreases in anger and depressive symptoms. Another longitudinal study of students from sixth to eight grade demonstrated the significant influence of teacher support, in that student perceptions of increased levels of teacher support were associated with decreases in depression and increases in self-esteem (Reddy, Rhodes, & Mulhall, 2003). In addition, Harter (2012) found that higher self-esteem in adolescent
students was related to having experiences with teachers who demonstrated interests in meeting both psychological and academic needs of the students.
School climate factors. When considering poor social experiences, it is important to examine additional social factors that contribute to the school environment. The literature related to overt and relational bullying and victimization at school is expansive. Personal forms of victimization are identified as hassles in the school climate (G.L. Bowen & Richman, 1995). The literature consistently reveals that poor adjustment is associated with peer victimization (Hawker & Boulton, 2000; Prinstein, Boergers, & Vernberg, 2001). Two major forms of bullying – overt and covert – have been researched extensively. Bullying through overt aggression involves the threat of or actual physical violence, whereas covert or relational aggression involves manipulating and controlling social relationships in order to harm an individual’s social reputation and/or promote exclusion (Crick, 1997; Crick & Grotpeter, 1995; Xie, Swift, Cairns, & Cairns, 2002). Because peer relationships play such a significant role in adolescent development, overt victimization likely leads to internalization of negative peer appraisal, which leads to depression, loneliness, anxiety, low self-esteem, and low self-efficacy (Boivin, Hymel, & Bukowski, 1995; Hodges, Boivin, Vitaro, &
2003). On the other hand, being bullied may instead lead to desires for retaliation, thus resulting in externalizing problems such as self-control problems, anger, or oppositional behavior (Crick & Bigbee, 1998; Crick, Grotpeter, & Rockhill, 1999). In comparison to overt bullying, outcomes of relational bullying are similar to the internalizing effects seen in overt bullying, in that correlated variables involve depression, loneliness, and self-restraint difficulties (Crick & Bigbee, 1998; Crick & Grotpeter, 1995). Victims of both overt and relational aggression tend to feel lonely and depressed, fear negative peer evaluation, avoid social interactions, experience externalizing problems, and have lower levels of self-esteem (Storch et al., 2003).
Similarly to those who have been rejected by their peers, adolescents who avoid peer interaction are also at risk for negative outcomes. As children progress through elementary school, avoidance of social situations is increasingly associated with negative peer
perceptions and difficulty with peers (Hymel, Rubin, Rowden, & LeMare, 1990; Rubin & Mills, 1988). One study found that children were most at risk for developing depression and internalizing disorders when they purposefully avoided interactions with peers (Rubin, Bukowski, & Parker, 1998). Social avoidance, or withdrawn behavior, becomes increasingly associated with rejection by peers as a child enters early adolescence (Rubin et al., 1998), and those who experience both avoidance and rejection experience feelings of social isolation and loneliness (Deater-Deckard, 2004; Rubin et al., 1998).
Racial/Ethnic Factors in the School Environment
Allen, & Aber, 2006) and may experience discrimination from peers and teachers on a daily basis (Eccles, Wong, & Peck, 2006; Portes & Rambaut, 2001; Quintana & Vera, 1999; Wong, Eccles, & Sameroff, 2003). Forms of discrimination range from subtle to overt, which leads to various maladaptive outcomes. Effects from perceived prejudice and discrimination on minority youth include lower participation in school activities, increased problem behavior, lower academic engagement, and creation of a hostile learning
environment (Eccles et al., 2006; Graham & Hudley, 2005; Neblett, Philip, Cogburn, & Sellers, 2006; Phelan, Davidson, & Yu, 1998; Wong et al., 2003).
Racial/ethnic minorities and socio-emotional outcomes. Discrimination often provides barriers for racial/ethnic minority adolescents to feel positively about themselves. Especially as peers are a major source of feedback for self-evaluation and identity
As children progress through school, they develop a more complex view of race and ethnicity. As early as elementary school, children are able to not only consider differences in appearance, but they also categorize individuals based on non-observable cultural and ethnic features, such as shared language and traditions (Quintana, 1998). When children gradually develop their understanding of race and ethnicity, they also increase their positive attitudes toward their own racial/ethnic group (Meece & Daniels, 2008) and become aware of discrimination (Brown & Bigler, 2005). Adolescents begin to refer to their ethnic group using more collective personal pronouns, such as “us” and “we,” until they develop a more multicultural perspective later in life (Quintana & Vera, 1999).
A strong sense of racial/ethnic identity in minority youth tends to bolster their self-esteem (Gray-Little & Hafdahl, 2000; Phinney, 1995; Rowley, Sellers, Chavous, & Smith, 1998; Twenge & Crocker, 2002). Ethnic community has been shown to be important to ethnic identity development. Relationships and friendships during adolescence are formed based on shared interests, values, and beliefs, thus those from shared racial/ethnic identities tend to form relationships with one another (Kinderman, McCollom, & Gibson, 1996). When a community lacks cohesiveness, or a sense of kinship, adolescents may struggle to find something within their culture with which to identify (Kroger, 2000). In addition, a lack of fit between culture and school expectations is often the case for American Indian/Alaska Native students, who often feel they need to choose between their cultural values and school values (Thornton, Collins, & Dougherty, 2006). In fact, early research indicated that
Racial/ethnic stratification. When examining racial/ethnic social context, it is
essential to consider the stratification systems within the broader population. Based on the American Community Survey (2011), Caucasians are the largest racial/ethnic group (72%, US Census 2010b) in the United States and historically have significant social and economic advantages in comparison to other racial/ethnic groups (McMahon, Paisley, & Molina, 2010). Racial/ethnic minorities have been historically marginalized and they have consistently experienced significant discrimination and socioeconomic disadvantage. Native Americans and Mental Health
The general term Native American refers to American Indian and Alaska Natives in the United States. According to the United States Census Bureau (2010b), there are
approximately 5.2 million self-identified Native Americans and Alaska Natives, alone or in addition to one or more other races, and this population is growing. This heterogeneous population is made up of approximately 560 federally recognized tribes and several hundred state-recognized tribes (Bureau of Indian Affairs, 2002). Often, this racial/ethnic term relates more to cultural lifestyle than physiological heritage (Garrett, 2010).
poverty and deprivation, limited educational and social resources, and geographic isolation (Garrett, 2010; Hays & Grimmett, 2010; Sider, 2003). In an effort to remedy the destructive results of the Dawes Severalty Act, the 1934 Indian Reorganization Act was developed and implemented (Sider, 2003). Unfortunately, many tribal communities were disintegrated, making it difficult for the government to organize and identify members. Thus, stringent tests were used to identify those of Indian descent by percentage of Indian blood (Lowery, 2009; Sider, 2003). This Act posed as a major barrier for many tribes who sought federal recognition.
The chronic and severe stressors outlined briefly above appear to have a significant impact on mental health of Native American youth (Whitbeck, Yu, Johnson, Hoyt, & Walls, 2008). The literature consistently indicates that, in comparison to Caucasian and other youth, Native Americans are at an increased risk for various mental health disorders. One research area that has received significant attention is the high prevalence of substance abuse among Native Americans (Nelson, McCoy, Stetter, & Vanderwager, 1992; Costello, Farmer, & Agnold, 1998; Moncher, Holden, & Trimble, 1997). The rate of alcoholism has been found to be twice that of the general population (Garrett, 2010) and Native American adolescents start these drinking habits earlier than non-Native American youth (Beauvais, 1998). In a longitudinal study of Native American adolescents, perceived discrimination was indicated as a significant stressor that predicted early drinking (Kessler, Mickelson, & Williams, 1999). Across the United States, youth who identify as American Indian/Alaska Native consistently report the highest rates of tobacco and other drug use, including marijuana (Gruber,
Unger et al., 2003). Another study found that the combination of substance use disorders and conduct disorders affect approximately one fourth of Native American children in mid-adolescence (Whitbeck et al., 2008).
Native American youth also experience significant levels of stress and anxiety compared to their Caucasian counterparts. Anxiety has been shown to occur at higher rates in the Native American youth population when compared to non-Native Americans
(Zvolensky, McNeil, Porter, & Stewart, 2001). The literature suggests that this increased prevalence in anxiety, particularly trait anxiety (Zvolensky et al., 2001), may be attributed to the significant stress related to clashing traditions and values between Native American and Western cultures (McNeil, Kee, & Zvolensky, 1999), which has been referred to as
“culturally-related” anxiety (McNeil et al., 1999). When Native American youth are immersed into the Western culture, they experience cultural discontinuity, which tends to lower self-esteem, create internal discomfort, and promote a sense of inadequacy for these individuals (Deyhle, 1992; Hornett, 1990; Sanders, 1987; Whitbeck, Hoyt, Stubben, & LaFromboise, 2001). In addition, discrimination may remind Native American adolescents of their significant historical losses and their lower social status in the dominant society, which can lead to internalizing symptoms (Whitbeck, Walls, Johnson, Morrisseau, &
McDougall, 2009). Related to anxiety and stress, Native Americans are also at a higher risk for suicides, as recent data indicate that suicides are 190% higher for Native Americans compared with all other races/ethnicities in the United States (Garrett, 2010).
Lumbee Native Americans
Historical overview. The Lumbee tribe is among the largest tribes in the United
According to the 2010 United States census, the Lumbee tribe is the eighth largest tribe when calculated for members identifying with only one tribe. The tribes with the most members identifying with only one tribe include the Navajo (286,731), Cherokee (284,247), Mexican American Indian (121,221), Chippewa (112,757), Sioux (112,176), Choctaw (103,910), and Apache (63,193) (Norris et al., 2012). Taking into account multiple group membership, approximately 73,000 individuals identify as only Lumbee or in combination with one or more other races and they rank as the eleventh largest tribe when considering members identifying in any combination with other races (US Census, 2010b).
Given that specific Lumbee Indian linguistic and cultural data have not been well documented, the tribal origin and early history of the Lumbee tribe is unclear (Peck, 1972). The earliest documentation of the Lumbee tribe dates back to a map prepared by John Herbert in 1725, which identifies Indian communities in the area of Drowning Creek, North Carolina, presently known as the Lumber or Lumbee River, which runs through present-day Robeson County (Brooks, 2009). In 1754, a local newspaper recognized the area of
Drowning Creek to be a Cheraw settlement, which is the Lumbee’s ancestor along with related Siouan-speaking Indians (Brooks, 2009). While the Lumbee tribe historically settled in several southeastern North Carolina counties, including Hoke, Cumberland, and Scotland, Robeson County is considered their home (Coyle, 1984; Sider, 2003). Robeson County is demographically unique because it is one of the approximately 10% of United States counties that is described as majority-minority in that less than 50% of the county population is non-Hispanic white (Pollard & Mather, 2008). In Robeson County, the racial/ethnic
considered rural and poor, with a poverty rate nearly twice that of the state average at 31.1% in 2009 (US Census, 2010a).
The quest for federal recognition has been a significant struggle for the Lumbee Indians (Brooks, 2009). In their efforts to define their cultural origins for recognition, the Lumbee tribe has been known by several names. The state of North Carolina recognized the Lumbee people as Croatan Indians of Robeson County in 1885, resulting in the establishment of separate Indian schools (An act to provide for separate schools, 1885; Brooks, 2009; Dial, 2005). From 1885 to 1911, their Croatan name referred to the members as descendents of intermarriages between Indians of Croatan and Whites of the Lost Colony (Sider, 2003). For a short time (1911-1913), they were known as the Indians of Robeson County (An act to change the name, 1911), though this title evoked questions of which Indians this name was referring (Sider, 2003). According to Sider (2003), the Lumbee Indians were referred to locally as Siouan Indians of the Lumber River in the 1930s, which, based on anthropological and historical investigations, “is the most historically accurate” (p. 5). From 1913 to 1953, the Lumbee tribe was known as the Cherokee Indians of Robeson County (An act to restore to the Indians, 1913), a name that was based on a history that claimed the Cherokee moved in from the mountains and fought against the White people in Robeson County, intermarried, and settled in the area. Finally, from 1953 to the present, they have been known as Lumbee Indians of North Carolina (An act relating to the Lumbee Indians of NC, 1953).
those who did not flee to the north to join the Iroquois confederacy after the Tuscarora War in 1711-1713 (Lowery, 2010). While there appears to be no single reason to explain the split between Tuscarora and Lumbee tribes, one explanation may be the pattern of Native
American individuals claiming and turning away from their histories as strategic tactics to either accommodate or oppose the White-dominated power structure (Sider, 2003). Tuscarora maintain a history of ancestral descent from Indians and not intermarriages between Indians and Whites (Sider, 2003). Another factor that may, in part, explain the division is class line, with poorer and more rural Native Americans identifying as Tuscarora than Lumbee (Sider, 2003). According to Dial and Eliades (1996), the faction of Tuscarora in Robeson County wanted to be recognized this way in order to gain assistance as part of the Tuscarora Nation of New York, whose members in New York are eligible for federal
services (Bureau of Indian Affairs, 2010).
with the United States government and are eligible for funding and services through the Bureau of Indian Affairs (2012). Various programs and services for Native Americans provide assistance to federally recognized tribes, including those that address housing, healthcare, and education (Sider, 2003). As a non-recognized tribe, the Lumbee people are not able to receive funding or services through the Bureau of Indian Affairs. Current Lumbee leaders continue their efforts to obtain full recognition through federal legislation (Brooks, 2009). Most recently, the Lumbee Recognition Act (2011), which would extend federal recognition to the Lumbee tribe, was reintroduced to the US House of
Representatives and the US Senate in January 2011 and June 2011, respectively (Lumbee Recognition Act, 2011). Both the House and Senate convened without taking action on this Act in 2011.
The Lumbee tribal culture. Unlike their explicit journey for federal recognition, the
One pivotal historical account, which varies in detail based on the author, is that of the Lowry War. Henry Berry Lowry was a Lumbee Indian in Robeson County in the mid- to late nineteenth century (Oakley, 2006). At that time, Lumbee Indians were considered “free persons of color” and, as a result, had relatively few rights compared to their White
counterparts (Lowery, 2010; Oakley, 2006). Along with few rights, Lumbee Indians were recruited to forced labor camps by White recruiters, who often used malicious and violent means to obtain low-wage labor (Dial & Eliades, 1996). By the end of 1863, the Lumbee tribe viewed the government as oppressive. They were also suffering from deprivation of freedom and material necessities, including food. Consequently, racial tensions between Lumbee Indians and White Robeson citizens intensified (Dial & Eliades, 1996). After the death of family members during recruitment efforts, allegedly false accusations of robbery, and terrorizing tactics used against his family, Lowry formed a band of outlaws. “Today, a century later, most Lumbee people view Lowry as a ‘Robin Hood’ and most whites see him as the ‘devil incarnate’” (Dial & Eliades, 1996, p. 58). Lowry and his band are described to have a “unique style of its operations – elegant, simple, apparently fearless – confronting the White upper classes both with their crudity and with their terrified helplessness” (Sider, 2003, p. 162). All in all, they retaliated for past injustices against the Lumbee Indians (Dial & Eliades, 1996; Sider, 2003).
lawlessness and terror, though the Lumbee Indians viewed him as a fearless leader who fought oppression (Dial & Eliades, 1996). According to Evans (1995):
The Lowrys clearly made an impact…on the home territory of the Lumber River Indians. They appeared on the scene at a particularly difficulty period in the history of the Indians…With the triumph of a frankly racist party during Reconstruction, it appeared that nothing could stop the winners from putting the Lumbee River Indians into the same half-free ‘place’ in which they generally succeeded putting blacks. But this effort failed…to a great extent because of the bold deeds of the Lowrys, which filled the Lumber River Indians with a new pride of race, and a new confidence that despite generations of defeat, revitalized their will to survive as a people (p. 259). The Lumbee tribe has many unique cultural characteristics that stem from their pride in the Lowry leadership and history of political and social struggles (Dial & Eliades, 1996). The Lumbee members are known to be prideful, honorable, and loyal (Blu, 1980), along with other attributes. In a qualitative study of the Lumbee Indians in Robeson County, Peck (1972) elucidated four cultural themes from interviews with tribal members (n = 39, mean age: 43.1 years). First, “Home is Robeson County,” is described in the following passage:
In Robeson County, the Lumbee Indian knows both what he is not, and what he is. He has a place, an Indian place, in the triethnic social structure. There are no expectations of feathered headdress, basket weaving, and silver work, no questions of which tribe or reservation, chief or language. To be Lumbee is to be understood and accepted. To be Lumbee is to be an Indian (p. 66).
young men (Humphrey & Kupferer, 1982; Peck, 1972). The woman, on the other hand, is expected to be the head within the household, meaning that she is to care for the children, maintain respectful relationships with the church, and hold her husband accountable. Aggression is also encouraged in both men and women because Lumbee are described as proud to “fight if challenged and challenge if tread upon” (Peck, 1972, p. 68). Lumbee tend not to back down from challenges and the importance of courage is strongly supported in their culture, which may stem from their pride in the Lowry culture (Dial & Eliades, 1996). Lumbee are known to be action-oriented, which is outlined in the final theme, “Now for Now.” While quick to react, the Lumbee try to strike a balance between long-term goals and short-term pleasure, finding an appropriate balance of delayed gratification and
accountability.
The well-articulated themes described by Peck (1972) have been echoed in other descriptions of Lumbee cultural characteristics. The action-oriented and aggressive themes have led researchers to hypothesize that these values may predispose them to violence (Humphrey & Kupferer, 1982; Kupferer & Humphrey, 1975). In fact, the Lumbee homicide rate has been shown to be much higher than the Robeson County rate (Humphrey &
Kupferer, 1982). On the other hand, their historical experiences of discrimination,
Lumbee adolescent mental health research. A few studies have investigated
Lumbee Native American adolescent mental health. Bryant and LaFromboise (2005) examined identity development of Lumbee high school students. They found that Lumbee adolescents develop a strong sense of, and allegiance to, their Native American identity. At the same time, they demonstrate an acceptance and understanding of White American society (Bryant & LaFromboise, 2005). West (2004) investigated social anxiety in Lumbee
adolescents and suggested that Lumbee adolescents experienced overall lower levels of social anxiety than non-Indian comparisons, except when situations involved new
experiences or new people. Specifically, Lumbee adolescents reported higher levels of social anxiety in situations that involved meeting new peers, talking to new people, and doing something in front of others. On the other hand, they experienced less social anxiety related to fear of negative evaluation by peers, which does not support previous research finding higher levels of trait and social anxiety in Native American young adults (Zvolensky et al., 2001). In addition, West (2004) found that Lumbee adolescents who experienced more social anxiety reported higher levels of depression and lower levels of self-esteem, further expanding the literature that supports the importance of social experiences on socio-emotional adjustment outcomes. These outcomes were unrelated to ethnic identity
development, suggesting that ethnic identity does not relate to such psychological domains in the early stage of development (i.e., early adolescents), though it likely plays a more
In general, across races/ethnicities, the literature demonstrates the significant influence of social experiences and mental health during adolescence. When considering adolescent social dynamics, however, it is important to examine the social context in which the adolescents spend the majority of their time, namely school. The sense of belonging and community that students feel within their school context plays a significant role in social experiences and related socio-emotional outcomes.
School Racial/Ethnic Composition
As a result of the Supreme Court landmark case of Brown vs. the Board of Education
in 1954, students in the United States have been granted equal access to educational opportunities regardless of race/ethnicity. Since then, there has been continuous debate regarding racial diversity in schools (Rothstein, 2004). A series of studies sampling African American and Caucasian students in integrated schools found that as the proportion of minority group students increased in a classroom, the number of cross-race friendships increased (Hallinan & Smith, 1985; Hallinan & Teixeira, 1987a, 1987b). Similar findings were outlined in studies sampling Latino and Asian students as well (e.g., Kao & Joyner, 2004; Moody, 2001; Mouw & Entwisle, 2006), though increases in the percentage of minority students may lead to “us” versus “them” perceptions (Graham et al., 2009). As such, it is important to understand further the relationship between student outcomes and racial/ethnic composition of schools.
A cognitive theoretical perspective on school racial/ethnic composition illustrates the relationship between diversity and academic outcomes. Specifically, diversity in school composition occurs through desegregation and support of racial/ethnic heterogeneity
by Piaget’s (1983) theory of cognitive development, which involves exposure to new and conflicting ideas that challenge and/or contradict one’s understanding of everyday life, resulting in a resolution of a new understanding. Consistent with the cognitive perspective, the literature demonstrates that increased heterogeneity in school contributes to better academic outcomes. Exposure to new experiences promotes cognitive development to incorporate and accommodate new perspectives. Considering diversity in school
composition, being surrounded by multiple perspectives gives students more opportunities to expand their intellectual capacities (Benner & Crosnoe, 2011, Gurin, Dey, Gurin, & Hurtado, 2003).
While the diversity perspective provides evidence for academic advantages, it does not address the relationship between school racial/ethnic composition and socio-emotional outcomes (Benner & Crosnoe, 2011). Research consistently demonstrates that student socio-emotional well-being has both short- and long-term effects on later educational success (Konold & Pianta, 2005; Rouse, Brooks-Gunn, & McLanahan, 2005). Consequently, it is essential to broaden the view of school composition influences beyond academics to better understand the socio-emotional domain of student functioning.
In contrast to the diversity perspective that highlights cognitive effects, the
(Nickerson & Nagle, 2005). Peer group acceptance is imperative for a young teenager’s psychological survival since it promotes feelings of group belonging and accompanying positive outcomes, such as a secure context in which the adolescent develops individual identity (Benner & Crosnoe, 2011; Micucci, 2009; Wentzel & Caldwell, 1997).
According to peer cluster theory (Oetting & Beauvais, 1987), peer groups form based on shared values, beliefs, and attitudes. In fact, research on homophily indicates a preference for friends similar to oneself along many dimensions (Hallinan & Williams, 1989; Kandel. 1978; McPherson & Smith-Lovin, 1987; Tuma & Hallinan, 1979). Further, the literature suggests that adolescents’ sense of belonging relates to similar cultural characteristics based on racial/ethnic composition of students within the school context (Singleton & Asher, 1979; Rubin et al., 2006; Shrum, Cheek, & Hunter, 1988). Rosenberg considered the reciprocal relationship between personal characteristics and the environment when he proposed that characteristics of the social context based on race/ethnicity composition of schools have an effect on adolescent self-perceptions (Rosenberg, 1975; Rosenberg & Simmons, 1971). For example, African American individuals in schools that are predominately composed of Caucasian students report lower self-esteem than their comparison peers enrolled in schools composed predominantly of similar race/ethnicity peers (Rosenberg, 1975).
stronger sense of belonging to and felt more a part of the school community in schools with greater proportions of their same race/ethnicity peers. “Race and ethnicity are highly salient aspects of both social and personal identity, and similarly with one’s classmates along such dimensions is no doubt important in generating a sense of belonging and membership in a school” (Johnson et al., 2001, p. 322). These studies support the notion that adolescents show strong in-group preferences in social interaction and the formation of friendships (Hallinan & Williams, 1989; Schofield, 1979; Tajfel, 1978).
Belongingness and Socio-emotional Outcomes
Rosenberg’s dissonance theory clearly suggest that racial/ethnic school composition will promote socio-emotional adjustment of minority adolescents when schools are composed of more same-race/ethnicity peers.
Native Americans and Belongingness
Few studies have examined school composition with the Native American tribal populations. In a study comparing Native American high school students enrolled in a Navajo reservation (99% American Indian; Navajo and Ute tribes) and majority Anglo high school (47% Indian), those in the Navajo reservation school experienced less racial conflict (Deyhle, 1992). The reservation school also had a higher retention rate. The authors suggested that the higher proportion of same-race/ethnicity peers at the reservation school and the surrounding reservation culture related to increased feelings of security and support within the school context. In contrast, the Native Americans enrolled in the non-reservation public school experienced daily racial conflict and feelings of rejection, which was
determined to be a factor in the decision to drop out of school (Deyhle, 1992). Another study examined late elementary and early middle school Native American students from northern Midwest and Canadian reservations. Results indicated that positive school adjustment remained stable for Native American children enrolled in tribal schools, whereas those who attended public school showed a decline in school adjustment over time. Higher levels of discrimination were found in public schools, which had a significant negative impact on school adjustment, thus suggesting that Native American youth experienced protection from discrimination in tribal schools (Crawford, Cheadle & Whitbeck, 2010).
definitions of success may vary between the two cultures (Vogt, Jordan, & Tharp, 1987), because Western culture schools promote socialization for independent success whereas Native Americans may define success as contributions to family or tribe (Deyhle &
Margonis, 1995). There tends to be a lack of fit between Western culture schools and Native American students, particularly with school failure and dropouts (Whitbeck, et al., 2001). These results support Ogbu’s (1978) concept of a caste-like position for minorities,
particularly Native Americans, who have experienced significant historical social, political, and economic discrimination that results in an internalization of an inferior status compared with the dominant racial/ethnic group. In addition, lacking a sense of belonging leads to a lack of close friends, which has been shown as a risk factor for Native American children across several tribes (Hektner & De Jong, 2007), leading to increased substance use, anxiety, low self-esteem, and depression (Freshman & Leinwand, 2001). It has been suggested that decreased sense of belonging is an underlying factor for the higher prevalence of substance use, anxiety, and distress (Hektner & De Jong, 2007).
2001, p. 50), have been shown to reduce substance use and other negative behaviors.
Independent of enculturation, self-esteem has been associated with school success for Native American children and adolescents (Whitbeck, et al., 2001).
A sense of belonging and community is critical for the well-being and positive social development of Native American youth, primarily due to their numerical minority status and their historically inferior societal position (Benner & Crosnoe, 2011). Based on the previous literature expanded on above, it appears that the proportion of same-race/ethnicity minority children at school plays a major role in socio-emotional adjustment factors. Having more same-race/ethnicity peers in school promotes socio-emotional well-being among students (Benner & Crosnoe, 2011; Goldsmith, 2004). In fact, the National Academy of Education (Linn & Welner, 2007) suggests that a 15% minimum threshold for racial/ethnic
representation attempts to protect against feeling unwanted and isolated, and decreases potential racial/ethnic hostilities. Moody (2001) explored the relationship between
racial/ethnic heterogeneity in schools and friendship segregation. The results indicated that levels of friendship segregation decreased in schools with more than two races, and schools with only two races were more likely to increase friendship segregation and create “us v. them social dynamics” (Moody, 2001, p. 708). While the literature appears to support increasing heterogeneity across races (Benner & Crosnoe, 2011; Benner, et al., 2008;
Goldsmith, 2004; Johnson, et al., 2001; Rosenberg, 1975), only a few studies have addressed this topic utilizing Native American populations (e.g., Bryant & LaFromboise, 2005). Furthermore, little is known about differences across Native American groups.
Native Americans by a single culture (Whitbeck, Hoyt, Johnson, & Chen, 2006). Across the tribes, there is diversity among culture, language, geographical dispersion, values,
economies, spirituality, beliefs, histories, and levels of acculturation (Whitbeck et al., 2006). Ignoring the unique variations among tribal cultures and aggregating all tribes into a single racial/ethnic category is disrespectful and insensitive research (Whitbeck, 2011). As an example of respectful and sensitive research to understand health disparities, there has been a strong emphasis on calling for research to study Native Americans nation-by-nation and culture-by-culture (Barlow & Walkup, 2008; Beals, Manson, & Mitchell, 2003; Colarossi & Eccles, 2003; Everett, Proctor, & Cartmell, 1983; Whitbeck, 2011; Whitbeck et al., 2006). Consistent with these research values, the current study will examine socio-emotional outcomes of a particular Native American tribe, the Lumbee, a group that has been the focus of little systematic research attention, whether on the topic of the proposed research or on other topics.
Lumbee Native Americans and School Racial/Ethnic Composition
The history of segregated community schools for the Lumbee Indians has played a major role in shaping the tribal culture and community. Prior to 1835, Native Americans attended school with White children. Between 1835 and 1885, Lumbee Indians were
considered “people of color” and were denied access to the White schools (Peck, 1972). The Act to provide for separate schools (1885) resulted in the establishment of separate Indian schools. As a result, the Normal School for Indians was established, evolving to become Pembroke State University (Peck, 1972). Between 1887 and 1970, segregation among
North Carolina were not forced to enroll students from all minority backgrounds until 1970 and consequently Native American schools in Robeson County were among the last schools in the country to formally desegregate (Massey, 1996). The Lumbee were strong advocates for segregated schools and opposed desegregation efforts (Jones & Maynor, 2004; Massey, 1996; Oakley, 2006). Researchers have hypothesized that their opposition to desegregation was based on their strong academic success in Lumbee-only schools (Chavis, 1986), and their need to protect and preserve their tribal identity, community involvement, and unique cultural heritage (Massey, 1996; Sider, 1993; Thompson, 1973). Since the desegregation of schools, it has been shown that while desegregated schools offer more resources and
educational opportunities, Lumbee students have experienced a weaker sense of community and less culturally affirmative school environments when compared to students in segregated schools (Dial, 2005).
Rationale for Current Study
(US Census Bureau, 2010b). This study further addresses a lack of research regarding school composition and a non-reservation status tribe. Previous studies examining Native
Americans and school composition have only utilized tribes with reservation status
(Crawford, et al., 2010; Whitbeck et al., 2006). Non-reservation tribal members, such as the Lumbees, live in a community with more variable demographics and experience more acculturation than those in reservation tribes (Bryant & LaFromboise, 2005; Dial & Eliades, 1996; Sider, 2003). The uniqueness of the Lumbee culture generates curiosity related to the social experiences and psychological outcomes of adolescent students within this
community. Thus, the current study examines how the percentage of Lumbee Indians represented at school contributes to the socio-emotional well-being of these students.
Often the literature regarding Native Americans focuses on the severity of problems instead of on strengths or protective factors (Beauvais, 2000; Blum, Harmon, Harris,
Research Questions and Hypotheses
The purpose of this study is to examine the relationship between school composition and socio-emotional functioning, specifically self-esteem and adjustment, for Lumbee Native American middle school students. Because peer relationships and victimization are
significant predictors of mental health during adolescence, social experiences are
hypothesized mediators of the relationship between the proportion of Lumbee students and socio-emotional outcomes.
To further isolate the school and social variables of interest, potentially confounding variables specific to the child, family, and school were controlled for. Though attachment processes shift more toward peer relationships during adolescence, parents are still an
essential support system during this developmental period. In addition, there is evidence that teacher-student relationships have an impact on socio-emotional outcomes for youth (Harter, 2012; Huang, 2011). Therefore, perceived parent and teacher support were controlled for. Because outcomes and school racial/ethnic composition may vary by the age of students, age was controlled for in the analyses. Gender, individual free/reduced lunch status, and school grade composition (e.g., K-6 grade school and 6-8 grade school) were used as control variables based on their use in prior research (Benner & Crosnoe, 2011).
Consistent with the belongingness perspective and the reviewed literature regarding school racial/ethnic composition, it was hypothesized that socio-emotional outcomes are better for Lumbee Native American students in schools with higher proportion of their same-race/ethnicity peers. In addition, it was expected that the social experiences of friend
self-esteem and adjustment. Peer group acceptance, friend support, and respectful school climate were expected to positively predict self-esteem and adjustment. The research questions addressed and related hypotheses are presented below.
Research question 1. The first research question asked whether there is a minimum racial/ethnic representation threshold of Lumbee students at school that relates to student adjustment and student self-esteem.
Hypothesis 1a. There will be a positive relationship between the proportion of
Lumbee students in school and student adjustment with a minimum threshold identified at or above 15%.
Hypothesis 1b. There will be a positive relationship between the proportion of
Lumbee students in school and student self-esteem with a minimum threshold identified at or above 15%.
Research question 2. The second research question asked whether the school racial/ethnic composition impacts adjustment of Lumbee students when taking into account peer social experiences. To examine this question it is also important to include potential confounding variables, including perceived parent and teacher support, student age, gender, individual free/reduced lunch status, and school grade composition.
Hypothesis 2a. Lumbee students in schools with a higher proportion of Lumbee students will report higher levels of adjustment when controlling for perceived parent
support, teacher support, student age, gender, individual free/reduced lunch status, and school grade composition.
school climate experiences when controlling for perceived teacher and parent support, student age, gender, individual free/reduced lunch status, and school grade composition.
Research question 3. The third research question asked whether the school
racial/ethnic composition impacts self-esteem of Lumbee students when taking into account peer social experiences. To examine this question it is also important to include potential confounding variables, including perceived parent and teacher support, student age, gender, individual free/reduced lunch status, and school grade composition.
Hypothesis 3a. Lumbee students in schools with a higher proportion of Lumbee students will report higher levels of self-esteem when controlling for perceived parent
support, teacher support, student age, gender, individual free/reduced lunch status, and school grade composition.
CHAPTER III Method Participants
Participants were recruited as part of a larger study designed to prevent youth
violence in a large, rural county with a high rate of poverty. During the 2010 to 2011 school year, the Robeson County school district provided the primary investigators of the larger study with a list of all students in sixth, seventh, and eighth grades. Participants were enrolled in 19 public schools in Robeson County. Data on the schools and students are provided in Appendix D (NCDPI, 2011). The most recent teacher demographic information from the 2007-2008 school year for Robeson County was 32% Indian (n=518), 1% Asian (n=24), 2% Hispanic (n=30), 17% Black (n=272), and 48% White (n=772).
Data from the current study were from wave one of the larger five-year study.
Participants included the 1080 self-identified Native American students in grades six through eight from the 19 schools in Robeson County. The Native American participants were relatively equally distributed across gender (50.5% female) and grade (33.5% in 6th grade, 33.2% in 7th grade, 32.9% in 8th grade). Approximately 70% of Native American student participants received free and reduced price lunch at school, which is similar the percentage of students receiving free and reduced price lunch in the full sample.
vast majority of the sample identifying as Native American is Lumbee Indian, the participants will be referred to as Lumbee.
Procedure
As part of the larger study and in compliance with the school district policies, parents were sent information about the study (see Appendix A). Data were collected between March and June of 2011 during a scheduled time at the participants’ respective school computer labs, which took approximately 30-40 minutes. An assent script was presented orally to all students as well as electronically on their computer screens (see Appendix B). Participants indicated assent by clicking their mouse on a button labeled, “yes,” before being able to begin the questionnaire. Next, participants individually completed the School
Success Profile-PLUS (SSP-PLUS). Trained research assistants administered the
questionnaire in a standardized, confidential way and were available to address any questions about items during the administration. After completing the assessment, they were also provided with information about how to contact the University of North Carolina Behavioral Sciences Institutional Review Board (IRB) (see Appendix C) if they had questions or
concerns about the assessment, as previously approved by the IRB. Each participant was compensated with a $10 gift card to a local business after completing the questionnaire. Measures
well-being (Benner & Crosnoe, 2011). The proportion of Lumbee students in each of the 19 schools was derived from the school demographics reported by the North Carolina Department of Public Instruction for the 2010-2011 school year (NCDPI, 2011), and are displayed in Appendix D.
School Success Profile-PLUS (SSP-PLUS). The SSP-PLUS is a comprehensive self-report online survey questionnaire and is designed to obtain information from
adolescents regarding their psychological and physical well-being, school performance, and their perceptions of their social environment, including neighborhood, school, peer system, and family. The SSP-PLUS is an adapted and online version of the School Success Profile (SSP) (G.L. Bowen & Richman, 1995). The majority of the needs assessment scales came from the School Success Profile (Bowen, Rose, & Bowen, 2005), which gathers information about each student’s neighborhood, school experiences, friends, and family, and beliefs about himself or herself. The SSP assesses 22 core dimensions related to the individual’s
adaptation and social environment (G.L. Bowen, Rose, & Bowen, 2005). The SSP-PLUS included additional scales that were not used in the current study.
indicated high internal consistency reliability across dimensions, in that all but one of the 22 scales had reliability coefficients above 0.70. In terms of validity analyses, the results strongly supported evidence for both convergent and divergent construct validity. Because this measure has not been used extensively with the Native American population, internal reliability analyses were completed for both outcome variables. Specifically, the coefficient alpha internal consistency estimate was computed for the adjustment and self-esteem
subscales. The coefficient alpha value for adjustment was 0.893, and for self-esteem was 0.884, indicating satisfactory reliability for each subscale.
The following subscales were included in the current analyses: self-esteem,
adjustment, friend support, peer relations (hereinafter peer group acceptance), hassle-free school (hereinafter respectful school climate), parent support, and teacher support. The self-esteem subscale is comprised of five items that reflect a child’s confidence and satisfaction with his or her qualities and abilities. Response choices included “not like me,” “a little like me,” and “a lot like me.” The adjustment subscale is comprised of nine items that relate to a child’s feelings of anxiety, sadness, and loneliness. Response choices included “not like me,” “a little like me,” and “a lot like me.” The friend support subscale is comprised of five items that reflect the child’s perceptions of his or her support from friends, and his or her ability to confide in and count on others. Response choices included “not like me,” “a little like me,” and “a lot like me.” The peer group acceptance subscale is comprised of eight items that relate to the child’s resistance to peer pressure and feelings of being respected by peers. Response choices included “not like me,” “a little like me,” and “a lot like me.” The
being bullied at school. Response choices included “never,” “once or twice,” and “more than twice.” The parent support subscale consists of five items related to whether adults at home provide encouragement and affection to the student. Response choices included “never,” “once or twice,” and “more than twice.” The teacher support subscale is comprised of eight items related to the students’ perceptions of encouragement, respect, and support from teachers. Response choices included “strongly disagree,” “disagree,” “agree,” and “strongly agree.” The items comprising each subscale are coded so that higher scores relate to more adaptive or better outcomes, thus items on the adjustment, peer group acceptance,and
respectful school climate subscales are reverse coded. The subscale items are reported in Appendix G.
was coded based on response options of one-year intervals (e.g., “I am 12 years old,” “I am 13 years old,” etc.).
Analytic Procedure
Research question 1. In order to explore the potential trends between the proportion of Lumbee students in school and adjustment (hypothesis 1a.) and self-esteem (hypothesis 1b.), a plot of the means was provided for a visual description of the data in order to explore patterns of potential cut-off points. Proportion of Lumbee students in school was grouped based on the visual inspection of the means plot for comparison. Finally, one-way analyses of variances (ANOVAs) were conducted to test for any statistically significant differences between means to determine cut-off points.
Research questions 2 and 3. Structural equation modeling (SEM) was used to address research questions two and three. SEM is an appropriate and valuable tool for testing mediation models of constructs measured with multiple observed variables (i.e., scales). In SEM, observed or latent variables can serve simultaneously as dependent variables in some equations and independent variables in other equations (N. K. Bowen & Guo, 2012).
Mediation analyses allow researchers to identify the mechanisms by which environmental or individual characteristics influence outcomes (N. K. Bowen & Guo, 2012). In addition, the sample size of 1080 is adequate to meet the statistical power requirement of 0.80 put forth by MacCallum, Browne, and Sugawara (1996). Specifically, a “not close fit” may be ruled out with as few as six degrees of freedom when using a sample of over 1000 cases (MacCallum et al., 1996).