INFODEMIOLOGY TO IMPROVE PUBLIC HEALTH SITUATIONAL AWARENESS:
AN INVESTIGATION OF 2010 PERTUSSIS OUTBREAKS IN CALIFORNIA, MICHIGAN AND OHIOJennifer Olsen
A dissertation submitted to the faculty of the University of North Carolina at Chapel Hill in partial fulfillment of the requirements for the degree of Doctor of Public Health in the UNC
Gillings School of Global Public Health.
Chapel Hill 2013
Approved by:
Courtney D. Corley, Ph.D.
Kristen Hassmiller Lich, Ph.D.
Thomas Ricketts, Ph.D.
Richard Gary Rozier, D.D.S.
ABSTRACT
JENNIFER OLSEN: Infodemiology to Improve Public Health Situational Awareness: An Investigation of 2010 Pertussis Outbreaks in California, Michigan, and Ohio
(Under the direction of Thomas C. Ricketts)
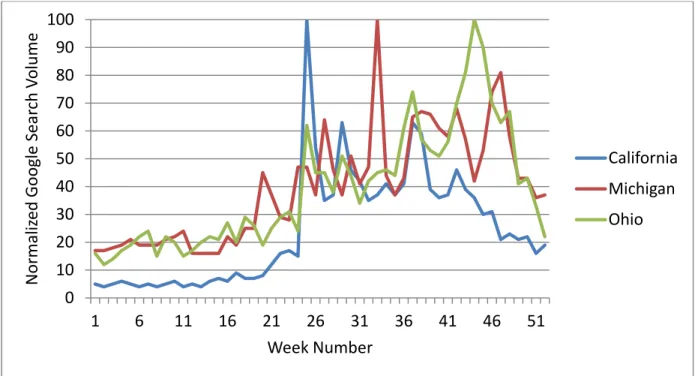
As a disease emerges, one of the greatest challenges for public health practitioners is to differentiate between a normal event and a serious outbreak. Typically, information from official sources and surveillance systems had been the only resource. More recently, the field of infodemiology has emerged with a focus on the distribution and determinants of health information on the Internet. This research compared official reports of whooping cough with infodemiology sources, specifically news articles, search engine patterns, and Twitter, to assess the timeliness, accuracy, and correlation of these content sources. Within California, Michigan and Ohio, Internet search patterns identified the outbreak of pertussis in 2010 four to eleven weeks in advance of official sources, and there was strong correlation between the epidemic curve and search pattern in Michigan and Ohio. Twitter also provided an indicator in advance of official sources in all three states, but only with a single Tweet. Using all three sources to identify indicators was better than any single source used independently.
While understanding the data utility is important, it is equally critical to understand the attitudes and perceptions amongst public health leaders regarding the use of
ACKNOWLEDGEMENTS
My personal support team has been an impetus for the beginning and sustaining of this project and to continue bringing this work to a close. I am especially thankful to my very patient husband, Ken, who has been my cheerleader, support staff, and sounding board through each step of this process. I also must recognize my parents and sister, who have sat through years of listening to me prattle on about diseases, disasters, and my dissertation. I know they are in my corner constantly, making sure I achieve any goal that I set myself. And then there are my friends, who have gotten used to me answering "No, I'm ‘dissertating’," but they have not given up on me.
My classmates in this program have become more than a random cohort; they are my friends and my teachers. Our cohort (The Sixers) is fortunate to have become a strong, cohesive unit, rooting each other to the finish line. I would have never met this
accomplished group had it not been for Amy Kircher, DrPH and Jean O'Connor, DrPH who tirelessly 'suggested' I should look into the program at UNC and that it would be worthwhile. Their 'gentle nudging' and help along the way has been invaluable to my success.
I must also thank the International Society of Disease Surveillance (ISDS), who was kind enough to distribute my survey to their membership. I recognize there are many surveys that any professional society is asked to share, and their belief in the value of my work is truly appreciated. I also owe a big thank you to my two data providers: HealthMap (namely John Brownstein and Sumiko Mekaru) and Gnip (Mark Hoy and Stuart Shulman).
TABLE OF CONTENTS
LIST OF TABLES...………x
LIST OF FIGURES………xii
Chapter 1. BACKGROUND………...………1
Research Question.………...………2
Pertussis………...………...3
2. RATIONALE………..………..5
Traditional Surveillance……….5
News Articles as a Source for Infodemiology………...9
Internet Search Patterns as a Source for Infodemiology………..11
Social Media as a Source for Infodemiology ……..………...13
3. CONCEPTUAL FRAMEWORK………...…………...16
4. LITERATURE REVIEW………21
Methods……….21
News Article Results………25
Internet Search Utilization Results………30
Blog and Microblog Posting Results ………...………36
Smartphone Application Results………...38
Discussion……….39
5. METHODS………..……….………..42
Data Collection and Processing………..………..42
Data Analysis………..………..50
6. RESULTS………..……….55
Descriptive Analysis of News Articles………...59
Descriptive Analysis of Google Search Terms………62
Descriptive Analysis of Twitter………...66
Comparative Analysis of NNDSS and News Articles……….67
Comparative Analysis of NNDSS and Google Search………..72
Comparative Analysis of NNDSS and Twitter……….80
Combined Analysis……….………….82
Analysis of Survey Results……….86
7. DISCUSSION…………...……….92
NNDSS Data……….92
News Articles………93
News Articles and NNDSS Data………..……….93
Google Search Frequency……….96
Google Search Frequency and NNDSS………...………98
Social Media……….99
Social Media and NNDSS ………..……….100
Combination of Infodemiology and NNDSS Data……….101
Survey Results………...103
Boundaries of Research………...105
Limitations in Summary………106
8. PLAN FOR CHANGE……….108
Current State of Policy and Practice………..108
Identified Need………...110
Filling the Gap – Developing an Implementation Framework………111
Elements of the Framework……….113
Conclusions………126
Appendix A: Pertussis 5-year Epidemiology Curves ……….129
Appendix B: List of Pertussis Terms………131
Appendix C: Survey Questions……….132
Appendix D: Definition of Terms………...135
LIST OF TABLES
Table 1.1. Difference between case counts in California, Michigan,
and Ohio………4
Table 2.1 Traditional and nontraditional media characteristics...……...14
Table 4.1. Specific search strings used for literature review ... 22
Table 4.2. Articles about news media findings ... 26
Table 4.3. Articles about internet search findings ... 31
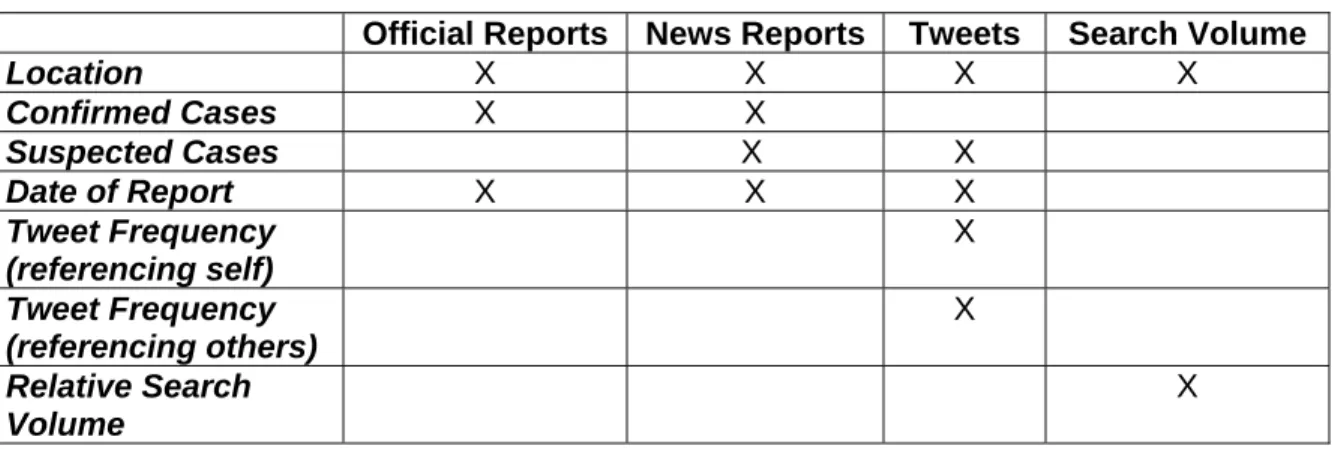
Table 5.1. Variables assessed per data source ... 51
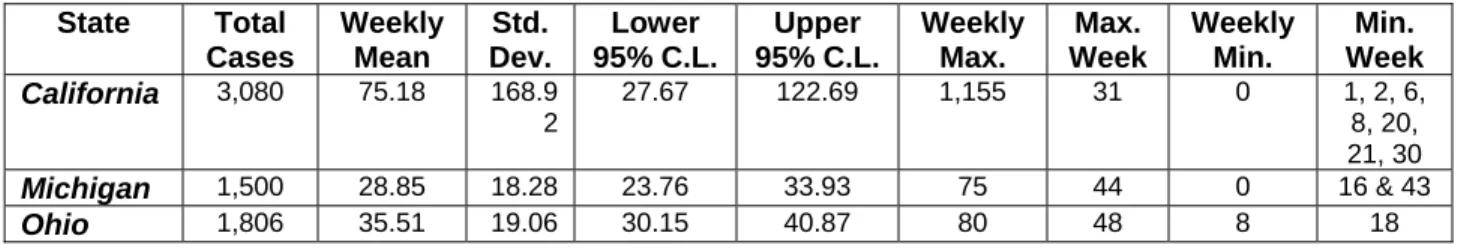
Table 6.1. Summary of findings from 2010 NNDSS tables ... 55
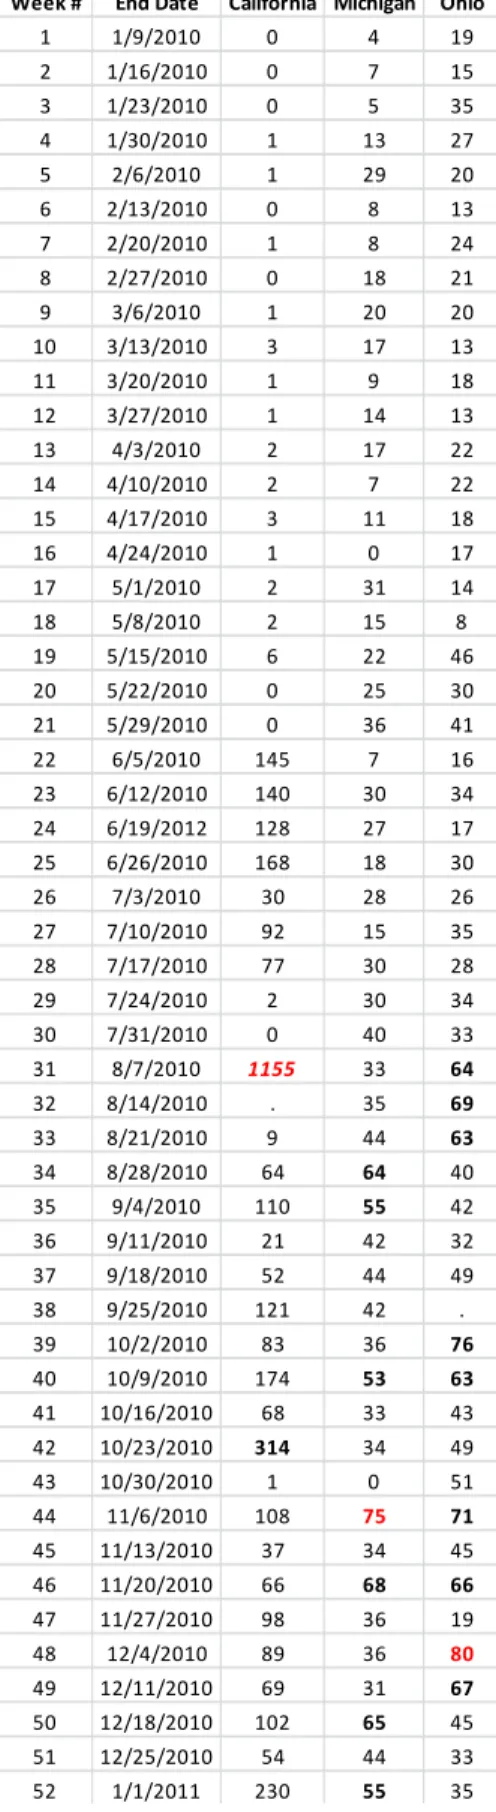
Table 6.2. Tabulated 2010 weekly pertussis case counts ... 58
Table 6.3. Novel news articles regarding pertussis in California ... 60
Table 6.4. Novel news articles regarding pertussis in Michigan ... 61
Table 6.5. Novel news articles regarding pertussis in Ohio ... 62
Table 6.6. Summary of findings from Google search frequency ... 62
Table 6.7. Weekly Google search frequency for California, Michigan, and Ohio………65
Table 6.8. Count of Tweets per state by category ... 66
Table 6.9. Relevant Tweets for California with credibility rating ... 67
Table 6.10. Comparison of peaks between NNDSS and news articles ... 70
Table 6.11. Sensitivity, specificity, and predictive values of news articles……….71
Table 6.12. Correlation coefficients for news articles ... 72
Table 6.13. Summary of comparisons between NNDSS and news articles……….72
Table 6.14. Comparison of peak weeks between NNDSS and Google search frequency………75
Table 6.17. Summary of comparisons between NNDSS and Google
search frequency………..80
Table 6.18. Comparison of peak weeks between NNDSS and Twitter ... 81
Table 6.19. Sensitivity, specificity, and predictive values of Twitter ... 82
Table 6.20. Summary of comparisons between NNDSS and Twitter ... 82
Table 6.21. Sensitivity, specificity, and predictive values of fused infodemiology sources………..85
Table 6.22. Summary of responses to question on internet tool usage ... 86
Table 6.23. Summary of responses regarding infodemiology utility. ... 87
Table 6.24. Comparison of infodemiology data for three stages of situational awareness………88
LIST OF FIGURES
Figure 1.1. United States pertussis incidence by year ... 3
Figure 2.1. The role of infodemiology in public health ... 8
Figure 2.2. Potential information timeline for disease surveillance ... 9
Figure 3.1. Situational awareness feedback loop ... 17
Figure 6.1. Pertussis epidemic curves for California, Michigan, and Ohio………...56
Figure 6.2. Pertussis weekly incidence for California, Michigan, and Ohio………...56
Figure 6.3. California epidemic curve derived from news articles ... 61
Figure 6.4. Google search frequency for California, Michigan and Ohio ... 63
Figure 6.5. Comparison of NNDSS and news article cases in California ... 68
Figure 6.6. Comparison of NNDSS and news article cases in Michigan ... 69
Figure 6.7. Comparison of NNDSS and search frequency in California ... 73
Figure 6.8. Comparison of NNDSS and search frequency in Michigan ... 74
Figure 6.9. Comparison of NNDSS and search frequency in Ohio ... 75
Figure 6.10. California NNDSS curve showing search frequency indicators ... 77
Figure 6.11. Michigan NNDSS curve showing search frequency indicators ... 77
Figure 6.12. Ohio NNDSS curve showing search frequency indicators ... 78
Figure 6.13. California NNDSS curve with infodemiology leading indicators ... 83
Figure 6.14. Michigan NNDSS curve with infodemiology leading indicators ... 84
Figure 6.15. Ohio NNDSS curve with infodemiology leading indicators ... 84
Figure 8.1. Sequence of gathering and using public health-related information………115
CHAPTER 1. BACKGROUND
The emerging field of infodemiology offers promising tools that can help public health leaders streamline the process of monitoring, processing, and utilizing unofficial sources to aid in their decision-making. Infodemiology is “the science of distribution and determinants of information in an electronic medium, specifically the Internet, with the ultimate aim to inform public health and public policy” (1). It allows practitioners to track what community members who are not public health experts communicate using the Internet in order to measure the public’s opinions, attention, behaviors, knowledge, and attitudes (1). Communication from unofficial sources, such as the Internet, may well-inform decision makers and enable others to respond proactively.
Infodemiology may be critically valuable during a disease outbreak, during which accurate information can improve decisions that can then save lives because it enables more reliable event detection and timely response. Event detection is the term used to describe the differentiation between baseline occurrence of disease and more severe outbreaks that would require a rapid response (2). Early detection of disease reduces negative impacts because this detection allows for the implementation of timely
interventions. Effective event detection also helps in decision-making regarding whether further investigation is required.
disease occurrence. Infodemiology, to be effective, has differentiate between the bad and the good that appears on the Internet, as well as fuse with information coming via “normal” channels. Incorpoating infodemiology data into public health practice may improve detection and intervention.
At an early stage of an outbreak, the significant challenge of managing information effectively during a disease outbreak occurs. Information is imperative to detecting and intervening in a disease outbreak, but the enormous amount of information that public health leaders must sift through in this limited amount of time can become overwhelming and obstructive. These overwhelming amounts of information are produced by a variety of sources (governments, news organizations, citizens) and this information is often conflicting, repetitive and/or erroneous. Because of these information challenges, public health leaders (who serve as information consumers) need to understand the usefulness of such content when there is limited time to read, comprehend, and process information for decision-making. Therefore, this is where infodemiology may prove useful.
In the disease outbreak environment, it is imperative to understand which sources of information add value and should be used for decision making in this limited timeframe. It is also important to understand whether or not unofficial sources can provide insight in
advance of official sources and if they can be used with confidence. However, monitoring of information sources is a time consuming and resource intensive activity, so any ways to simplify the process by focusing on sources with proven utility is beneficial.
Research Question
: Can infodemiology improve public health situationalawareness?
Pertussis
Pertussis is an acute bacterial disease, often contracted by children, caused by
bordetella pertussis, which infects the respiratory tract and often lasts one to two months (3).
The disease often starts with a cough that worsens, and the cough may lead to a
characteristic whooping sound upon inhalation (3). In the United States, 80% of deaths from pertussis are amongst children under one year of age, with pneumonia being the most common cause of death (3). The incubation period is seven to twenty days, and the communicability period is three weeks (3). Transmission occurs via direct contact with mucous discharge via airborne droplets (3).
The total number of pertussis cases nationwide in 2010 was 27,550 as compared to 16,858 in 2009 (4). Nationwide, pertussis has a cyclic peak every three to five years; however, the incidence in 2010 surpassed the peaks experienced in 2004 and 2005 (Figure 1.1) making it a notable year for the disease with an incidence of 8.97 cases in every 100,000 people (4).
Figure 1.1. United States pertussis incidence (per 100,000 population) by year (4)
In 2010, large localized outbreaks of pertussis occurred in California, Michigan, and Ohio (5). When compared to the previous year, these three states had a significant increase in annual case count.
Table 1.1. Difference between case counts in California, Michigan, and Ohio (4)
State 2009 Total Cases 2010 Total Cases Delta
California 896 3,080 +2,184 (+244%)
Michigan 900 1,500 +600 (+67%)
Ohio 1,096 1,806 +710 (+65%)
This significant increase (seen in detail in Appendix A) makes pertussis a potential candidate disease to study for this research. Additionally, pertussis is a nationally notifiable disease with associated lab confirmations, so there is higher confidence in National
CHAPTER 2. RATIONALE
Traditional Surveillance
Traditional surveillance is critical for the protection of populations from disease, but surveillance systems are often slow. Most surveillance systems detect signals immediately before or near the time when signals appear in gold standard data (2); this timing is not sufficient to provide an early indicator of emerging outbreaks because of the delay in appearance of gold standard data. For diseases that cause severe mortality, existing approaches to mortality surveillance do not result in disease detection in a timely way, supporting the need for new data sources to track public health impact (8). Syndromic surveillance systems, which focus on using data from chief complaints rather than diagnosis, need additional data streams to increase signal detection sensitivity without decreasing the specificity required (8). Clinic-based syndromic surveillance and microbiological testing for verification and diagnosis are also critical. Limitations of traditional surveillance systems include, but are not limited to, reporting delays, inconsistent population coverage, and poor sensitivity (9, 10).
However, traditional surveillance is necessary for estimating morbidity, mortality, and shifts in disease incidence within demographic or other groupings. In the United States, compliance with notifiable disease reporting rules varies from 9% (Invasive Streptococcus
pneumoniae in Hawaii) to 99% of cases (11) where notifiable diseases are any conditions
Notifiable Disease Surveillance System (NNDSS) run by CDC was evaluated and the median national reporting delay was forty days for pertussis (13). However, this nationwide delay is not necessarily representative of all states, since each state has a sequence of actions they take prior to reporting to a nationwide system (to include various policies and protocols) (13). In addition to state-variable reporting timelines, some states only report lab-confirmed cases, which further delays reporting (13). Another limitation of traditional approaches is that both sentinel surveillance systems and laboratory systems will likely over-report incidence in groups who are more vulnerable to the disease, therefore, making alternative surveillance methods more critical for accurate detection (14).
Due to this inherent variability between states and across diseases, the ability to depend on weekly reports from a system like NNDSS is limited, especially for multi-state outbreaks (13). Fortunately, publicly derived unofficial reporting of outbreaks can be faster than official channels and, at the same time, it can be reliable and responsive to the needs of local public health workers (15). Novel Internet based collaborative systems can have an important role in gathering information quickly to improve coverage, accessibility, scalability, timeliness, and transparency of traditional surveillance systems (16). Infodemiology data (often derived from Internet blogs, websites, query information and navigation data) can be collected and analyzed in near real-time, giving public health leaders the opportunity to put a finger on the pulse of public opinion, behavior and knowledge (1).
The Federation of American Scientists and the World Health Organization (WHO) co-sponsored an event in which a group of conference attendees created ProMED-Mail
non-share information. The WHO has credited ProMED-Mail as the source of reports on various diseases, including the outbreak of an undiagnosed disease in Pakistan in spring 2000, which was later confirmed as pulmonary tuberculosis (15). Severe Acute Respiratory
Syndrome (SARS) first became known to the Western world through a ProMED-Mail report. This report is credited with breaking the story and providing critical information that helped to rapidly identify the cause of the disease (15). The United States government endorsed the open source work of ProMED-Mail in 2001. D. A. Henderson, at the time, served as Health and Human Services Secretary. Tommy Thompson's principal science advisor for public health preparedness, congratulated the publication on being one of his office’s primary sources throughout the September 11th anthrax attacks (15).
More recently, research has found that social media sources and news media sources may provide indicators of disease outbreaks prior to traditional reporting sources (i.e. surveillance systems) (17, 17). In fact, the WHO uses informal information sources for about 65% of their outbreak investigations and relies on informal sources for daily
surveillance activities (18). Surveillance systems that utilize informal Internet-based
information have been shown to reduce the time to recognition of an outbreak and facilitate responses to disease outbreaks (19). Additionally, persons’ use of search tools such as Google® to seek information about a suspected disease or symptoms may be indicative of an emergence of a disease, and web searching may also provide early indicators of a disease (20). Furthermore, an analysis of this search tool data has the potential to capture information about people who do not seek formal medical care (21).
includes information generation, filtering, and amplification (23). In a public health context, infodemiology can empower the lay public as a source of information (1). This information can then become the content that influences other people. Additionally, because of the way that this content is collected and distributed, it can have an impact and value at the
population level (1). Thus, all of these elements contribute to a useful, potentially critical framework to utilize infodemiology (1) when preparing for and responding to disease outbreaks [see Figure 2.1].
Figure 2.1. The role of infodemiology in public health (1)
mentions or indicators of a disease are illustrated in Figure 2.2], then it would seem feasible to determine if these same sources, when combined, can be used to provide worthwhile or even early information during an outbreak. Most of the surveillance systems that were evaluated only used a single data source (2), making this multi-source investigation novel and important.
Figure 2.2. Potential information timeline for disease surveillance (104)
News Articles as a Source for Infodemiology
indicator of public health impacts provides insight into disease impacts on individuals and society in a way that is very different from official reports. Unlike these reports, news may validate the spread of a disease or condition, especially if it is something new for the community (24). Additionally, more than 64% of Americans have used online news to get information about current events (25), making web-based news a critical information sharing tool. Due to the pervasiveness of web-based news, newspaper publishers and owners are shifting their focus from providing content in paper form to an electronic form to their readers.
News media reports encompass both direct indicators of disease (such as the
number of people sick) as well as indirect indicators (such as the lack of available remedies) of societal response produced in real-time; this adds value beyond traditional approaches (17). Newspapers also have significant flexibility regarding what aspects of an event they can cover and, therefore, they are a good indicator of the general public’s interests and concerns (7, 26). Significant public concerns or fear may impact the news content, (7), can be indicative of a new health issue (24), and can identify unusual outbreaks (10). The World Health Organization (WHO) reported that between July 1998 and August 2001, 56% of the 578 verified outbreaks were first identified by the Global Public Health Intelligence Network (GPHIN), which primarily uses newspaper content (18).
surveillance and public health preparedness by turning information into useful knowledge for the public, and public health officials (9, 28, 29).
Internet Search Patterns as a Source for Infodemiology
The pattern of how and when people search the Internet has the potential to provide clues or early indicators about future concerns and expectations amongst the public (30), and has shown initial promise as a source of infodemiology content. Search query data is more timely than traditional surveillance; often taking a process that has been years in duration and moving it to real-time (31). For several reasons, it is also more efficient: it can be automatically collected in a centralized fashion and shared with officials; it does not require reporting infrastructure in each region (31); and it can be more cost effective (32). This collective phenomenon of Internet search behavior is a meaningful, robust reflection of human behavior and disease patterns across large populations (33) and the information can serve as a surrogate for traditional measures of disease burden (34). Additionally, Internet search patterns are just one potential measure of “social proof” which can determine that if many people do or think similar things (i.e. search for the same things on the Internet) then, there must be good reason (35).
Of Internet searches done in December 2011 within the United States, over 65% of those were done using Google (36). In the month of December 2011 alone, more than eighteen billion web searches were conducted in the United States, with over twelve billion of those searches done on Google (36). Over time, Internet use will expand to be a more integrated part of individual lives and the Internet will be used by more representative parts of the population as a whole (14). Because of this, Google can utilize the collective
intelligence of millions of web user logs for disease monitoring, as evidenced by influenza efforts (37) and the eventual development of Google Flu Trends
individuals who are ill but who are not (or not yet) seeking care, especially during the early stages of an illness (21); therefore, providing an accurate, low resource mechanism for surveillance (14).
In 2010, 59% of American adults sought health information online (38), and 37% accessed user generated health information online (39).This includes web 2.0 content where users supply the content that other users demand (32). To start their searches, 66% of health seekers begin with the use of a search engine (40), making search information a generalizable marker. There is some socio-demographic variation amongst those who utilize the Internet for health information as compared to those who do not: women, people with a college education, those with higher incomes, and younger people are the most likely to utilize the Internet to access health information (38). Searches for health information occur at about the same level of popularity as paying bills online, reading blogs, or looking up phone numbers and addresses, making it extremely common (40).
The online conversation about health-related topics is being driven by the availability of social web (or web 2.0) tools and the motivation of people to connect with one another, especially amongst those living with chronic conditions (38). The proportion of people who seek health information on the Internet is the best measure for health-oriented search behaviors, especially when compared to indirect measures such as proportion of
Social Media as a Source for Infodemiology
Although individual messages on social media sites contain little informational value, aggregation of millions of such messages can generate valuable insights (43). Tweets can enable real-time content analysis and knowledge collection, allowing health authorities to respond to public concerns (23) much faster than ever before. Twitter content exists within an analytical “sweet spot” in that they are long enough to provide depth and meaning, yet concise enough to facilitate rapid analysis and classification (1), which makes this another potentially valuable source of infodemiology content. Twitter has provided rapid, cheap, reliable content for assessing events from earthquakes to seasonal allergy patterns (44) to the Fort Hood shooting (45). Gupta found that 30% of Tweets posted about an event contain situational awareness content, with only 14% of the Tweets containing spam (46), while Vieweg determined that 8-24% of Tweets contained tactical, actionable information in recent events (47). This type of information may be useful for directing limited resources to reduce impacts (48), to include morbidity and mortality. Twitter enables people to rely on a crowd rather than an individual, which increases their chances of finding information they did not know existed (35). This information utility is especially true in the United States where "users in the US give Twitter a more informative purpose" (49).
quality is especially true in communities where local populations know the baseline events in their community and can rapidly identify anomalies and network to other neighbors to rapidly get “ground truth” (50); through decentralization they are able to draw on local insights (35). Social media has become a valuable resource since it can provide content that is not
otherwise available through traditional information management. It is especially valuable because the user community is self-policing to reduce misinformation (51) (see Table 2.1).
Table 2.1. Traditional and nontraditional media characteristics, adapted from Keim and Noji
(51)
Traditional Media Social Media
Information Flow Single direction (from media to public) Multidirectional
Information Control High Low
Adaptability Low High
Local Relevance Low High
Information Accuracy Variable Variable
Timeliness Delayed Immediate
socio-demographic groups which further points to the increasing need for research and standard analytical approaches.
Twitter users are disproportionately from lower income households and are more ethnically and racially diverse than the general United States population (53), making it an extremely valuable source to understand the health concerns among more vulnerable populations and in areas where the disease burden may be more significant. Additionally, since less than 10% of Twitter accounts are private and unavailable for public review and analysis (54), most accounts and their related content is available for analysis and utilization which reduces the potential for bias between public and private account content.
CHAPTER 3. CONCEPTUAL FRAMEWORK
A key element in rapidly identifying diseases is situational awareness, and this dissertation examines incorporating novel data sources to potentially improve that awareness. Situational awareness allows public health leaders to know what the current status of disease incidence is in any given area; therefore, it is important in disease identification, outbreak investigation, and prevention. Improved situational awareness can lead to better decision-making and performance (55), which will facilitate all stages of disease outbreak response. To recognize how infodemiology can improve situational awareness, a clearer understanding of situational awareness is needed.
Figure 3.1. Situational awareness feedback loop (54)
One element of improving situational awareness is effectively evaluating which, if any of these new, nontraditional sources of information have utility. New technologies and information sources are often viewed with skepticism, and many, especially those who work for government organizations, consider information from non-government sources unofficial, and/or unreliable. With this mindset, it seems critical to evaluate the new sources discussed here in order to identify if or when they have utility or value. In addition to evaluating the data sources, it is also critical to examine the perception and the potential inclusion of these data sources into the decision cycle. These new sources, like accepted forms of disease
monitoring content, can be categorized as either information that is useful to predicting the future or information that is not useful, potentially erroneous, or even harmful (57). Since the future is unknown, it is impossible at the moment of an outbreak to distinguish which category each source of information falls into so complex decisions often result in the inclusion of information that is not useful (57).
recognition, and prediction rooted in past world experiences and perceptions (56). The brain creates a model of the world, and everything one learns is added to the model, so the brain constantly compares the model to what it sees in reality (56). To make a prediction, the brain will compare past structural knowledge (or patterns) with the most recent details available (i.e., awareness of the current situation) (56). Correct predictions result in situational understanding, while incorrect predictions lead to confusion (56). Information must be analyzed, synthesized, and distributed in near real-time to enable decision-making (50). Successful actions often depend on fast information collected directly from the field (“ground truth”) (35).
However, decision-making is often a result of instincts (or gut feelings) that appear quickly in the consciousness. These instinctive feelings usually are due to the underlying feelings that we are not fully aware of at the time. Furthermore, these feelings are often strong enough to act upon and tend to follow “rules of thumb” (57). While these instincts are neither impeccable nor stupid, due to what is called the “beneficial degree of ignorance,” they can outperform a considerable amount of knowledge and information (57). Less time and information, at times, can improve decisions, despite two core beliefs in our culture that “more information is always better” and “more choice is always better” (57). People
generally believe that the more information the decision makers have, the better off they are. However, extra information can be harmful, confuse the issue, and make people feel more confident than they should. Individuals who constantly overwhelm their brains, and feed it more information than it can handle, may gain only a limited understanding (58).
months of rational analysis. Successful decision-making is a result of balancing deliberate and instinctive thinking (59). People who make decisions under pressure, even those considered experts in their respective fields, do not logically and systematically compare all available options (60). The key to good decision making is understanding, and not
knowledge (59). Unfortunately, when overwhelmed with information, people drown in
knowledge and lack understanding. A conscious brain can only handle five to nine pieces of information at any moment, and problems with more than four variables overwhelm the mind (58). Humans also prefer the illusion of certainty in their information and decision making as opposed to the reality of doubt (35).
Recent studies have shown specific tendencies in the decision making process. As described by Kahneman and Tversky, humans have greater confidence in highly correlated observations, and are often insensitive to the reliability of evidence (61) that those
correlations may not be correct. Prediction is the result of selecting an outcome that is most representative of the input data (assuming the input data is error free), and confidence increases with consistency (61). People predict by interpreting the representativeness of observations, utilizing prior or background information or specific evidence about the event, and assessing the accuracy of their prediction (61). Unfortunately, there is little relationship between an expert’s confidence in a decision and the accuracy of the decision (35).
association causes one to ignore important differences and fail to identify the correct scenario.
Other decision making errors include: representativeness error (thinking is guided by a prototype, so one fails to consider possibilities that contradict the prototype and thus attributes the symptoms to the wrong cause) and confirmation bias (“confirming what you expect to find by selectively accepting or ignoring information”) (62). In medicine, physicians are known to fall into the trap of a “zebra retreat,” shying away from a rare diagnosis (62). Additionally, for doctors it may be satisfactory to find a cause, but not identifying all potential causes for a patient’s ailment may lead to missing a critical event (62). This potential for missing a critical event exists within outbreak detection, requiring diligence by those who receive information. Multiple sources of information about an incident increase the level of confidence about both the event’s likelihood of occurrence and various related details, more so than any single report.
CHAPTER 4. LITERATURE REVIEW
To support the work described in this dissertation, a literature review was completed to determine the values of open or social media sources in gathering information on public health topics. The findings indicated that in certain contexts some disease characteristics, their magnitude, and location could be identified prior to official reporting. Forty-one articles were identified in which the authors describe the use of news or social media to gather information about a public health condition.
Methods
Although fields outside of public health may be more advanced in assessing and using traditional media and social media to gather information, the scope of this review will be limited to public health purposes. This literature review will focus on peer-reviewed journal submissions.
Key Words
Table 4.1. Specific search strings used for literature review
Media (OR terms)
AND
Public health (OR terms)
AND
Input (OR terms)
News* Public Health Gather
Media Health Collect
Crowd sourcing Med* Infodemiology
Twitter Epidemiology Infoveillance
Facebook Surveillance
Blog Situation* awareness
Television Internet
Web YouTube Social network*
Microblog* Sources
In identifying possible items for inclusion, databases were tiered for review based on apparent relevance and likelihood of relevant findings. This was done in the beginning in an attempt to review the sources believed to be most plentiful. The following is the tier
structure selected for databases to be searched:
Tier 1: MEDLINE/PubMed, Web of Science (Social Sciences Citation Index), Scopus [via NIH], Communication & Mass Media Complete, Google Scholar Tier 2: Global Health, Embase [via NIH], Academic OneFile
Tier 3: IEEE Xplore Search Strategies
“Snowballing” was used to identify additional sources that meet the specified
Inclusion Criteria
Any type of study, assessment or review (including letters to the editor, commentaries, and editorials) that underwent peer-reviewed submission
Any human study population
Any location (see note below about language restriction)
Exclusion Criteria
Articles published in a language other than English
Articles focused on using media to educate or inform people
Articles describing mechanisms, methods, or results for using media to recruit participants into studies
Articles that are duplicates
Articles, editorials, private blog posts, and findings not within a peer-reviewed journal
Articles published before 2000 or after April 2011
Articles about animal or veterinary issues or diseases
Posters, interviews, and books
Articles or reports by government agencies, think tank organizations, foundations or academia
Review Process
The goal of this review process was to identify and capture all relevant studies in this subject area for inclusion into the final literature review. The following was my methodology for reviewing articles that had met the inclusion/exclusion criteria and search terms specified above:
Reviewed all titles of articles that met the criteria and search terms specified. Using
subjective assessments, the title was reviewed for topic relevancy. If the title indicated…
1. Relevancy – the article was included for the next level of review
3. Nothing definitive on relevancy – the article was included for the next level of review
Abstracts that met criteria 1 or 3 as specified above were pulled for review. If the
abstract met the intent of this review, or if it was unclear, the full article was pulled. If the abstract clearly did not meet the intent of this review, the article was excluded from further review.
For those articles for which abstracts were identified as relevant or possibly relevant,
the full articles were pulled, printed, numbered, and reviewed. All fully reviewed articles were entered into the abstraction database, which included the following
fields:
a) Full citation b) Timing of study
c) Information source analyzed (news, blogs, etc.) d) Health outcome of interest
e) Source data used for comparison f) Size of study
g) Findings
h) Gaps in knowledge and limitations
i) Criteria for including and evaluating information sources j) Methodological quality
k) Included for this review (Yes/No)
A subset of the abstraction database fields were used to generate the tables in this
review that summarize findings of articles which were selected for inclusion into this review (and will incorporate findings from step 3 and step 4).
identified. While there was some diversity in public health topics or issues that were the focus of these research efforts, influenza was by far the most common disease and was the focus of seventeen articles. Of these influenza or influenza-like illness (ILI) articles, most (ten) of the articles were focused on the recent 2009-2010 H1N1 pandemic which may have resulted in both more research and more articles being accepted by journals. Seven articles looked at multiple infectious diseases occurring simultaneously.
The review that follows describes the findings of the literature broken down into groups based on the type of content that was analyzed: news articles (nineteen), Internet search utilization (eighteen), blog/microblog postings (three), and a smartphone application data (one). This breakdown of categories for summarizing results was selected because there are similarities in methodologies that exist in the utilization of the same type of information from the same information stream.
News Article Results
Utilizing newspaper articles (both print and online) was the most commonly reported approach to gathering information from nontraditional sources. Table 4.2 summarizes the research articles identified; the articles are described in further detail below. No consistent health topic was studied; however, topics range from more mundane public health
Table 4.2. Articles about news media findings
Findings of news media research
News media can provide insights about novel or emerging issues. An increase in both the number of news stories and the severity of cases described in news stories can be seen in news sources from Mexico in the weeks and months leading up to the start of the H1N1 outbreak, which showed that news media provided a prediction of an upcoming reality (17).
There is a lag between newspaper reports and official reporting, with news
has decreased from forty days in 1996 to nineteen days in 2009, with unofficial news reporting about a disease being available prior to official reports (67) by an average of twelve days (68). These findings have held for various diseases and have been confirmed using both manual and automated methods for news collection, review, and processing (18). This delay in reporting can be seen as far back as 1968 where the emergence of influenza in Hong Kong was first announced in newspaper stories (65), with newspaper reports of social disruption indicating influenza appearing five weeks before official recognition (69). This faster reporting pace of news compared to official reports can also be seen in death reports where newspaper data provides insight about mortality data up to a week faster than death registries held by state health departments and the CDC (8).
News media can over- or under- represent current health conditions.
Conditions may be overrepresented (breast cancer) as compared to the national incidence rate, while other conditions are underrepresented in the media compared to how often disease occurs (bladder cancer) (66). Media may also focus more often on treatment with limited coverage on preventing, detecting and coping (66). In coverage of injuries caused by vehicular crashes, both the likelihood of restraint use and the risk to drivers was under-represented in newspaper articles as compared to mentions of the involvement of teens in fatal car crashes and the involvement of alcohol in all crashes (70). Trends in newspaper article frequency run parallel to overall mortality trends, but not to prevalence or incidence for cancer, heart disease, AIDS, diabetes, Alzheimer’s, and arthritis (7).
News media can provide health information that cannot be verified elsewhere.
newspaper reports of violent acts such as burnings (63, 65) or drownings (64, 67, 72). This inconsistency is also true for acts that a government may not want the public to be aware of such as diseases caused by asbestos exposure (26), or for acts, such as suicide, that have negative cultural implications (73).
Limitations of news media research
Bias is a major limitation of news media research. Writers, editors, and publishers are inherently biased when reviewing the likelihood that any given event will be reported in the news, which may reflect events that affect readership (24). In addition, reporting norms change over time and this introduces another source of news reporting variation (66). For example, the use of scientific terms and disease names may be increasing as these terms become more common amongst the public. Bias may also be introduced into news reporting due to intentional political efforts such as misinformation campaigns and
government censorship (26). Finally, reporting can also include language bias since all of the sources used were in English (67), and some studies were focused on specific cities or countries (70, 73). Use of a single media source—newspaper—often limited the scope of findings (66), and these studies could have been extended to include sources such as television or magazines (8).
Quality of news media research
In this literature review, a ‘gold standard’ criterion was met when the accuracy of news media or "crowd sourced" data were compared to official reports from reputable sources such as the WHO, the CDC, ministries of health, or state health departments. This level of comparison occurred for most of these articles (thirteen), but with a few notable exceptions. Three articles did not compare news media results to any type of official data, which leaves those results as questionable since there is no form of comparison between the results and the expected outcomes. For each of these articles (9, 24, 75), there are data sources that could have been used for comparison but were not. This omission would be similar to undertaking a study looking at the natural history of disease while ignoring other attempts to describe the disease in detail.
Studies were considered poor quality if they did not include a description of data extraction (10) or a description of limitations (63, 65). Studies were also considered poor quality if they did not use source data for comparison and were missing extraction or limitation details (9, 24). Studies that were high quality provided descriptions of data methods, analysis approaches and limitations of the work (64, 67, 70, 72).
assess them based on themes (74) or topics (75). At times, this method relied on multiple staff making independent assessments and then comparing outcomes (73). The third manual method was to include any article where the outcome of interest was included in the title (65) or anywhere in the text (7). For automatic extraction, two findings used methods to extract only the disease and location of interest (9, 72), while another approach involved automated extraction of five variables of interest (8). In the analysis of asbestos news stories in Japan (26), a mix of manual extraction to identify articles and automated extraction to identify concepts and associations of interest was used.
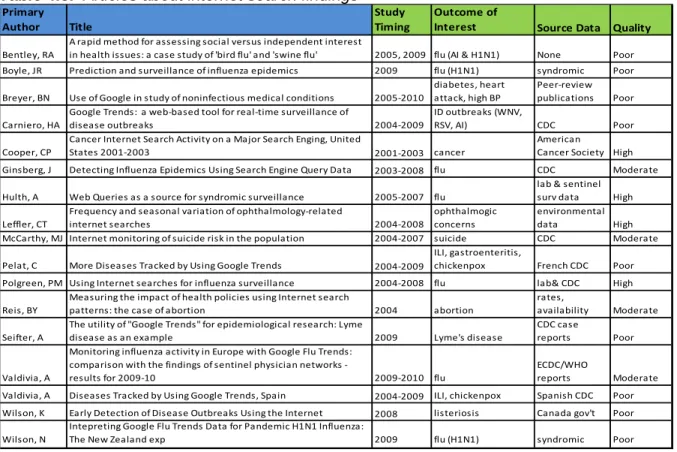
Internet Search Utilization Results
Table 4.3. Articles about internet search findings
Primary
Author Title
Study
Timing
Outcome of
Interest Source Data Quality
Bentley, RA
A rapid method for assessing social versus independent interest
in health issues: a case study of 'bird flu' and 'swine flu' 2005, 2009 flu (AI & H1N1) None Poor Boyle, JR Prediction and surveillance of influenza epidemics 2009 flu (H1N1) syndromic Poor
Breyer, BN Use of Google in study of noninfectious medical conditions 2005‐2010
diabetes, heart
attack, high BP
Peer‐review
publications Poor
Carniero, HA
Google Trends: a web‐based tool for real‐time surveillance of
disease outbreaks 2004‐2009
ID outbreaks (WNV,
RSV, AI) CDC Poor
Cooper, CP
Cancer Internet Search Activity on a Major Search Enging, United
States 2001‐2003 2001‐2003 cancer
American
Cancer Society High Ginsberg, J Detecting Influenza Epidemics Using Search Engine Query Data 2003‐2008 flu CDC Moderate
Hulth, A Web Queries as a source for syndromic surveillance 2005‐2007 flu
lab & sentinel
surv data High
Leffler, CT
Frequency and seasonal variation of ophthalmology‐related
internet searches 2004‐2008
ophthalmogic
concerns
environmental
data High McCarthy, MJ Internet monitoring of suicide risk in the population 2004‐2007 suicide CDC Moderate
Pelat, C More Diseases Tracked by Using Google Trends 2004‐2009
ILI, gastroenteritis,
chickenpox French CDC Poor Polgreen, PM Using Internet searches for influenza surveillance 2004‐2008 flu lab& CDC High
Reis, BY
Measuring the impact of health policies using Internet search
patterns: the case of abortion 2004 abortion
rates,
availability Moderate
Seifter, A
The utility of "Google Trends" for epidemiological research: Lyme
disease as an example 2009 Lyme's disease
CDC case
reports Poor
Valdivia, A
Monitoring influenza activity in Europe with Google Flu Trends:
comparison with the findings of sentinel physician networks ‐
results for 2009‐10 2009‐2010 flu
ECDC/WHO
reports Moderate Valdivia, A Diseases Tracked by Using Google Trends, Spain 2004‐2009 ILI, chickenpox Spanish CDC Poor Wilson, K Early Detection of Disease Outbreaks Using the Internet 2008 listeriosis Canada gov't Poor
Wilson, N
Intepreting Google Flu Trends Data for Pandemic H1N1 Influenza:
The New Zealand exp 2009 flu (H1N1) syndromic Poor
Findings of internet search utilization research
Internet search patterns align with disease incidence patterns. Search trend data for Lyme Disease matches both the seasonality and the geographic distribution (78). This type of Internet search data also aligns with established patterns for seasonal
Internet search patterns align with environmental factors that impact health,
especially seasonality. Search utilization can quantify seasonal and environmental
variation in eye-related terms (i.e. increased sunlight intensity was associated with increased searches for ‘dry eyes’ and eye floaters’) (77). Searches for depression were also
significantly correlated with seasonal temperature variations in both the north and south hemisphere, with the degree of correlation varying by latitude (33). Additionally, search volumes for chronic conditions such as diabetes, high blood pressure, nephrolithiasis, and myocardial infarction aligned with the seasonal morbidity data for each of these conditions (34).
Internet search patterns can both align with disease patterns and provide an
early warning or indication of an upcoming increase in incidence. In the United States, Google flu queries were shown consistently to provide estimates of ILI percentage one to two weeks prior to when CDC published information from their sentinel provider network (37). A 2009 comparison in Queensland indicated a high correlation between Google search frequency and emergency department surveillance data. In this case, Google provided earlier indications of increasing demand before case presentations arrived at an emergency department (80). When comparing search trend data to provider
there was an increase in searches for ‘rash’ in the months prior to spikes in West Nile Virus (WNV), which may serve as a proxy or early indicator for the upcoming WNV season (20). During the 2008 listeriosis outbreak in Canada, Internet search terms showed a spike beginning in mid-July, while official reports did not appear until August (83).
Internet search data can be an input parameter for predictions of disease
outbreaks. Polgreen and his team used Internet search term data as an input for a model intended to predict the timing of spikes of influenza outbreaks (30). Using data from Yahoo! search, his team predicted influenza rate increases 1-3 weeks prior to laboratory results (30). Internet search patterns can also be indicative of social learning and group direction, as evidenced by the work of Bentley who looked at individual interest in ‘swine flu’ and ‘bird flu’ (84).
Internet search patterns can indicate sub-population variation in outcomes of
interest. Search patterns for suicide and self-harm positively correlate with the CDC statistics for youth, but the same correlation did not exist for adults (85).
Internet search patterns can inform people about health issues of concern in
places where access to care is an issue. The volume of Internet searches for abortion are inversely proportional to local abortion rates and directly proportional to local restrictions on abortion; therefore, Internet search volume may be a way to assess interest amongst the public about health activities that may be restricted or sensitive (31).
Internet search patterns may provide insight on controversial and often private
Internet search patterns do not always align with actual health events. There are also circumstances where search volumes are not indicative of actual disease incidence but are in response to media spikes. This trend was seen with avian influenza in 2005 and 2006, where search frequency spiked in the United States, but no cases were reported (20). The same phenomenon has been seen with increased reporting of cancer stories resulting in increased search utilization (76). New Zealand’s HealthLine system received calls for H1N1 that showed a peak three weeks prior to Google Flu Trend data, which may be indicative of variation between Internet users and those without computer access (82). Google Flu Trend data also did not align with news media reports for H1N1; the massive media peak did not relate to increases in disease incidence in New Zealand, but rather to the global concerns about the coming flu pandemic (82).
Internet search patterns may lag behind actual disease patterns. In both Spain (81) and France (79), Internet searches for chicken pox lag approximately one week behind incidence reported by official surveillance systems.
Limitations of internet search utilization research
Internet access and utilization of internet search tools varies across demographic, socioeconomic and geographic population characteristics (31) and information from a search engine company does not provide these user characteristics (85). These data have the potential for a non-representative sampling bias (78), especially due to the
Data were gathered, censored, and selected by the search company owner at a weekly aggregate (77) and the search company (Google) did not provide visibility on
mathematical search assumptions and approximations, which may obscure true trends (78). It is unclear if these approaches vary between vendors (76). Additional work is necessary to find suitable Internet search query proxies to be correlated with reported diseases of interest (20), and there is limited evidence on how much of a difference from the baseline indicates an actual outbreak signal (83).
It is not evident that there is a causal effect between someone searching on the Internet and someone actually experiencing the outcome of interest, and we must be careful not to draw conclusions out of a coincidence in data (58). This effect is seen clearly in suicide search data where a person may be looking for information on suicides because they intend to commit the act or because they intend to prevent the act (85). To better assess causality, observational studies must be conducted on the topic of interest to validate findings (31). Internet search results may also be impacted by news events, cultural differences, alcohol consumption or other factors (33) and correlations may be meaningful only across large populations (37).
Quality of Internet Search Utilization
Most of the research (ten articles) using Internet search terms is of poor quality due to the lack of description of specific search terms used, how those terms were validated, and what selections were made when gathering data from Google Insights or other similar tools. High quality research included methodologies for control searches (77), as well as detailed descriptions of search terms and combinations used (76, 86). Polgreen’s work provided detailed descriptions of statistics used to analyze the data and details of models developed to predict influenza rates using search data (30).
Blog and Microblog Posting Results
One article was identified that gathered information posted to blogs, and the research specifically looked at postings related to human papilloma virus (HPV) vaccine (87). The authors found that blog postings about HPV vaccines were temporally aligned when there was an increase in mainstream media activity, media controversy, or releases of scientific studies about sexually transmitted diseases (STDs) in teenage girls. Data were extracted from each blog posting via a manual process in which the researchers gathered data on pre-identified variables that included user profile, blog content, size of the bloggers network, and responses of those who used the blog (comments, kudos, replies). The research included blog postings written between November 2005 and May 2008 and excluded postings that were about the virus itself. A significant limitation of this research was that only one social network site (MySpace) was utilized to gather the information, which may limit the generalizability of the findings to users of other blogs or social
(news) and the gathered data (blogs); this resulted in a "moderate" quality rating in my assessment.
Two articles addressed the use of H1N1 information on Twitter, but they looked at two different sub-topics: personal experience with H1N1 (23) and antibiotic misuse (39). For the first analysis, a combination of manual and automatic coding was used to collect data from Tweets posted from May to December 2009, with each Tweet then categorized as personal experience, joke, concern, expression of relief, etc. When frequency of Tweets about H1N1 personal experiences were compared to weekly US H1N1 rates as provided by the WHO, there was a high concurrence (23). The most significant limitation identified is the lack of a well-defined study population, as those who Tweet about H1N1 may not be
representative of the entire population of Twitter users, or representative of the general population (23). An additional limitation not addressed in the article is the lack of validation of terms used on Twitter since people have adopted extreme shorthand when working within the defined character limits for posting to the site, and those terms have not been fully evaluated as compared to traditional terminology and language.
The second article that researched the use of Twitter was the work of Scanfeld that looked at evidence of misunderstanding or misuse of antibiotics between March and July 2009 (39). Tweets were manually reviewed and classified into one of eleven categories, with 100 Tweets randomly selected from each category to be used for analysis. In addition to capturing the Tweet text, researchers collected data about the number of followers, the number followed, and the number of status updates by that user. No source data was used to compare the Tweet information to that of an alternative source, so this resulted in a moderate quality finding since the study provided a descriptive assessment with no
not measurable. Additionally, the novel experience of H1N1 and the additional media coverage may have led to an increased amount of misinformation as compared to a normal influenza season which cannot be validated (39).
Smartphone Application Results
Only one article was identified that used a smartphone application for gathering health information (16). This article described the data collected from inputs to an application titled ‘Outbreaks Near Me’ which enabled users to provide information about their knowledge and experience related to disease, with 95% of the postings relating to influenza (16). Information submitted via the application was compared to news media reports available on HealthMap and to CDC metrics for sentinel influenza surveillance. Information provided by the general public provided insight that was not otherwise available, especially related to school closure. However, no quantitative data indicating how often this novel information was gathered had been described in the article, so this resulted in a poor quality rating. The most significant limitation was the inability at this time to verify or
Discussion
Overall, the review indicated that further research on the utility of news and social information streams is important to continue identifying potential applications for these content sources. The review also suggested that there is a long way to go in this field towards developing a more concrete understanding of both the benefits and the risks of using these sources to gather health information and to establish methodologies and best practices for this field of research. There were a number of articles reviewed that described the possible usage and potential value of news and social media as sources for public health insight, but the articles did not include any actual analysis and were often theoretical in nature [these were not included in this review]. These theories include the potential utility of alternative sources for policy decisions or for improving disease prevention and control programs (88), as well as the concept of using indications of social disruption (such as change in practices like attending festivals) as indirect markers for potential outbreaks (89).
When looking at the findings from the different sources included in this review, there is some variation between the information streams. For instance, while the news can provide insights about novel or emerging issues, it can also over- or under- represent current health conditions. There is a lag between newspaper reports and official reporting, with news media often providing the first descriptions of disease events. Additionally, news media can provide health information that cannot be verified elsewhere. Internet search patterns by the computer-using population align with disease incidence patterns and environmental factors that impact health. Additionally, this data can provide an early
patterns do not always align with actual health events and lag behind actual disease patterns. Microblog posts, such as Twitter, provide insight that aligns with official reporting, while a smartphone application provides novel information not otherwise identified,
specifically as related to the impacts of H1N1 on schools.
Although these studies have shown value as potential sources of health information from the public, some limitations were identified in the studies. One of these potential areas of concern is the possibility of publication bias, since there were no identified published articles that did not have results that showed no value from news or social media sources. This may be the result of people only doing research on topics for which there is a strong association between media and data. For the findings related to newspaper articles, there are limitations about the applicability of these findings across varying geographies and types of newspapers around the country or the world. News producing entities can be
categorized as local (for a specific city or region) or national, with additional variation between organizations that are affiliates of bigger national news outlets and those
organizations that are completely independent. Additionally, some online news services no longer have a paper edition and are Internet-based only. This impacts content, because when comparing print to online for American news content, there is an increase in opinions and light news online while informational news is less present online as compared to in print (90). News sites are sometimes the partners of radio and television stations (either local stations or affiliates of national networks).
Additionally, for the three studies that looked at social media sites and applications for smartphones, there is an inherent limitation to generalizability in these findings because there may not be comparability between those who can both afford and choose to own smartphone devices compared to those who do not. Due to varying use patterns of
cannot confidently apply search pattern findings for people who have access to the Internet and use it for medical information of the general population.
When reviewing the articles for quality, it was apparent that there is no standard or consistent methodology for assessing the quality, validity, or accuracy of the information gathered from news and social media sources. There is also no standard approach or methodology for comparing information from news or social media sources to formal reports and official sources. Some researchers took the initiative to look for correlations between the data they identified in social or news sources and official reports from health agencies or government organizations, but many researchers did not do any such comparison. When assessing quality, a particular reality was emphasized: it is hard (or impossible) to compare quality across different media (newspaper to Twitter) as each has its own unique
shortcomings and strengths.
The most significant limitation of this literature review is that gray literature was not included, which may have resulted in missing articles from academic institutions,
CHAPTER 5. METHODS
This dissertation has two key outcomes that are being studied. The first is an assessment of the utility of infodemiology data sources (news media, Internet search patterns, and social media) when compared to official epidemiology reporting. That assessment was first done by doing a descriptive analysis of each data source
independently, and then comparing each infodemiology source to the NNDSS data set. Then, the three infodemiology sources are combined to assess the ability of news media, internet search, and social media to serve as a signal or indicator in advance of official reporting. The second key outcome was to assess the knowledge and attitudes amongst disease surveillance experts on if (or when) they would use infodemiology sources to inform their work. The survey was necessary to understand existing opinions on novel sources and to understand the likelihood of these sources being incorporated into public health practice (regardless of the outcomes on the utility assessment). Even if the infodemiology sources show utility, if practitioners are not willing to use the new information, this line of data is not worth further investigation.
Methods for Data Collection and Processing
Insight for Search data provided relative search frequency. For Twitter, data were pulled from an archive of the Twitter fire hose by Gnip. In addition, original survey data came from the responses of study participants. Each data set (excluding the survey) was collected for the retrospective period from January 1, 2010 to December 31, 2010. A list of terms was generated to include clinical terms as well as common misspellings and Internet slang (23) for each data source to include the scientific genus name ("Bordetella"), as well as the disease name ("pertussis") and the common term ("whooping cough") (see Appendix B). While news articles are expected to have correct spellings, Google search auto-corrects spelling for search terms, while investigations of Twitter must include variations of spelling and verb tense to account for most postings. The list in Appendix B was generated from Google Insights for search results at the national level. The intent was to maximize the number of true positives (genuinely pertinent articles or Tweets) and minimize retrieval of false positives (irrelevant articles or Tweets that are excluded due to alternate meanings of the key word) (7).
Official Reporting