NOVEL INSTRUMENTATION AND METHOD DEVELOPMENT FOR A QUADRUPOLE ION TRAP MASS SPECTROMETER
G. Asher Newsome
A dissertation submitted to the faculty of the University of North Carolina at Chapel Hill in partial fulfillment of the requirements for the degree of Doctor of Philosophy in the
Department Chemistry.
Chapel Hill 2009
Abstract G. Asher Newsome
Novel Instrumentation and Method Development for a Quadrupole Ion Trap Mass Spectrometer
(Under the direction of Gary L. Glish)
Part of the work described in this dissertation has involved development of instrumentation for the analysis of aerosol compounds. A quadrupole ion trap mass spectrometer (QITMS) is modified to sample particles via an aerodynamic lens inlet. The instrument has a unique capability for volatilization and chemical ionization within the heated ion trap that reduces fragmentation compared to other methods. Compounds in particles are detected in real time at low concentrations, over a broad concentration range, and in complex mixtures. Unlike most mass spectrometry systems used for aerosol detection, the aerosol QITMS is able to perform tandem mass spectrometry (MS/MS) to identify analyte ions. The performance of the instrument is demonstrated by monitoring the ozonolysis reaction of a volatile organic compound producing aerosol particles. The aerosol QITMS is presented as an effective design for detection and analysis of aerosol compounds.
iv
previously obtained to characterize the effects of trapping parameters. IRMPD is also made selective by controlling the spatial distribution of ions relative to the laser pathway. More informative MS/MS spectra can be acquired without empirical determination of irradiation time, as is necessary for conventional IRMPD. The methods described use the fundamentals of ion trapping to design more effective photodissociation MS/MS
Acknowledgement
I would like to thank Dr. Elias P. Rosen, a great collaborator and friend, for helping me with instrument applications and teaching me the fundamentals of an unfamiliar branch of chemistry.
Thank you to my collaborators Dr. Tomas Baer and Dr. Richard M. Kamens for supporting my research and providing me with interesting work.
I would like to thank Dr. Gary L. Glish for providing the setting where I found my professional calling, for advising my research, and for pushing me when I needed it. I would like to thank the past and present members of the Glish group for their support and collaboration. It has been a pleasure to work with you.
Thank you to Ikumi Kayama for creating graphics and animations to help me try to make my audience as excited as I am.
Thank you to my parents, grandparents, and many teachers for fostering my education and believing in my potential.
And most importantly, thank you, Ikumi, for being there through the whole process and making my last year the best. I couldn’t have done it without your support and
vi
Table of Contents
List of Tables……….……….…xi
List of Figures………….……….………..………….…….……….….…………xii
List of Abbreviations and Symbols……….………….………….….………..…………xiv
Chapter 1. Tandem Mass Spectrometry with a Quadrupole Ion Trap 1.1 Mass Spectrometry to Characterize Aerosol Particles and Peptides……….….….1
1.1.1 Aerosol Particle Analysis………1
1.1.2 Improved Techniques for Tandem Mass Spectrometry………..2
1.2 Mass Spectrometric Analysis……….………..2
1.2.1 Tandem Mass Spectrometry……….……..3
1.2.2 Mass Analyzers……….……….……….………4
1.3 Quadrupole Ion Trap Mass Spectrometer…….……….………..4
1.3.1 Trapping Theory……….5
1.3.2 Bath Gas………..7
1.3.3 Ion Trap Capacity……….………….…….………7
1.4.4 Ion Manipulation………..……….….….…….…….………..9
1.4 Activation and Dissociation Methods in the Quadrupole Ion Trap……….9
1.4.1 Collision Induced Dissociation……….10
1.4.2 Infrared Multiphoton Photodissociation………….……….……….………11
1.5 Summary………12
1.6 References……….……….………14
2. Real-time Detection and Tandem Mass Spectrometry of Secondary Organic Aerosols with a Quadrupole Ion Trap…….…………..…….….….………..…………16
2.1 Introduction……….……….…………..16
2.1.1 Mass Spectrometry of Aerosol Compounds……….16
2.1.2 Tandem Mass Spectrometry……….……….……….…….……….17
2.2 Experimental……….……….17
2.2.1 Instrumentation and Aerosol Sampling………….………..………….17
2.2.2 Aerosol Particle Generation and Size Measurement….………….………..20
2.2.3 Glow Discharge Ionization Source and Selected Ion Chemical Ionization………..21
2.2.4 MS/MS Implementation.……….…………..…….…….…..…………22
2.3 Results and Discussion……….……….22
2.3.1 Selected Ion Chemical Ionization……….………….………….…………..22
2.3.2 Temperature Effects……….……….…………23
2.3.3 Characterization of Aerosol Particle Standards……….…….……….…….26
2.3.4 Multi-component Aerosol Particles……….……….………29
2.3.5 Secondary Organic Aerosol Detection……….31
2.3.6 Tandem Mass Spectrometry………….……….……….………..33
2.4 Conclusions………37
2.5 References………...………….………..40
viii
3.1 Introduction……….……….……….……….43
3.1.1 Advantages of IRMPD vs. CID……….…….………….…….43
3.1.2 IRMPD Efficiency………43
3.2 Experimental……….……….……45
3.2.1 Instrumentation and Samples……….……….……….….………45
3.2.2 IRMPD Configuration……….……….………45
3.3 Results and Discussion………..46
3.3.1 Laser Characterization………..46
3.3.2 Power and Overlap with the Ion Cloud……….………47
3.3.3 IRMPD Efficiency Improvement………..49
3.3.4 Sensitivity……….………52
3.4 Conclusions………55
3.5 References……….……….………56
4. Profiling Ion Cloud Distribution in a Quadrupole Ion Trap………..59
4.1 Introduction………59
4.1.1 Ion Motion in a Quadrupole Ion Trap………….………….……….………59
4.1.2 Previous Ion Cloud Profiles……….……….………59
4.2 Experimental……….……….………61
4.2.1 Instrumentation and Samples………….……….………..61
4.2.2 IRMPD Configuration……….………….61
4.2.3 Dissociation Measurement……….…….…….………….62
4.3 Results and Discussion………..64
4.3.2 Bath Gas Pressure Effects……….65
4.3.3 Resolved Ion Cloud Bimodal Distribution……….………..………67
4.3.4 qz Effects………...67
4.3.5 Two-dimensional Laser Tomography of Ion Clouds at qz………70
4.3.6 Laser Tomography Limitations……….72
4.4 Conclusions……….………...73
4.5 References………..75
5. A New Approach to IRMPD for Controlled Dissociation in a Quadrupole Ion Trap...77
5.1 Introduction………77
5.1.1 IRMPD in a Quadrupole Ion.………77
5.1.2 Disadvantages from Lack of IRMPD Selectivity……….78
5.1.3 Previous Attempts to Make IRMPD Selective……….79
5.2 Experimental……….….80
5.2.1 Instrumentation and Samples………80
5.2.2 IRMPD Configuration………..80
5.2.3 Selective Broadband IRMPD Implementation……….81
5.3 Results and Discussion………..82
5.3.1 Ion Cloud Size Affects Irradiation Time and Selectivity……….82
5.3.2 Sequential SB-IRMPD……….84
5.3.3 Conventional IRMPD vs. SB-IRMPD………..84
5.3.4 Low Mass Product Ions………90
x
5.3.6 TA-SB-IRMPD vs. TA-IRMPD……….………..96
5.4 Conclusions……….……….….……….…99
5.5 References………100
6. Conclusions and Future Directions………...102
6.1 Summary……….…….………102
6.2 AQITMS……….……….……102
6.3 Focused Laser IRMPD……….103
6.4 Ion Cloud Distribution………….……….……….…………..104
6.5 SB-IRMPD……….……….……….……106
6.6 Conclusions………..107
List of Tables Table
3.1. Product ion abundances from IRMPD with the laser unfocused at helium
bath gas pressure of 3.3×10⁻⁴ Torr….……….……….……….53 3.2. Product ion abundances from IRMPD the laser focused at helium bath gas
pressure of 1.0×10⁻³ Torr………..54
5.1. Product ion abundances from conventional IRMPD at a helium bath gas
pressure...88 5.2. Product ion abundances from sequential SB-IRMPD at a helium bath gas
xii List of Figures Figure
1.1. Hyperbolic trapping electrodes shown in a cut-away view……….………6 1.2. Stability diagram (enclosed region) for ions in the quadrupole ion trap………….8
2.1. Schematic of AQITMS……….……….………19
2.2. Vacuum UV photoionization and proton transfer SICI of oleic acid ….….…….24 2.3 SICI of oleic acid particles at different temperatures of the ring electrode
surface……….……...26 2.4. AQITMS signal abundance from oleic acid particles volatilized at 115 ˚C….…27 2.5. AQITMS mass spectra of pinic acid and pinonic acid………..28 2.6. SOA particles from reaction of 200 ppb ozone with 100 ppb α-pinene…………32 2.7. Mole ratio of pinic acid to pinonic and mass concentration acid in SOA
particles……….……….34 2.8. AQITMS particle signal counts and the calibrated mass measurements of
pinic acid and pinonic acid……….………..……….34 2.9. CID of oleic acid [M+H-H2O]+……….36
2.10. CID of pinic acid and pinonic acid ions observed from α-pinene ozonolysis.…..38 3.1. Laser tomography of [PD+H]+ and [melittin+4H]4+ at a helium bath gas
pressure of 3.3×10⁻⁴ Torr and a qz of 0.10………48
3.2. IRMPD at a constant helium bath gas pressure of 3.3×10⁻⁴ Torr.……….……...50 3.3. IRMPD at a constant helium bath gas pressure of 1.0×10⁻³ Torr ………….…...51 4.1. Coordinate system for laser tomography……….……….………….63 4.2. Fragmentation efficiency profiles of [PD+H]+ ion clouds at qz 0.10 and
various bath gas pressures………..………66 4.3. Fragmentation efficiency profile of [cytosine+H]+ ion cloud collected at qz
4.4. Fragmentation efficiency profiles of [GGYR+H]+ ion clouds at 1.0×10⁻³ Torr
helium bath gas pressure and various qz values……….69
4.5. Two-dimensional contour plots of [bradykinin+2H]2+ ion clouds at 1.0×10⁻³ Torr bath gas pressure and various qz values……….71
5.1. Fragmentation efficiency and MS/MS efficiency of SB-IRMPD………..85
5.2. Tandem mass spectra from conventional IRMPD and SB-IRMPD………..86
5.3. Tandem mass spectrum from sequential SB-IRMPD of [ubiquitin +10H]10+...91
5.4. SB-IRMPD of m/z 86 immonium ions………..92
5.5. Fragmentation efficiency from TA-SB-IRMPD at various temperatures and various helium bath gas pressures……….94
xiv
List of Abbreviations and Symbols
°C degrees Celsius
° degree
ac alternating current
an Biemann-modified Roepstorff and Fohlman nomenclature peptide ion
AQITMS aerosol quadrupole ion trap mass spectrometer
ar Mathieu stability parameter related to dc voltage (radial)
ATOFMS aerosol time-of-flight mass spectrometer
au Mathieu stability parameter related to dc voltage (axial or radial)
az Mathieu stability parameter related to dc voltage (axial)
bn Biemann-modified Roepstorff and Fohlman nomenclature peptide ion
CID collision indiced dissociation
cm centimeters
Da daltons
dc direct current
e electron
EI electron ionization ESI electrospray ionization eV electron volts
GDI glow discharge ionization
IRMPD infrared multiphoton photodissociation
kDa kilodaltons
L/s Liters per second
LITMS linear ion trap mass spectrometer LMCO low mass cut-off
m mass
m/z mass-to-charge
mm millimeters
ms milliseconds
mTorr milliTorr
nL/min nanoliters per minute
nm nanometers
QITMS quadrupole ion trap mass spectrometer
qr Mathieu stability parameter related to dc voltage (radial)
qu Mathieu stability parameter related to dc voltage (axial or radial)
qz Mathieu stability parameter related to dc voltage (axial)
r radial dimension
r0 radius of the ring electrode, in meters
rf radiofrequency s seconds
SB-IRMPD selective broadband infrared multiphoton photodissociation SICI selected ion chemical ionization
SMPS scanning mobility particle sizer SOA secondary organic aerosol
xvi TOFMS time-of-flight mass spectrometer
Torr unit of pressure equal to 1/760 atmosphere U Mathieu equation parameter for dc
UV ultraviolet
V Mathieu equation parameter for rf V Volts
Vp-p Volts peak-to-peak
W Watts
yn Biemann-modified Roepstorff and Fohlman nomenclature peptide ion
z axial dimension
z charge
z0 one half axial distance between endcap electrodes, in meters
ZnSe zinc selenide
λ wavelength
µL/min microliters per minute
µm micrometers
Chapter 1
Tandem Mass Spectrometry with a Quadrupole Ion Trap
1.1 Mass Spectrometry to Characterize Aerosol Particles and Peptides
1.1.1 Aerosol Particle Analysis
Aerosol particles at concentrations found in the ambient atmosphere challenge the
limit of detection of a mass spectrometer. Aerosol particles commonly have a diameter
of 10 µm to 10 nm. At the upper size limit, particles have a physical mass of hundreds of
picograms that is detectable by mass spectrometry methods. However, the mass figure
decreases by nine orders of magnitude as particle size goes to the lower limit1 because the
volume of (approximately) spherical particles scales with the cubed radius. Aerosols can
also be extraordinarily heterogeneous mixtures of compounds that include a significant
number of organic components, further limiting the mass of a particular compound within
a single aerosol particle. Despite the high sensitivity of mass spectrometry, bulk
sampling of ultrafine aerosol particles below 100 nm diameter is necessary to accumulate
enough mass for analysis. All mass spectrometers for atmospheric aerosol particle
detection have previously been designed to continuously mass-analyze analyte ions from
aerosols, whether the particles are sampled individually or in bulk. A new instrument
2
The techniques for volatilization, ionization, and ion accumulation used with the
modified QITMS make the speed and sensitivity for particle detection greater than or
equal to other instrument designs for similar applications. The QITMS also has the
capability of performing tandem mass spectrometry (MS/MS) to identify compounds in
complex aerosol mixtures.
1.1.2 Improved Techniques for Tandem Mass Spectrometry
Improved techniques for MS/MS in an ion trap are developed to increase
efficiency and give the experimenter greater control. Although the methods used apply to
other analyte ions in a QITMS, particular interest is given to the study of peptides by
MS/MS. Determination of the sequence of peptides has become a major focus of mass
spectrometry since the advent of techniques like electrospray ionization (ESI)2 that ionize
biological molecules with little fragmentation. The sequence of amino acid residues
determines the three-dimensional conformation of a protein,3 which controls the
biological function of the molecule. A protein can be cleaved into peptide fragments, and
MS/MS studies of peptide dissociation patterns are used to sequence peptides. Several
new MS/MS techniques have been developed specifically for peptide sequencing.4, 5 The
MS/MS research presented in this dissertation describes improved dissociation
techniques for analysis of a wide variety of ions in a QITMS.
1.2 Mass Spectrometric Analysis
A mass spectrometer ionizes molecules and then manipulates them in the gas
phase with electric and/or magnetic fields. In mass analysis, the mass-to-charge (m/z)
ratio of ions is measured. The mass is expressed in daltons (Da), and each unit of charge
1.2.1 Tandem Mass Spectrometry
Tandem mass spectrometry (MS/MS)6, 7 is used to identify ions and analyze
structures by studying the ion dissociation pattern. MS/MS is performed by
mass-selective isolation of a (protonated or otherwise ionized) ion of interest (M+),
activation and dissociation of that parent ion (M+*), and mass-analysis of the resultant
product ions (F+). The process is represented as:
N F M
M+ → +*→ + + (Scheme 1.1)
When a singly-charged parent ion is dissociated, a neutral species (N) is formed that is
not detected. The efficiency of converting a parent ion to product ions is represented by
fragmentation efficiency, % 100 × + =
∑
∑
t i i i i P F F Efficiency ionFragmentat (Equation 1.1)
where Fi is the abundance of each product ion, and Pt is the abundance of the parent ion
remaining after dissociation. The ultimate efficiency of forming and detecting the
product ions relative to the parent ion is represented by MS/MS efficiency,
% 100 / 0 × =
∑
P F Efficiency MS MS i i(Equation 1.2)
where Fi is the abundance of each product ion, and P0 is the initial abundance of the
parent ion before dissociation.
Multiple stages of tandem mass spectrometry (MSn) are also performed. The
parent ion of a large molecule with a complex structure, such as a biomolecule, often
4
product ions to discover the complete structure of the intact parent ion. In MSn analysis a
product ion formed in the first dissociation stage is typically isolated and dissociated
similarly to the parent ion. MSn of product ions yields smaller product ions with simpler
structure that are easier to identify. Product ions can also be sequentially dissociated and
mass-analyzed without prior isolation, as in Chapter 5.
1.2.2 Mass Analyzers
MS/MS is performed by two or more mass analyzers operated successively or by
one trapping mass analyzer. Mass analyzers are classified as beam type instruments or
trapping instruments. A beam type instrument transmits a beam of ions in a continuous
fashion through the mass analyzer to a detector. MS/MS is performed by executing the
stages of mass analysis in different analyzers. For example, two time-of-flight mass
spectrometers (TOFMS) in a line can select parent ions of a mass-to-charge in the first
stage and mass-analyze product ions in the second stage. In contrast, a trapping
instrument stores ions within a defined area, accepting ions to the trapping volume in a
pulsed fashion. The ion activation and mass analysis stages in MS/MS are performed at
different times within the same analyzer. This dissertation presents research performed
with a quadrupole ion trap mass spectrometer (QITMS) that is the latter type of mass
analyzer. Some comparison is made to analysis performed with a TOFMS in Chapter 2.
1.3 Quadrupole Ion Trap Mass Spectrometer
The mass analyzer used in all experiments in this dissertation is the quadrupole
ion trap mass spectrometer (QITMS). The QITMS is popular for MSn due to its high
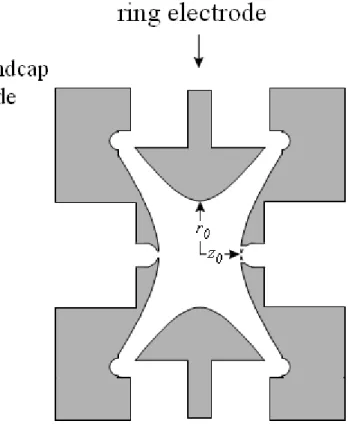
MS/MS efficiency. The trapping volume between the electrodes is defined with a
endcap electrodes, and the radial dimension (r) is bound by the ring electrode (Figure
1.1). Ions are trapped by application of rf alternating current (ac) voltages to the ring
electrode. The operation of a QITMS has been reviewed a number of times,8-10 and only
the experimental parameters relevant to this work will be discussed. The effects of the
trapping parameters have a significant impact on the efficiency and information gained
from MS/MS experiments, as shown in Chapter 4.
1.3.1 Trapping Theory
The quadrupolar electric field traps and stores ions. Trapped ions have kinetic
energy and move in an oscillating trajectory in three dimensions described by a Lissajous
curve. The resulting spatial distribution of trapped ions in motion but centered within the
trapping volume is referred to as the ion cloud. The second-order differential equation
for the ion motion has a general solution discovered by Mathieu which gives the
combination of ac and dc voltages necessary for a stable ion trajectory.11 The Mathieu
parameters, au and qu, describe the stability of ion trajectory in the z and r dimensions,
az = -2ar
(
2)
20 2 0 2 16 Ω + − = z r m zU
(Equation 1.3)
and qz = -2qr
(
2)
20 2 0 2 8 Ω + = z r m zV
(Equation 1.4)
where the ion has a mass m and charge z; the electrodes have a spacing of r0 and z0
relative to the center; the ac voltage has frequency Ω and amplitude V; and the dc voltage
has amplitude U. An ion has a secular frequency of motion dependent on the
mass-to-charge and the rf voltage. The trap is generally operated with a fixed r0, z0, and
6
increased to raise the qz of an ion. The trajectory becomes unstable at a qz value of 0.908
(Figure 1.2), and the ion is ejected. The qz value is important for MS/MS because it
corresponds to an rf voltage amplitude giving a stable trajectory (qz < 0.908) for ion
trapping prior to dissociation. A parent ion at a small qz value yields product ions of
smaller mass-to-charge and larger qz values at the same rf amplitude. The
mass-to-charge value at qz 0.908 is referred to as the low mass cut-off (LMCO), and
product ions below that mass-to-charge value are not trapped and thus not observed
1.3.2 Bath Gas
The QITMS is operated at a gas pressure of 1×10⁻³ Torr, several orders of
magnitude above other mass analyzers. The bath (or buffer) gas cools the kinetic energy
of ions through low-energy collisions. The kinetic energy of ions generated outside the
QITMS and injected into the trapping volume is damped to increase trapping efficiency,
and collisional cooling reduces ion loss and decreases the size of the ion cloud at the trap
center. Resolution is increased by the more coherent ejection of ions from the precise
center of the trap. Detection efficiency is also increased as ions at the center of the trap
are less likely to hit the endcaps during ejection. Helium is used as the bath gas because
it is a non-reactive small molecule that causes less scattering and ion loss in collisions.
1.3.3 Ion Trap Capacity
The space between the QITMS electrodes has a finite volume to contain ions. A
practical limit also exists for the number of ions of like charge that can be trapped. One
estimate suggests 105 ions can be trapped at once in a QITMS with the electrode
geometry used in this dissertation (r0 = 1.0 cm, z0 = 0.783 cm).13 If the trap is “filled”
8
range for detection or may not be detected. The capacity also has consequences for MSn
analysis where the goal is to produce many different product ions from an abundant
parent ion. The initial parent ion population limits ion abundance during the rest of the
experiment.
1.3.4 Ion Manipulation
MS/MS analysis in an ion trap requires specific manipulation of trapped ions.
The rf amplitude is controlled to change the stability of trapped ions. Analyte ions are
ejected for detection, and parent ions are isolated by selectively ejecting other trapped
ions. The trajectory of ions can also be changed by applying a supplemental ac voltage
180 degrees out of phase between the endcap electrodes. A voltage at the same
frequency as the ion secular frequency causes a gain in kinetic energy,14 and the ion
motion has greater amplitude in the axial dimension. The resonant voltage amplitude can
give the ion enough kinetic energy to exceed the bounds of the trap and be ejected; a
lower amplitude voltage axially expands the ion cloud while trapping is maintained. The
processes are termed resonant ejection and resonant excitation, respectively. Lower
voltage resonant excitation increasingly causes resonant ejection as qz values are
decreased from 0.20.15 Resonant excitation can be used for activation in MS/MS, as
shown below.
1.4 Activation and Dissociation Methods in the Quadrupole Ion Trap
Ions are activated for dissociation in MS/MS in a QITMS by a number of
methods, but each method serves to increase the internal energy of the ion. Initial ion
internal energy is due to bond vibrations, and an individual bond that achieves some
10
particular bond can gain energy directly, e.g. absorbing a photon at an equal frequency, or
through an adjacent bond in the ion. The energy and timescale for energy gain by one
bond or the activation of the ion as a whole determine the dissociation pattern. If low
energy gain occurs through multiple events, the energy will be vibrationally distributed
throughout the ion, and the bonds with the lowest critical energy have the highest
probability of breaking. A slow activation mechanism will form product ions by
preferentially dissociating bonds with low critical energy, as with activation by collisions
and infrared radiation.
1.4.1 Collision Induced Dissociation
Resonance excitation of ions is used to perform collision induced dissociation
(CID), the most common activation method for MS/MS.14, 16, 17 The kinetic energy of the
parent ion is increased, and the parent ion has higher-energy collisions with a greater
number of neutral gas molecules in an axially expanded trajectory. In the inelastic
collisions some of the kinetic energy of the parent ion is converted to internal energy.
The maximum energy converted Ecom is given by
⎟ ⎟ ⎠ ⎞ ⎜ ⎜ ⎝ ⎛ + = p n n lab com m m m E
E (Equation 1.5)
where Elab is the ion kinetic energy in the laboratory frame of reference, mp is the mass of
the ion, and mn is the mass of the neutral gas molecule. The internal energy of the ion is
converted to internal energy by the collision. If the parent ion gains sufficient internal
energy, dissociation can occur. Multiple collision events cumulatively increase the
internal energy of the parent ion until dissociation occurs. The dissociation process is
considered high energy CID if the parent ion has kiloelectron volt kinetic energy. In high
from only one or two collisions. The parent ion has tens of electron volts (eV) kinetic
energy in low energy CID, and multiple collisions are often necessary to exceed the
critical energy for dissociation. Low energy CID is readily performed in the QITMS
using the bath gas for collisions and will be used in this work.
1.4.2 Infrared Multiphoton Photodissociation
Infrared multiphoton photodissociation (IRMPD) is a method used for MS/MS
wherein the internal energy of the parent ion is increased via absorption of infrared
photons.18 IR photons at 10.6 µm have energy of 0.117 eV, and a parent ion must absorb
multiple photons for sufficient activation to exceed the critical energy for dissociation (~1
eV for small peptides19). CO2 lasers with tens of Watts of power are employed for
sufficient photon flux for multiple absorptions, as will be explored further in Chapter 3.
Most ions absorb at the IR wavelength, including peptides and proteins that absorb
strongly at C=O bonds in the peptide backbone. Ions collide with neutral bath gas
molecules during and after irradiation, and some of the internal energy gained from
photoactivation is lost to collisional cooling. Both low-energy CID and IRMPD activate
parent ions with multiple events and produce a similar dissociation pattern. IRMPD has
advantages and disadvantages compared to CID that will be discussed in Chapters 3 and
5. IRMPD requires modification of the QITMS ring electrode to allow the laser to enter
the trapping volume. Such modification causes some change to the trapping field, but a
negative effect on performance has not been demonstrated.
1.4.3 Thermal Activation
Thermal activation is used for supplementary ion activation in the QITMS along
12
collisional cooling during IRMPD because there is a smaller difference between the
increased energy of the neutral and the photoactivated ion internal energy. Collisions
with heated bath gas molecules continue to dampen the axial amplitude of trapped ion
trajectory.
1.5 Summary
This introduction has provided a description of the techniques used in tandem
mass spectrometry. The theoretical operation of a QITMS was described in detail, and
experimental modifications to the instrument and to MS/MS techniques used with the
QITMS will be described in subsequent chapters.
Chapter 2 develops a new instrument for detection and analysis of aerosol
particles called an aerosol quadrupole ion trap mass spectrometer (AQITMS). The
instrument samples particles at atmospheric pressure and aerodynamically focuses them
into a heated trapping volume for impact volatilization. Analyte molecules are ionized
within the trap, and the resultant fragmentation is compared to vacuum UV
photoionization and electron ionization. The dynamic range of mass concentration and
the limit of detection are presented at specific volatilization temperatures for the
AQITMS. The reaction of a volatile organic compound producing aerosol particles is
monitored to show the real-time detection of complex aerosol mixtures. The capability
for MSn using CID is demonstrated for identifying analytes.
Chapter 3 describes the use of a focused laser to make IRMPD practical for use in
a quadrupole ion trap. The characteristics of the laser and of trapped ion clouds are
increase in sensitivity through performing IRMPD with a focused laser at 1.0×10⁻³ Torr
is compared to conventional IRMPD with an unfocused laser at 3.3×10⁻⁴ Torr.
Chapter 4 presents laser tomography profiles of ions trapped in the QITMS
constructed using the efficient IRMPD technique developed in Chapter 3. The spatial,
time-averaged distribution of ions is shown to decrease in size as a result of increasing
bath gas pressures and qz values. The resolution of the laser tomography profiles is also
discussed. Ion distribution is profiled in two dimensions for ion clouds with qz values
from 0.10 to 0.80.
Chapter 5 begins by discussing the effects and consequences of continuous
sequential dissociation from conventional IRMPD (with or without a focused laser). A
new method is developed where the IRMPD process is made selective by resonantly
exciting selected ions into an axially offset laser path. The technique, termed selective
broadband (SB)-IRMPD, is shown to limit sequential dissociation by allowing product
ions to collisionally relax out of the laser path to accumulate in the center of the trap.
The improved product ion abundance gained from SB-IRMPD is compared to results
from conventional IRMPD. Sequential stages of SB-IRMPD are shown to further
increase product ion abundance, and the ability to characterize analytes without empirical
determination of IRMPD irradiation times is discussed. Thermal assistance is used to
increase the bath gas pressure up to 5.2×10⁻⁴ Torr for SB-IRMPD, which can not be
performed at 1.0×10⁻³ Torr.
Chapter 6 provides a brief summary of the results described in the other chapters,
as well as ideas for future improvements and applications of the techniques and
14 1.6 References
1. Nash, D. G.; Baer, T.; Johnston, M. V. Aerosol mass spectrometry: An
introductory review. Int. J. Mass Spectrom. 2006, 258, 2–12.
2. Whitehouse, C. M.; Dreyer, R. N.; Yamashita, M.; Fenn, J. B. Electrospray
Interface for Liquid Chromatographs and Mass Spectrometers. Anal. Chem.
1985, 57, 675-679.
3. Anfinsen, C. B. Principles that govern the folding of protein chains. Science
1973, 181, 223-230.
4. Zubarev, R. A. Reactions of Polypeptide Ions with Electrons in the Gas Phase.
Mass Spectrom. Rev. 2003, 22, 57 - 77.
5. Syka, J. E. P.; Coon, J. J.; Schroeder, M. J.; Shabanowitz, J.; Hunt, D. F. Peptide
and protein sequence analysis by electron transfer dissociation mass spectrometry. PNAS 2004, 101, 9528-9533.
6. McLafferty, F. W. Tandem Mass Spectrometry; John Wiley and Sons: New York,
1983.
7. Busch, K. L.; Glish, G. L.; McLuckey, S. A. Mass Spectrometry / Mass
Spectrometry: Techniques and Applications of Tandem Mass Spectrometry; VCH:
New York, 1988.
8. March, R. E.; Todd, J. F. J. In Chemical Analysis; Winefordner, J. D., Ed.; John
Wiley & Sons, Inc.: Hoboken, NJ, 2005; Vol. 165, pp 346.
9. March, R. E. In Encyclopedia of Analytical Chemistry; Meyers, R. A., Ed.; John
Wiley & Sons Ltd.: Chichester, 2000, pp 11848-11872.
10. March, R. E. An Introduction to Quadrupole Ion Trap Mass Spectrometry. J.
Mass Spectrom. 1997, 32, 351-369.
11. March, R. E.; Todd, J. F. J. Practical Aspects of Ion Trap Mass Spectrometry;
CRC Press: New York, 1997.
12. Stafford, G. C. J.; Kelley, P. E.; Syka, J. E. P.; Reynolds, W. E.; Todd, J. F. J.
Recent Improvements in and Analytical Applications of Advanced Ion Trap Technology. Int. J. Mass Spectrom. Ion Processes 1984, 60, 85-98.
13. Cooks, R. G.; Glish, G. L.; McLuckey, S. A.; Kaiser, R. E. Ion Trap Mass
14. Louris, J. N.; Cooks, R. G.; Syka, J. E. P.; Kelley, P. E.; Stafford, G. C.; Todd, J.
F. J. Instrumentation, Applications, and Energy Deposition in Quadrupole Ion
Trap Mass Spectrometry. Anal. Chem. 1987, 59, 1677-1685.
15. Charles, M. J.; McLuckey, S. A.; Glish, G. L. Competition Between Resonance
Ejection and Ion Dissociation During Resonant Excitation in a Quadrupole Ion Trap. J. Am. Soc. Mass Spectrom. 1994, 5, 1031-1041.
16. McLuckey, S. A. Principles of Collisional Activation in Analytical Mass
Spectrometry. J. Am. Soc. Mass Spectrom. 1992, 3, 599-614.
17. Douglas, D. J. Mechanism of the Collision-Induced Dissociation of Polyatomic
Ions Studied by Triple Quadrupole Mass-Spectrometry. J. Phys. Chem. 1982, 86,
185-191.
18. Bomse, D. S.; Woodin, R. L.; Beauchamp, J. L. Molecular Activation with
Low-Intensity CW Infrared Laser Radiation. Multiphoton Dissociation of Ions Derived from Diethyl Ether. J. Am. Chem. Soc. 1979, 101, 5503-5512.
19. Laskin, J.; Lifshitz, C. Principles of mass spectrometry applied to biomolecules;
Wiley Interscience, 2006.
20. Racine, A. H.; Payne, A. H.; Remes, P. M.; Glish, G. L. Thermally assisted
collision-induced dissociation in a quadrupole ion trap mass spectrometer. Anal. Chem. 2006, 78, 4609-4614.
21. Payne, A. H.; Glish, G. L. Thermally Assisted Infrared Multiphoton
Chapter 2
Real-time Detection and Tandem Mass Spectrometry of Secondary Organic Aerosols
with a Quadrupole Ion Trap
2.1 Introduction
2.1.1 Mass Spectrometry of Aerosol Compounds
Mass spectrometry is necessary to differentiate aerosol species in complex
mixtures and to measure component compound mass concentrations. Many mass
spectrometers have been designed to detect aerosol particles with different combinations
of volatilization techniques, ionization sources, and mass analyzers.1, 2 Of these, flash
thermal volatilization and electron ionization (EI) with a time-of-flight mass spectrometer
(TOFMS) is common and has been commercialized. EI causes extensive fragmentation
that makes it difficult to identify compounds in complex mixtures. A critical need
remains for more specific characterization. Alternative ionization methods have been
used that cause less fragmentation for some compounds. UV laser desorption and
ionization is very sensitive for some particles but also tends to cause high levels of
fragmentation of organics.3, 4 Vacuum UV ionization has been shown to further reduce
fragmentation and has been applied to particles vaporized on a heated surface5 and by IR
laser irradiation.6, 7 Chemical ionization causes the least fragmentation and has been used
with particle collection/flash thermal vaporization on the order of minutes.8, 9 Chemical
discharge ionization (ASGDI) has been used to chemically ionize particles with multiple
reagent ions.12
2.1.2 Tandem Mass Spectrometry
Real-time mass spectrometry can detect low mass concentrations, but tandem
mass spectrometry (MS/MS) is necessary for analyte structure identification and mixture
analysis.13-15 The TOFMS instruments most commonly used for aerosol detection are
incapable of performing MS/MS. Quadrupole ion trap mass spectrometers can not only
perform MS/MS but can also readily perform multiple stages of MS/MS (MSn). Single
aerosol particles have been ionized in an ion trap with timed UV laser shots as the
particles passed through the center of the trap. The ions created within the trap are then
available for MSn.16, 17
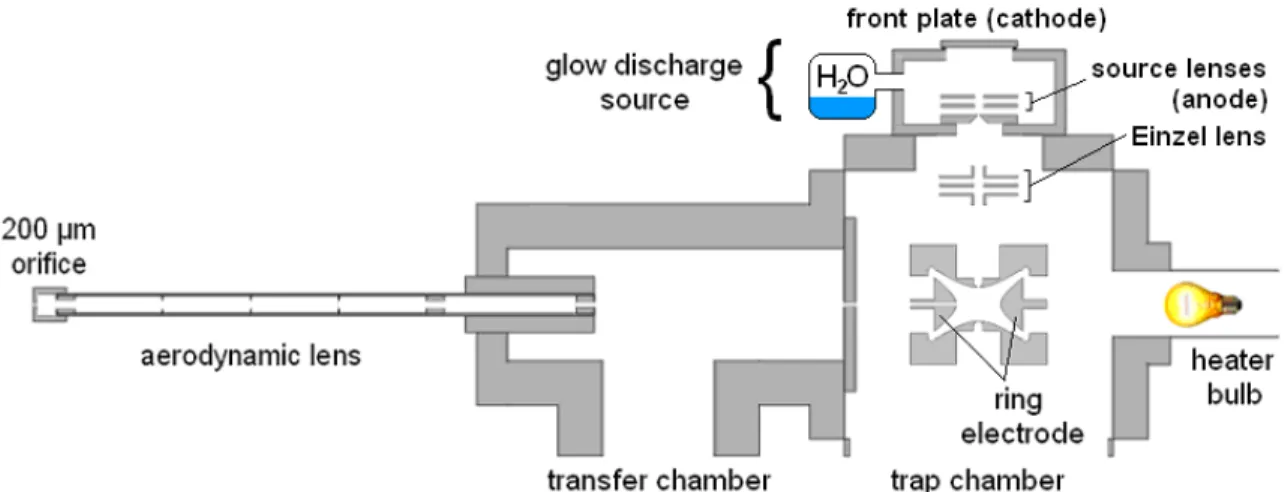
The aerosol quadrupole ion trap mass spectrometer (AQITMS) presented here
characterizes aerosols in real time. An aerodynamic lens18, 19 passes particles though a
hole in one side of the ring electrode into the trapping volume. The particles are
volatilized upon impacting the opposite, inner surface of the heated ring electrode. The
vaporized particles are ionized by selected ion chemical ionization (SICI).20 A mixture of
SOA products from α-pinene ozonolysis carried out in an aerosol bag are detected in real
time at ppb concentrations, and analytes are identified with collision induced dissociation
(CID).
2.2 Experimental
2.2.1 Instrumentation and Aerosol Sampling
A Finnigan ITDTM controlled with modified ITMS (Revision B) software was
18
shown in Figure 2.1. The quadrupole ion trap has a 3.2 mm hole drilled through one side
of the ring electrode for particles to enter the trapping volume. The high vacuum
chamber containing the trapping electrodes has a base pressure of 2.3×10⁻⁵ Torr with the
aerodynamic lens orifice open and 2×10⁻⁷ Torr with the aerodynamic lens orifice closed,
measured by an ion gauge on the chamber. Helium bath gas is added for a constant
pressure of 1.0×10⁻³ Torr for optimum sensitivity of the ion trap. A transfer chamber is
separated from the trap chamber by a 1.8 mm orifice and has a pressure of 80 mTorr. An
aerodynamic lens is inserted in the transfer chamber opposite the orifice to the trap
chamber. The trap chamber is pumped at 280 L/s by the first stage of a Pfeiffer
SplitFlow turbo pump, and the second stage pumps the transfer chamber at 205 L/s.
A Lesker 1000 W stab-in bakeout heater near the trapping electrodes heats the
ring electrode surface to 50-130 °C to aid volatilization. The ring electrode surface
temperature was calibrated against average helium bath gas temperature as measured by a
k-type thermocouple in the trap chamber located 2 cm from the trapping electrodes. A
second k-type thermocouple on an (thermally conductive, electrically isolating) alumina
surface in contact with the ring electrode was used to make the initial calibration. A
temperature of 115 ˚C was used for volatilization unless otherwise noted.
The aerodynamic lens continuously samples air through a 200 µm orifice at 0.3
L/m. Aerosol particles enter through the orifice, passing from atmospheric pressure to
5.1 Torr, as measured by a convection pressure gauge. Particles under 1000 nm diameter
are focused into a beam by passing through the consecutive orifices within the
aerodynamic lens and enter the transfer chamber. The particle beam passes into the trap
20
electrode. Particles impact the opposite, inner surface of the heated ring electrode and
volatilize. The diameter of the particle beam is visually inspected by collecting salt
particles on a slide over the impact site. The salt particle spot has a diameter of
approximately 1.5 mm after traveling a distance of 21.8 cm from the lens exit to impact
within the ion trap.
For comparison of fragmentation patterns from single-component particles, mass
spectra were also acquired with an aerosol time-of-flight mass spectrometer (ATOFMS)
that has been described elsewhere.6, 7 Single particles with greater than 100 nm diameter
were volatilized with a CO2 laser and ionized with 118 nm vacuum UV photoionization.
2.2.2 Aerosol Particle Generation and Size Measurement
Standard single-compound and mixture solutions of organic acids (Sigma
Chemical, St. Louis, MO) were made to between 40 µM to 1.5 mM in water. Aerosol
particles were generated from the solutions with a TSI 3076 constant output atomizer.
Particles were sampled directly with conductive tubing from the particle source to the
aerodynamic lens orifice.
Secondary organic aerosol (SOA) particles were generated by ozonolysis of
α-pinene in a 500 L Teflon bag. The bag was initially filled with air passed through a
MKS 647B mass flow controller. Ozone was generated by passing medical-grade air
through an ozone generator (model L11, Pacific Ozone Technology, Benicia, CA). The
ozone was diluted by a factor of 45 with air before its concentration was determined by a
10 cm long home-built absorption cell monitoring light absorption at λ = 254 nm.21 The
diluted oxygen was then flowed into the bag to a concentration in air. A liquid sample of
allowed to mix for 1-2 minutes. After mixing, the valve on the bag was opened to
conductive tubing to the aerodynamic lens for continuous, direct sampling. Following
the conclusion of an experiment, the bag was evacuated and purged with air, which was
analyzed to ensure that no reaction products remained.
A TSI scanning mobility particle sizer (SMPS) consisting of a 3081 dynamic
mobility analyzer and a 3022a condensation particle counter was used to measure the
mass concentration of particles. Particles with diameters between 14.9 and 673 nm were
counted. Depending on the compound and its concentration in solution, the mean
diameter of the particles formed was between 40 and 100 nm. Aerosol sample lines were
split to the SMPS and to the aerodynamic lens orifice on the AQITMS for simultaneous
measurement of particle mass concentration and acquisition of mass spectra. Ninety
mass spectra were averaged during the 135 s for a SMPS mass measurement. Some 103
particles are sampled by the AQITMS per second, as measured by the SMPS. Given the
reduced transmission efficiency for ultrafine particles with the aerodynamic lens, the
actual number of particles contributing to AQITMS signal is significantly smaller.2
2.2.3 Glow Discharge Ionization Source and Selected Ion Chemical Ionization
H3O+ reagent ions are generated by glow discharge ionization (GDI) of water
vapor in a source region on the trap chamber orthogonal to the transfer chamber and
aerodynamic lens. The source has a base air pressure of 0.05 Torr measured by a
capacitance manometer, and water vapor is leaked in to a pressure of 0.14 Torr. A high
voltage of -850 to -950 V is applied to the front plate cathode to induce a 2.2 mA glow
discharge between the front plate and an anode at -30 V. H3O+ reagent ions from the
22
are continuously supplied to the trap in bulk for volatilization and SICI. SICI occurs by
proton transfer from H3O+ to the higher proton affinity analyte molecules. Another 500
ms period is allotted for SICI before analyte ions are ejected for detection. H3O+ reagent
ions are also generated within the trap for SICI. Some electrons overcome the Einzel lens
barrier to enter the trapping volume and ionize molecules from the residual air in the trap.
Analyte ions are far less abundant than bath gas molecules, and EI is minimal. N2+●
rapidly charge-exchanges with water molecules, and the H2O+● reacts to form more
hydronium ions in the trap. The gate and reaction times and the number of scans
averaged were adjusted depending on the speed and sensitivity required in experiments.
A combined gate and reaction of time of more than 100 ms gave enough signal from
H3O+ reagent ions and O2+● ions to saturate the detector (not shown). Unit mass
resolution was achieved for analyte ions above m/z 50 despite space charge effects from
such excess ion populations.
2.2.4 MS/MS Implementation
Collision induced dissociation of analyte ions was performed by applying
resonant waveform voltages to the endcap trapping electrodes. Stored waveform inverse
Fourier transform (SWIFT) was implemented with LabVIEW to construct the
waveforms.22 A 1.0-2.8 Vp-p SWIFT waveform from an arbitrary waveform generator
was applied to dissociate a parent ion at a qz of 0.25 for CID.
2.3 Results and Discussion
2.3.1 Selected Ion Chemical Ionization
Sensitivity is improved by reducing fragmentation of the protonated molecule or
vacuum UV photoionization, a technique in aerosol particle mass spectrometry designed
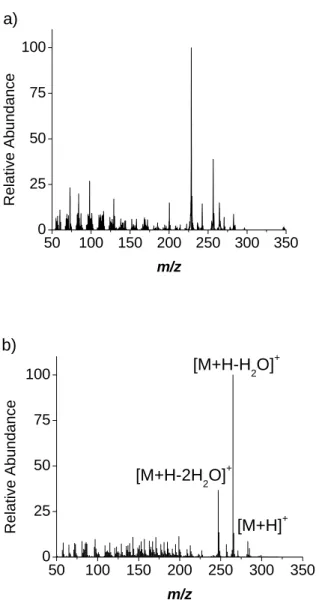
specifically to reduce fragmentation of organic compounds.23 A mass spectrum acquired
from vacuum UV photoionization of volatilized oleic acid particles in the extraction
region of the ATOFMS is shown in Figure 2.2a. The molecular ion comprises less than
1% of total ion signal. The most intense peak in the spectrum comprised 10.6% of total
ion signal and was formed along with many other peaks above and below m/z 200 due to
aliphatic fragmentation. The number of peaks makes assignment difficult and would
greatly complicate spectra from a mixture of compounds. In contrast, a mass spectrum
acquired from SICI of volatilized oleic acid particles in the trapping volume of the
AQITMS is shown in Figure 2.2b. The protonated molecule [M+H]+ comprised 1.5%
total ion signal, but the peaks below m/z 200 have smaller abundance than in the vacuum
UV mass spectrum. Unlike photoionization, the majority of the signal comes from just
two peaks due to water losses from the protonated molecule, [M+H-H2O]+ and
[M+H-2H2O]+. Sensitivity was increased with SICI because the most intense peak is
increased to 16.7% of total ion current. IR laser irradiation has previously been shown to
cause a similar fragmentation pattern to volatilization at several hundred degrees
Celsius.5
2.3.2 Temperature Effects
The temperature of the ring electrode surface and bath gas directly affected ion
fragmentation and sensitivity of SICI mass spectra. Heating the ring electrode was
necessary for efficient volatilization of aerosol particles with low vapor pressure (oleic
24
50 100 150 200 250 300 350 0 25 50 75 100 a) Relative Ab un da nce m/z
50 100 150 200 250 300 350 0 25 50 75 100 b)
[M+H-2H2O]+
[M+H-H2O]+
[M+H]+ Re la tiv e Ab un dan c e m/z
Figure 2.2. a) Vacuum UV photoionization of volatilized oleic acid particles in the
extraction region of a ATOFMS, and b) proton transfer SICI of volatilized oleic acid
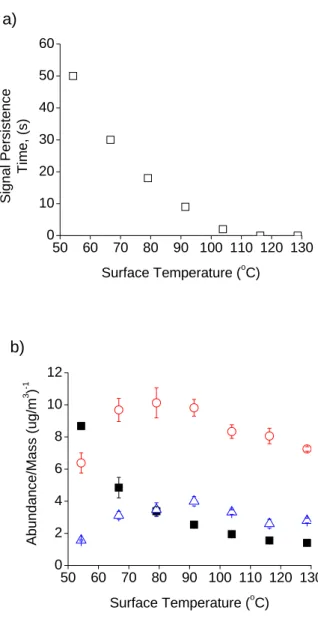
electrode surface and required increasing time to desorb (Figure 2.3a). A ring electrode
temperature of at least 105 ˚C was necessary for instantaneous volatilization of particles
at 100-200 µg/m3 for SICI with no residual signal. Higher minimum surface temperature
was required for increasing particle mass concentration. Conversely, the observed
abundance of H3O+ reagent ions after the same gate time decreased with increasing
temperature in the ion trap chamber. Lower bath gas temperatures caused less
fragmentation of [M+H]+ ions (Figure 2.3b), and background also decreased with
decreasing temperature. To balance the effects, the minimum surface temperature is used
for volatilization without signal persistence. Signal response was linear with particle
mass concentration at a given volatilization temperature. Oleic acid particles at mass
concentrations from 10-1100 µg/m3 were volatilized at 115 ˚C for linear signal response
with R2 = 0.995 (Figure 2.4). The volatilization temperature could also be reduced for
more sensitive detection of lower particle concentrations. The limit of detection (S/N ≥3)
was 5 µg/m3 for oleic acid volatilized at 80 ˚C.
2.3.3 Characterization of Aerosol Particle Standards
Homogeneous pinic acid or pinonic acid aerosol particles were analyzed with the
AQITMS. A typical mass spectrum for pinic acid is shown in Figure 2.5a. The most
abundant product ion in the mass spectrum is [M+H-H2O]+ at m/z 169, and a significant
abundance of [M+H-2H2O]+ was also observed. Several other fragment ions were also
observed. The pinonic acid mass spectrum also has water-loss fragment ions, at m/z 167
and m/z 149, but other fragment ions were more abundant (Figure 2.5b). The structural
similarity of the molecules produced two identical fragment ions at m/z 125 and 115,
26
50 60 70 80 90 100 110 120 130 0 10 20 30 40 50 60 a) Si gna l P e rsiste nce Ti m e , ( s )
Surface Temperature (oC)
50 60 70 80 90 100 110 120 130 0 2 4 6 8 10 12 b) Abun dance/Mas s ( ug/m 3 ) -1
Surface Temperature (oC)
Figure 2.3. SICI of oleic acid particles at 100-200 µg/m3 at different temperatures of the
ring electrode surface: a) time for signal to decay to baseline after particle source is
removed, and b) analyte ion abundance normalized by particle mass concentration for
[M+H]+ (■), [M+H-H
0 200 400 600 800 1000 1200 0
1000 2000 3000 4000 5000 6000 7000
Ab
unda
nce
Total Particle Mass (ug/m3)
Figure 2.4. AQITMS signal abundance from oleic acid particles volatilized at 115 ˚C for
[M+H]+ (■), [M+H-H
28
0 25 50 75 100 125 150 175 200 0
500 1000 1500
[M+H-2H2O]+
[M+H-H2O]+
a)
Abundance
m/z
0 25 50 75 100 125 150 175 200 0
500 1000 1500 2000
[M+H-2H2O]+
[M+H-H2O-CO]+
[M+H-H2O]+
b)
Abu
ndan
ce
m/z
AQITMS signal was compared against particle mass concentration as measured
by the SMPS to make calibration curves. Mass spectra of pinic acid particles at
concentrations up to 170 µg/m3 were observed with linear signal response at R2 = 0.998,
and the limit of detection (S/N ≥ 3) of [M+H-H2O]+ was 20 µg/m3. The mass
concentration of pinonic acid could not be accurately measured with the SMPS at the
same residence time, and a calibration curve could not be made. The finite residence
time of particles in the dynamic mobility analyzer before detection with the condensation
particle counter provides enough time for partial evaporation of more volatile compounds
in particles. Although both compounds are generally classified as low volatility, the
thirty times higher calculated vapor pressure of pinonic acid (1.84×10⁻² Pa) compared to
pinic acid (5.87×10⁻⁴ Pa) caused significant underestimation of particle mass by the
SMPS compared to pinic acid.
2.3.4 Multi-component Aerosol Particles
Multi-component particles were generated from different solution mixtures of
pinic acid and pinonic acid. Ninety mass spectra were acquired at each of three different
particle mass concentrations for five mole ratios of pinic acid to pinonic acid. Fragment
ions from each compound were identified based on mass spectra of single-component
particles. For each set of averaged AQITMS spectra, the intensities of the five most
abundant fragment ions for each component compound were summed to find the total
signal for pinic acid and pinonic acid, respectively. Finally, the ratio of pinic acid signal
to pinonic acid signal was plotted against the mole ratio of the compounds in solution.
The resultant linear calibration curve had a slope of 0.5519 and R2 = 0.996. The plot
30
in the total. Fragment ions m/z 125 and 115 cannot be assigned when both compounds
are present, and low-abundance fragment ions might not be observed over noise at low
particle mass concentrations. Using the same mass spectra, the ratio of pinic acid signal
to pinonic acid signal was also computed from the abundance of the largest observed ion
for each compound, [M+H-H2O]+. The single ion linear calibration curve of AQITMS
signal ratio against mole ratio of the compounds in solution had a slope of 1.6046 and R2
= 0.995. The greater slope reflects the reduced fragmentation of pinic acid [M+H-H2O]+
compared to pinonic acid. The linearity of the mole ratio calibration curves verifies that
all compounds in mixture particles are volatilized with equal efficiency, despite the
difference in vapor pressure of the composite compounds.
Unlike the signal response from the AQITMS, total mass concentration
measurements with the SMPS did not have a linear relationship to the ratio of
components in particles. The different vapor pressures of pinic acid and pinonic acid at
the same residence time in the SMPS caused nonlinear response with increasing amounts
of pinonic acid. Empirical corrections could be made for a simple mixture of two known
components to compensate for mass loss in the SMPS. However, the complexity of a
bulk sample containing multiple different, possibly unknown components with different
vapor pressures suggests that a common SMPS residence time giving accurate results is
difficult to discover and would require extensive empirical study. A single component
compound with low vapor pressure is used as an internal standard to measure the
concentration of other compounds. The pinic acid single-component calibration curve
against the SMPS gives mass concentration based on AQITMS signal, and the mole ratio
ratio. Comparing the signal ratios between one fragment ion per analyte reduces the
likelihood of another compound contributing an isobaric ion.
2.3.5 Secondary Organic Aerosol Detection
Secondary organic aerosol particles from ozonolysis of α-pinene were sampled
from an aerosol bag for real-time detection with the AQITMS. The bag contained 200
ppb ozone in air, and the 0.3 µL sample of α-pinene injected into the bag yielded a
volumetric concentration of 100 ppb. SOA particles were detected in the first spectrum
acquired after the bag was opened to the sampling orifice. Particles were observed
continuously over the next 5.5 hours until sampling was ended. Thirty scans of the
AQITMS were averaged during every 38 s period after sampling began. AQITMS
particle signal grew steadily for the first 42 minutes during particle nucleation and growth
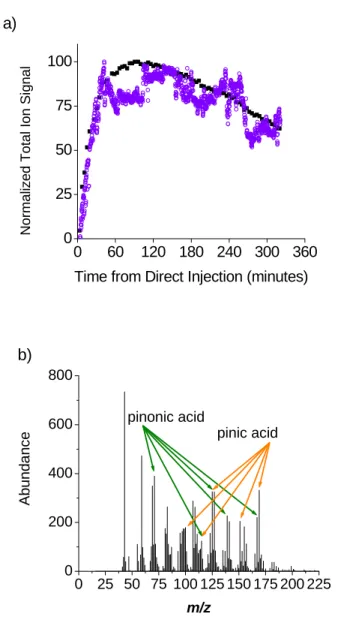
(Figure 2.6a).24 Total particle signal and mass concentration fluctuated compared to
SMPS measurements throughout the remaining sample time as different SOA compounds
were formed at different rates and may have undergone tertiary reactions. Overall signal
gradually decayed as particles were lost to the walls of the bag. Pinic acid and pinonic
acid fragment ions were observed along with ions from other SOA compounds
throughout the sample time, and a typical spectrum is shown in Figure 2.6b. The relative
intensities of some fragment ion signals associated with either acid did not have the same
proportion to [M+H-H2O]+ ions as in the spectra of single-component particles. Other
ozonolysis reaction products with similar structure25-27 that have not been characterized
with the AQITMS form the isobaric or isomeric.
The changing concentrations of SOA particle components throughout the analysis
32
0 60 120 180 240 300 360 0
25 50 75 100
a)
Normali
z
ed Total
Ion Si
gn
al
Time from Direct Injection (minutes)
0 25 50 75 100 125 150 175 200 225 0
200 400 600 800
b)
pinonic acid
pinic acid
Abunda
nc
e
m/z
Figure 2.6. SOA particles from reaction of 200 ppb ozone with 100 ppb α-pinene in air,
a) normalized AQITMS total ion signal (○) and normalized SMPS total particle mass
concentration (■) throughout sampling time, and b) 100 minutes after direct injection of
[M+H-H2O]+ ion signals in each spectrum was used to calculate the actual mole ratio of
the compounds in the multi-component SOA particles using the previous mole ratio
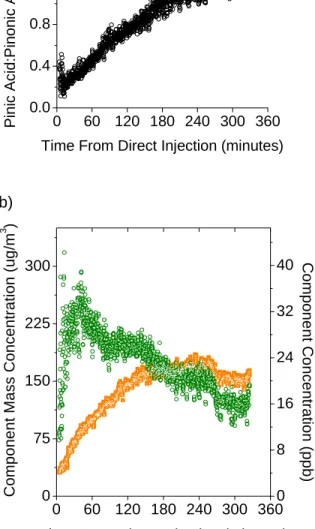
calibration curve (Figure 2.7a). The observed mole ratio fell within the limits of the
calibration curve. The real-time concentration in the bag and partial mass concentration
in particles was calculated for pinic acid from the abundance of pinic acid [M+H-H2O]+
ions and the single-component particle SMPS calibration curve (Figure 2.7b). Pinonic
acid increased by four times to peak at 36 ppb at the same time as overall ion signal, and
pinic acid increased by six times over four hours to 24 ppb. The combined mass
concentration of pinic acid and pinonic acid varied directly with the total particle signal
throughout sampling time (Figure 2.8), although other SOA compounds contributed the
majority of the signal.
2.3.6 Tandem Mass Spectrometry
Tandem mass spectrometry identifies compounds in aerosols by the product ions
unique to different compounds. CID of the oleic acid formed many product ions. The
most abundant product ion from CID of oleic acid [M+H-H2O]+ came from a second
water loss (Figure 2.9). CID of either water loss ion produced three ion series from the
double bond in oleic acid and double bonds formed after dehydration. Pinic acid and
pinonic acid gave fewer product ions. CID of [M+H-H2O]+ ions usually caused
(additional) water loss and CO loss from oxygenated functional groups, and MSn of pinic
acid [M+H-H2O]+ was necessary to form enough product ions to identify the compound.
Ions from SOA particles were identified as they were formed in real time. The
respective [M+H-H2O]+ ions were used to identify pinic acid and pinonic acid despite not
34
0 60 120 180 240 300 360 0.0 0.4 0.8 1.2 1.6 2.0 a) Pinic Acid:Pin on ic Acid M o le Ra ti o
Time From Direct Injection (minutes)
0 60 120 180 240 300 360 0
75 150 225 300
Time From Direct Injection (minutes)
Component Mass C oncent ration (ug /m 3 ) 0 8 16 24 32 40 b) C o mponent C o ncentrat ion (ppb)
Figure 2.7. As a function of time from after direct injection of α-pinene into aerosol bag,
a) mole ratio of pinic acid to pinonic acid in SOA particles, and b) mass concentration in
particles (µg/m3) and concentration in aerosol bag (ppb) of pinic acid (orange □) and
0 60 120 180 240 300 360 0
150 300 450 4000 8000 12000
A
bun
da
nce
Time From Direct Injection (Minutes)
Figure 2.8. The total AQITMS particle signal counts (■) and the combined calibrated
mass measurements of pinic acid and pinonic acid in µg/m3 (○) as a function of time
36
50 100 150 200 250 300
0 20 40 60 80 400 800 1200 165 163 151 149 13 7 13 5 125 123 12 1 11 1 97 83 17 7 19 1 109 95 81
-H2O [M+H-H 2O] + Abundance m/z
Figure 2.9. CID of oleic acid [M+H-H2O]+ (red trace). Product ions in are denoted by
particles. Smaller mass-to-charge fragment ions may be identical to fragment ions from
uncharacterized SOA compounds with similar structures and would not be differentiated
by CID. Pinic acid [M+H-H2O]+ at m/z 169 can be formed by dehydration of either of
two carboxylic acids, and CID produced a second water loss (Figure 2.10a). More
informative product ions are required to distinguish pinic acid in the SOA mixture. MSn
dissociation of [M+H-2H2O]+ produced losses of CO or CH2CO. [M+H-H2O]+ from
pinonic acid is formed by dehydration of the single carboxylic acid, and dissociation of
m/z 167 produced a second water loss from the ketone and/or loss of either remaining
CH2CO group (Figure 2.10b). The unique CID product ions for both compounds
matched the reference spectra of each. The real-time identification of [M+H-H2O]+ ions
from pinic acid and pinonic acid as the only ions at their respective mass-to-charge values
confirms the observed AQITMS signals as the basis for concentration calculations.
2.4 Conclusions
The AQITMS performs aerosol particle detection and analysis using a sensitive,
efficient, and MSn-capable instrumental design. Particles are delivered to the heated
trapping volume via an aerodynamic lens and volatilized. Proton transfer SICI ionizes
the analyte and causes less fragmentation than vacuum UV photoionization and EI. The
most abundant analyte ions are [M+H]+, [M+H-H2O]+, and [M+H-2H2O]+ for the
analytes studied, allowing detection of aerosol compound concentrations as low as 5
µg/m3. SICI signal has some dependence on volatilization temperature, but using the
present parameters the AQITMS can detect a dynamic range of single-component particle
mass concentration over two orders of magnitude. The AQITMS can also detect a single
38
0 25 50 75 100 125 150 175 200 0 50 100 150 200 a) -2CO
-CH2CO
-CO
[M+H-2H2O]+
[M+H-H2O]+
Abun
da
nce
m/z
0 25 50 75 100 125 150 175 200 0 25 50 75 100 b)
-H2O-CH2CO
-CH2CO
-H2O
[M+H-H2O]+
Abun
dan
c
e
m/z
Figure 2.10. CID of fragment ions observed from α-pinene ozonolysis for a) pinic acid
[M+H-H2O]+ (red trace) and [M+H-2H2O]+ (blue trace) at 70 minutes after direct
injection, and b) pinonic acid [M+H-H2O]+ (red trace) at 50 minutes after direct injection.
α-pinene are detected in real time, and the mole ratio and mass concentration are
calculated for pinic acid and pinonic acid. Pinic acid is a suitable internal standard
because the fragment ion [M+H-H2O]+ has high relative abundance and is observed
throughout the ozonolysis reaction. The low vapor pressure of pinic acid allows accurate
concentration measurement with the SMPS, and pinic acid is commercially available for
comparison to other compounds in mixture standards. Finally, tandem mass
spectrometry with the AQITMS allows the characterization of aerosols compounds. SOA
ions are identified to confirm the signal basis for standardized concentration
measurements. The fast response of AQITMS detection and ease of CID allow
40 2.5 References
1. Sullivan, R. C.; Prather, K. A. Recent Advances in Our Understanding of
Atmospheric Chemistry and Climate Made Possible by On-Line Aerosol Analysis Instrumentation. Anal. Chem. 2005, 77, 3861-3886.
2. Nash, D. G.; Baer, T.; Johnston, M. V. Aerosol mass spectrometry: An
introductory review. Int. J. Mass Spectrom. 2006, 258, 2–12.
3. McKeown, P. J.; Johnston, M. V.; Murphy, D. M. On-line single-particle analysis
by laser desorption mass spectrometry. Anal. Chem. 1991, 63, 2069–2073.
4. Mansoori, B.; Johnston, M.; Wexler, A. Quantitation of ionic species in single
microdroplets by online laser desorption/ionization. Anal. Chem. 1994, 66,
3681-3687.
5. Sykes, D. C.; Ephraim Woods, I.; Smith, G. D.; Baer, T.; Miller, R. E. Thermal
Vaporization-Vacuum Ultraviolet Laser Ionization Time-of-Flight Mass Spectrometry of Single Aerosol Particles. Anal. Chem. 2002, 74, 2048-2052.
6. Woods, E., III; Smith, G. D.; Dessiaterik, Y.; Baer, T.; Miller, R. E. Quantitative
Detection of Aromatic Compounds in Single Aerosol Particle Mass Spectrometry. Anal. Chem. 2001, 73, 2317-2322.
7. Rosen, E. P.; Garland, E. R.; Baer, T. Ozonolysis of Oleic Acid Adsorbed to Polar
and Nonpolar Aerosol Particles. Journal of Physical Chemistry A 2008, 112,
10315–10324.
8. Voisin, D.; Smith, J. N.; Sakurai, H.; McMurry, P. H.; Eisele, F. L. Thermal
Desorption Chemical Ionization Mass Spectrometer for Ultrafine Particle Chemical Composition. Aerosol Science and Technology 2003, 37, 471-475.
9. Tobias, H. J.; Ziemann, P. J. Compound identification in organic aerosols using
temperature-programmed thermal desorption particle beam mass spectrometry. Anal. Chem. 1999, 71, 3428-3435.
10. Hearn, J. D.; Smith, G. D. A Chemical Ionization Mass Spectrometry Method for
the Online Analysis of Organic Aerosols. Anal. Chem. 2004, 76, 2820-2826.
11. Kercher, J. P.; Riedel, T. P.; Thornton, J. A. Chlorine activation by N2O5:
simultaneous, in situ detection of ClNO2 and N2O5 by chemical ionization mass spectrometry. Atmospheric Measurement Techniques 2009, 2, 193-204.
12. Dalton, C. N.; Jaoui, M.; Kamens, R. M.; Glish, G. L. Continuous Real-time

![Figure 2.4. AQITMS signal abundance from oleic acid particles volatilized at 115 ˚C for [M+H] + (■), [M+H-H 2 O] + (○), and [M+H-2H 2 O] + (∆), (95% confidence error bars)](https://thumb-us.123doks.com/thumbv2/123dok_us/8278416.2192345/43.918.287.628.127.401/figure-aqitms-signal-abundance-oleic-particles-volatilized-confidence.webp)