Frontiers in Public Health Services and
Systems Research
Volume 3 | Number 3 Article 3
August 2014
Temporal Trends in Local Public Health
Preparedness Capacity
Christine A. Bevc
University of North Carolina - Chapel Hill, [email protected]
Mary V. Davis
Anna P. Schenck
University of North Carolina at Chapel Hill, [email protected]
Follow this and additional works at:https://uknowledge.uky.edu/frontiersinphssr
Part of theHealth Policy Commons,Health Services Research Commons, and theOther Public Health Commons
This Article is brought to you for free and open access by the Center for Public Health Systems and Services Research at UKnowledge. It has been accepted for inclusion in Frontiers in Public Health Services and Systems Research by an authorized administrator of UKnowledge. For more information, please [email protected].
Recommended Citation
Bevc CA, Davis MV, Schenck AP. Temporal Trends in Local Public Health Preparedness Capacity. Front Public Health Serv Syst Res 2014; 3(3).
ABSTRACT
Local health departments (LHDs) are essential to emergency preparedness and response activities. Since 2005, LHD resources for preparedness, including personnel, are declining in the face of continuing gaps and variation in the performance of preparedness activities. The effect of these funding decreases on LHD preparedness performance is not well understood. This study examines the performance of preparedness capacities among NC LHDs and a matched national comparison group of LHDs over three years. We observe significant decreases in five of eight preparedness domains from three years of survey data collected from 2010 through 2012. Most notably, we observe significant decreases in theSurveillance & Investigationdomain. Performance decreases may be a result of continued, compounding declines in preparedness funding.
Keywords
public health preparedness, local health departments, preparedness capacity, panel data
Cover Page Footnote
The authors thank Glen P. Mays, James Bellamy, Cammie Marti, John Wayne, Carol Gunther-Mohr, and Edward Baker for their assistance in the development, implementation, and analysis of the Local Health Department Preparedness Capacity Survey (PCAS). The research was carried out by the North Carolina Preparedness and Emergency Response Research Center at the University of North Carolina at Chapel Hill’s Gillings School of Global Public Health and was supported by the Centers for Disease Control and
Prevention (CDC) Grant 1Po1TP000296. The contents are solely the responsibility of the authors and do not necessarily represent the official views of CDC. Additional information can be found at
ocal health departments (LHDs) have statutory authority to perform key functions including community health assessments and epidemiologic investigations, enforcement of health laws and regulations, and coordination of the local public health system.1 Since 2002, Congress has appropriated over $9 billion to state and LHDs to develop and implement all hazards public health preparedness2, which has led to improvements in surveillance, public health laboratories, communications, and surge capacity. Despite these early gains, funding has declined more than 38% between Fiscal Years 2005 to 2012.3 Funding cuts have resulted in declining resources for preparedness (NACCHO Profile 2010 data accessed at naccho.org October 25, 2013). The effect of decreases in preparedness funding on preparedness performance is not well understood. This study examines the performance of preparedness capacities among LHDs from North Carolina and a propensity-score matched national comparison group.
METHODS
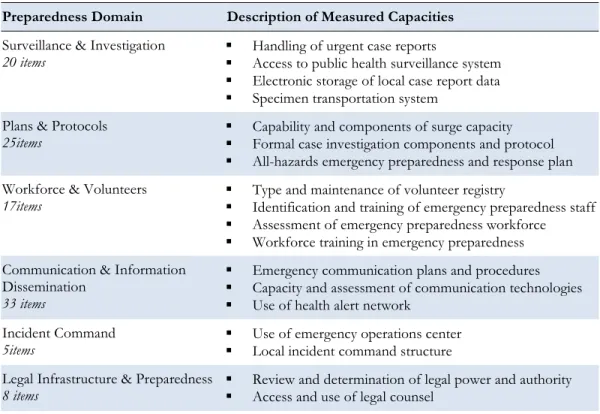
Over a three year period (2010-2012), the North Carolina Preparedness and Emergency Response Research Center (NCPERRC) invited 333 LHDs from 40 states to participate in the Local Health Department Preparedness Capacities Survey (PCAS). 4 PCAS measures LHD performance across a range of preparedness activities and identifies opportunities for future preparedness improvements. Having undergone extensive validity and reliability testing,4 the self-administered survey includes 58 questions with 211 sub-questions about specific preparedness or response capacities that are organized into eight domains (Table 1).
Table 1: Description of Preparedness Domains and Capacity Measures
Preparedness Domain Description of Measured Capacities
Surveillance & Investigation 20 items
Handling of urgent case reports
Access to public health surveillance system Electronic storage of local case report data Specimen transportation system
Plans & Protocols 25items
Capability and components of surge capacity Formal case investigation components and protocol All-hazards emergency preparedness and response plan
Workforce & Volunteers 17items
Type and maintenance of volunteer registry
Identification and training of emergency preparedness staff Assessment of emergency preparedness workforce Workforce training in emergency preparedness
Communication & Information Dissemination
33 items
Emergency communication plans and procedures Capacity and assessment of communication technologies Use of health alert network
Incident Command 5items
Use of emergency operations center Local incident command structure
Legal Infrastructure & Preparedness 8 items
Review and determination of legal power and authority Access and use of legal counsel
L
3 Bevc et al.: Trends in Preparedness
Emergency Events & Exercises 4 items
Determination of emergency events and exercises
Corrective Action Activities 28 items
Debriefing activities Evaluation activities Reporting activities
Each domain represents an equally weighted proportion of aggregate reported capacities, whereby the proportion of capacities within each domain’s sub-questions is averaged across the domain. LHDs were selected using a propensity score matching methodology based on a set of representative public health agency and system characteristics obtained from the National Association of County and City Health Officials 2010 Profile (n=2,151) and Area Health Resource File (ARF) of the Department of Health and Human Services, Bureau of Health Professions, Office of Research and Planning (n=3,225). The PCAS sample included 85 NC LHDs and 248 LHDs distributed across 39 states. For all three years, the overall response was 75%, with two hundred sixty-four LHDs from 29 states responding to the survey.
Our analysis offers an initial review of changes in LHD preparedness capacity s over three years of survey data. We examine the mean domain preparedness scores along with the upper and lower 95% confidence limits for these mean scores. To compare the domain scores of LHDs over time, we use the Wilcoxon Signed-Rank test to determine whether there is a significant difference in the data without the assumption of a normal distribution (due to the varied skew and kurtosis of the data).
RESULTS
Over the three years, we observed a general decrease in levels of preparedness capacity for five out of eight domains. Among these eight domains, we see fluctuations in preparedness between 2010 and 2011, as well as 2011 and 2012. For example, in Workforce & Volunteer capacities, we observed an initial decrease between 2010 and 2011 followed by an increase capacity scores between 2011 and 2012, resulting in near equal levels between 2010 and 2012.
Examining these changes more closely, Table 2 presents the averages and confidence limits for the three years of the survey. Overall, between 2010 and 2012, we observe statistically significant decreases in five preparedness domain scores (Surveillance & Investigation, Plans & Protocols, Communication, Incident Command, and Legal Preparedness). We also observed a decrease (not significant) in Exercises and Emergency Events and slight increases (not significant) in Workforce and Volunteers and
Corrective Action domain scores over the three survey years.
Table 2: Variation in LHD Domain Preparedness Capacity, 2010-2012
Domain 2010 2011 2012
2010-2012 Difference
The decline in the Surveillance & Investigation domain is most notable between 2010 and 2012, where capacity scores decreased significantly from 0.64 to 0.46, reflecting potential changes in surveillance systems, urgent case management, and/or other means of investigation support. Within the domain of Plans & Protocols, the significant decline observed between 2010 and 2011 was followed by a modest increase in capacity in the year that followed. These shifts may stem from changes in local preparedness capacity associated with surge capacity, formal case investigations, and/or local all-hazards planning. Additional research is needed to explore the various aspects and dimensions of each domain to more clearly identify potential losses (and gains) in preparedness capacity.
IMPLICATIONS
While this analysis does not explore each domain in-depth, there was considerable variation in preparedness capacity across domains and over time. More importantly, there were statistically significant declines in preparedness capacities in five domains over the three years. Previous findings suggest observed decreases in preparedness capacities may be a result of continued, compounding declines in preparedness funding.3 The sample population includes LHDs from NC, a state with a robust preparedness and accreditation program, as well as LHDs who have participated in other performance programs, including Project Public Health Ready, the Public Health Accreditation Board Beta-Test, and the National Public Health Performance Standards Program. Previous analysis of the 2010 PCAS data indicates that LHDs participating in these performance programs perform better on preparedness capacities.5 The extent to which program participation impacts performance over time warrants additional data analysis.
Performance decreases may be a result of continued, compounding declines in preparedness funding. Additional investigation is underway to determine the extent to which these changes extend to more specific capacities within domains. For example, in the Surveillance and Investigation domain, it is important to determine whether declines occurred in surveillance systems, urgent case management, and/or other means of investigation support. Significant declines in capacities, as observed in the Surveillance and Investigation domain, represent not only key preparedness responsibilities, but also basic functions of public health departments. These findings support the call for reliable federal funding and decision making to modernize the public health system to address decreases in capacity and the potentially detrimental effects on essential services.
SUMMARY BOX
What is already Known About this Topic? LHD performance, including
performance of preparedness functions is variable. Although there has been a considerable investment in public health preparedness, this investment has declined over the last several years.
What is Added by this Report? Surveys of LHDs from 29 states reveal significant declines in preparedness capacity between 2010 and 2012 in five of eight preparedness domains.
What are the Implications for Public Health Practice, Policy and, Research? Significant decreases were observed in preparedness capacities for five of eight domains from 2010-2012. Additional research is needed to identify for which capacities there were declines and examine the extent to which these decreases are directly related to declines in funding and mitigated by LHD participation in preparedness and performance programs.
5 Bevc et al.: Trends in Preparedness
REFERENCES
1. Scutchfield FD, Knight EA, Kelly AV, Bhandari MW, Vasilescu IP. Local public health agency capacity and its relationship to public health system performance. Journal of Public Health
Management and Practice. 2004;10(3):204-215.
2. Centers for Disease Control and Prevention. Funding and guidance for state and local health departments. Office of Public Health Preparedness and Response.
http://www.cdc.gov/phpr/coopagreement.htm. Updated 2013. Accessed February 2, 2013.
3. Trust for America’s Health. Protecting the Public’s Health from Diseases, Disasters, and Bioterrorism, 2012. Washington, DC.
http://healthyamericans.org/assets/files/TFAH2012ReadyorNot10.pdf. Accessed January 23, 2014.
4. Davis, MV, Mays, G, Bellamy, J, Bevc, C, Marti, C. Improving Public Health Preparedness Capacity Measurement: Development of the Local Health Department Preparedness Capacities Assessment Survey. Disaster Medicine and Public Health Preparedness. 2013. 7:578-584.
DOI:10.1017/dmp.2013.108.