Introduction
Cesarean delivery is the most common surgery performed in the world, and a large part of these operation interventions are performed without a medical indication.[1] Therefore, the global number of women undergoing cesarean section based on their choice and without any medical indication is rising. The main cause of this tendency is not obvious, however, some factors such as the need to control and plan for the delivery date and psychological factors, such as fear of childbirth, and previous experience of delivery are the major factors that play a role in the willingness of women to do a cesarean section. Also a part of this increase is because of the changed attitudes of pregnant women and healthcare providers to the delivery methods, which can substantially increase incidence of cesarean
Address for correspondence: Zahra Abbaspoor,
Department PhD in
Reproductive Health, Assistant Professor, Department of Midwifery, Reproductive Health Promotion Research Center, Ahvaz Jundishapur University of Medical Sciences, Ahvaz, Iran. E-mail: Abbaspoor_z762@ yahoo.com
Access this article online
Website: www.ijnmrjournal.net DOI:
10.4103/ijnmr.IJNMR_147_15 Quick Response Code:
Abstract
Background: The rate of mothers undergoing cesarean section in the absence of medical indication is increasing in the world. Women attitude have an essential role in the request or selecting a birth mode. This study aimed to develop a scale for measuring attitude toward birth method selection.
Materials and Methods: The study was conducted in two qualitative and quantitative parts. Data collection was conducted from June to December 2012 in Ahvaz, Iran. In the qualitative part of the study, 21 interviews were conducted with pregnant or parturient women and key informants. Consequently, content and face validity were performed to provide a pre‑final version of the questionnaire. Then, in the quantitative part of the study, validity, exploratory factor analysis, and reliability were performed to assess the psychometric properties of the scale. Results: A130‑item questionnaire was developed through the qualitative phase. It was reduced to an 82‑item questionnaire after content and face validity. Exploratory factor analysis loaded a 68‑item with an 8‑factor solution (“beliefs and attitudes,” “sexual and physical attitudes,” “fear of childbirth,” “preference of convenience, health, and supporting,” “socio‑ cultural norms,” “confidence to the birth practitioner,” “personal and practical choice,” and “sources of motivations,” which jointly accounted for 42.97% of the observed variance. Cronbach’s alpha coefficient showed excellent internal consistency (α = 0.87), and test–retest of the scale with 2‑week intervals indicated an appropriate stability for the scale (0.89). Conclusions: The findings showed that the designed questionnaire was a valid and reliable instrument for indicating the pregnant womens’ attitudes to their birth method selection. Also, ATBMS is an easy use questionnaire and contains the most significant factors persuading women to choose vaginal delivery or cesarean section.
Keywords: Birth method, cesarean section, Iranian women, selection, questionnaire
Development of a Questionnaire to Measure Attitude Toward Birth Method
Selection
Original Article
Lida
Moghaddam-Banaem1,
Fazlollah Ahmadi2,
Anoshirvan
Kazemnejad3,
Zahra Abbaspoor4
1Department of Midwifery and Reproductive Health, Faculty of Medical Sciences, Tarbiat Modares University, Tehran, Iran, 2Department of Nursing, Faculty of Medical Sciences, Tarbiat Modares University,Tehran, Iran, 3Department of Biostatistics, Faculty of Medical Sciences, Tarbiat Modares University, Tehran, Iran, 4Department of Midwifery, Reproductive Health Promotion Research Center, Ahvaz Jundishapur University of Medical Sciences, Ahvaz, Iran
How to cite this article: Moghaddam-Banaem L, Ahmadi F, Kazemnejad A, Abbaspoor Z. Development of a questionnaire to measure attitude toward birth method selection. Iranian J Nursing Midwifery Res 2017;22:147-56.
Received: October, 2015. Accepted: July, 2016. section.[2,3] Maternal request cesarean section rates range from 1 to 48%.[4] In the UK, 3.3–12% of nulliparous women preferred to have a cesarean delivery.[5,6] According to a report of World Health Organization (WHO) (2010), cesarean birth rate in Iran (2008) was 41.9% of total deliveries,[7] and the frequency of elective caesarean section varied from 6–17%,[8] whereas the recommendation for the number of cesarean birth was up to 15% by 2010.[9] In a recent study to explore the attitudes of obstetricians to perform a cesarean section on maternal request in the absence of medical indication showed that the differences in obstetricians’ attitudes were not founded on concrete medical evidence, and cultural factors, legal liability, and variables associated with the specific perinatal care organization of the various countries played a role.[10]
This is an open access article distributed under the terms of the Creative Commons Attribution‑NonCommercial‑ShareAlike 3.0 License, which allows others to remix, tweak, and build upon the work non‑commercially, as long as the author is credited and the new creations are licensed under the identical terms.
On the basis of this increasing rate of cesarean section in Iran, health policy makers follow some programs to reduce the number of unnecessary caesarean sections, and they are searching for acceptable ways for reducing the rate but do not increase the rate of fetomaternal death due to performing non on‑time cesarean section. Developing and applying these policies requires adequate information about one of the most important factors underlying such maternal requests for cesarean section.[11,12] Therefore, a tool for measuring the birth method selected and comprehensively evaluating the factors that affect the choice of birth method by mothers is required. All the tool maker experts agree on that the contents of the tool should be directly extracted from people who are tool references reference and it must consider in the item generation and also wording of the questions.[13] If the birth method selection items be extracted directly from the views of participants, it can be made ensure that this tool covers all aspects of the study concepts. In addition, the content of a tool should be matched with the culture and lifestyle of the communities and countries in which the tool is applied. A tool that is designed in a particular country only reflects the language and culture of that society, and using it in another community even after accurate translation will result in many problems due to inappropriate content.[14]
To date, there are two instruments that have been specifically designed to address fear associated with childbirth, namely, fear of childbirth, Wijma‑Wijma,[15] and childbirth experience questionnaire (CEQ).[16]
However, there remains a dearth of adequately validated instruments on attitude of women regarding factors that affect their birth method selection. Therefore, considering that the choice of birth method is rooted in cultural, social, and economical context and lack of a valid tool in Iran and others countries regarding factors predicting choice of birth methods, this study was designed with the propose of development and psychometric assessment of a multidimensional questionnaire regarding attitude toward birth method selection (ATBMS) in Iranian pregnant women.
Such instruments could help to understand the prespectives of health professionals and policy makers and in turn help in designing comprehensive interventional programs for controlling the rate of cesarean birth method.
Materials and Methods
Scale development
A descriptive qualitative design using a content analysis approach was conducted to explore what does birth method selection means to pregnant women and what factors affect their decision making on the birth method. For data analysis, content analysis Granhaym‑Landmn (2004) was used.[17]
This study was conducted in two stages. First, in qualitative phase and determining the dimensions of the delivery method, 21 interviews were conducted with a sample of pregnant or parturient women delivered through normal vaginal delivery or cesarean section, their partners, obstetrics, and midwives. Participants were recruited from three semi‑public and public hospitals and two healthcare centers affiliated to the Ahvaz Jundishapur University in an urban area in the south of Iran.The average number of daily births in these centers was 4 to 10. Data collection was conducted from June to December 2012. Unstructured interviews were held with the participants by the first author. The location of interviews was the health centers or postpartum wards convenient to the participants. In total, 21 sessions were held and unstructured in‑depth individual interview with 18 pregnant and parturient women (4 pregnant and 14 postnatal) and 3 with key informants was conducted. Inclusion criteria for the selection of the participants were: Over or equal to 18‑year‑old individuals; with an experience of selection of a birth method; and being pregnant in the third trimester or in their first week postpartum period after cesarean section or vaginal delivery at the time of data collection. Suffering from severe medical complications and having any difficulty in communicating in Persian language were exclusion criteria. Maximum variation was achieved in sampling through selection in terms of women’s social class, economic status, educational and employment status, and being in pregnancy or postpartum period.[17] Interviews were started with the general question “How did you decide to undergo the natural delivery process or cesarean section,” along with probing questions regarding how they chose their birth method.
Each interview lasted approximately 30 to 60 min. All the interviews occurred with the first researcher in a separate room in the health center or in postpartum wards. Data collection and data analysis were conducted concurrently (conventional analysis) and interviews were continued until the interviews did not add any new data and the data were saturated.
To analyze the data, the interviews were transcribed verbatim and read several times to reach an overall understanding of women’s perspectives on choosing the birth method. At first, meaning units as words, sentences, or paragraphs were identified, then they were abstracted and labeled with codes, after that, the codes were sorted into sub‑categories and categories, based on their similarities and differences and finally, themes were emerged.[17] Trustworthiness of the results also was investigated. As suggested, four criteria were considered for the trustworthiness, namely, credibility, transferability, dependability, and confirmability.[18,19] The theoretical and operational definitions by using the themes, categories, and subcategories were extracted by using these definitions and using meaning units from the content of interviews, related items that represent an aspect of the birth method selection were designed. These items were the
base of questions in ATBMS questionnaire. In the second stage of study, the validity and reliability of questionnaire was investigated.
Validity
To check the validity of the questionnaire, content validity, face validity, and construct validity (exploratory factor analysis) were used.
Content validity
It is an essential step for developing a scale and a mechanism for linking abstract concepts with tangible and measurable indicators.[20] The expert panel consisted of 13 specialists in obstetric, reproductive health, midwifery, and nursing. Qualitative content validity was determined based on “grammar,” “wording,” “item allocation,” and “scaling” indices.[16] In order to perform quantitative content validity, content validity ratio (CVR) and content validity index (CVI) were calculated. For calculating CVR, the expert panel was asked to comment independently on the necessity of each item using a 3‑point Likert scale; 1 = essential, 2 = useful but not essential, and 3 = unessential. Following the expert’s assessments a CVR for the total scale was computed. According to the Lawshe table, an acceptable CVR value for 13 expert panels is 0.56 or above.[21] For the CVI, based on the recommendation od Waltz and Bausell,[22] the same expert panel was asked to evaluate the items according to a 4‑point Likert scale on “relevancy,” “clarity,” and “simplicity.” A CVI score of 0.80 or above was considered satisfactory.[23]
Face validity
Face validity is concerned with how appropriate, relevant, and understandable the items on a questionnaire are concerning the focus or aim of the questionnaire.[24]
In this part, both quantitative and qualitative methods were applied. For quantitative part, 10 women were asked to evaluate the questionnaire and score the importance of each item on a 5‑point Likert scale in order to calculate “item impact score” (impact score = frequency (%) × importance). An impact score of 1.5 or above was considered satisfactory as recommended.[16] For the qualitative part, the same patients were asked about the “relevancy,” “ambiguity,” and “difficulty” of the items; and some minor changes were made to the preliminary questionnaire.
The pre‑final version of the questionnaire included 101 items, following the reflection of the abovementioned approaches in two times; finally, 19 items were removed and the pre‑final version of the questionnaire consisting of 82 items was provided for the next stages (validity and reliability of the questionnaire).
Construct validity
The dimensionality of the questionnaire was determined using exploratory factor analyses (EFA). The women
completed the questionnaire and its factor structure was extracted using the principal component analysis with varimax rotation. In order to evaluate sampling adequacy to perform a satisfactory factor analysis, Kaiser–Meyer–Olkin measure of sampling adequacy (KMO) and Bartlett test of sphericity was calculated. To determine the best structure, an eigenvalue greater than 1.2 and a factor loading equal to or greater than 0.3 and scree plot were applied.[25,26]
Reliability
• Internal consistency: The internal consistency of ATBMS questionnaire was estimated by computing Cronbach’s alpha coefficient. Alpha values of 0.60 or above were considered satisfactory[21]
• Test–retest: A subsample of patients (n = 30) completed the questionnaire twice with a 2‑week interval in order to examine the stability of the scale by calculating Spearman–Brown test. Correlation coefficient is significant at the 0.01 level (two‑tailed). Spearman correlation coefficient showed a high reliability, r = 0.916, (P = 0.000).[21] All statistical analyses were performed using the Statistical Package for the Social Sciences version 18.0. (SPSS Inc.,Chicago,IL).[27] Scoring
To provide row scores, each item was scored from 5 to 1, except for items 1–12, 66–68, 59–61, and 18–54 where scoring should be reversed that is 1 to 5, and to calculate the row score for each subscale, raw score items are added which are then divided by number of items in that subscale. A linear transformation was used to calculate scores ranging from 68 to 204 where higher scores (158–204) indicate normal delivery selection (a positive attitude), lower scores (68–113.3) indicate cesarean section (a negative attitude), and middle level scores indicate no differences in choosing a birth method in aspect of women (no specific attitude). Trustworthiness
Credibility of the data was established through peer and member checking. Peer checking was conducted by 4 expert supervisors to verify coding and categorization process. In member checking, seven interview drafts were returned to the participants to verify that the researchers were presenting their real perceptions. Prolonged engagement with data and immersion in them along with writing field notes, helped in ensuring the quality of the data.[18,19] Ethical considerations
The ethics committee of the Tarbiat Modares University approved the study. Before entering the research field, official permissions were obtained. All the participants were informed about the purpose of the study and were assured that their confidentiality would be maintained; signed informed consent forms were obtained from all the participants. In addition, permission to record the interviews
was obtained; the participants had a right to withdraw from the study at any stage.
Results
In the qualitative section, the mean age of the participants was 26.83 (15–46) years. Four women were pregnant (2 women had chosen cesarean section and 2 vaginal delivery). In addition, 3 and 11 women had undergone vaginal delivery and elective cesarean section, respectively. Nine out of 18 women had a Bachelor of Science degree (nine in cesarean section and 0 in vaginal delivery groups). Nine women were employed and 9 were housewives (6 women in cesarean section and 3 in vaginal delivery groups); hence, the women who chose cesarean section were mostly employed and educated. Among 200 meaning units, 130 preliminary items were extracted, and after examining the repeated data, 101 items remained. Through face and content validity process, the item numbers reduced to 82 before construct validity. Eight subscales, namely, beliefs and attitudes, sexual and physical attitudes, fear of childbirth, preference of convenience, health and supporting, social‑cultural norms, confidence to the birth practitioner, personal and practical choice, and sources of motivations were extracted.
In the sexual and physical attitudes subscale affecting the women’s decision of choosing a birth method, the participants suggested that the matter of choosing a birth method was a complex and difficult decision influenced by sociocultural beliefs and attitudes. In this respect, the women’s husbands, family members, friends, and peers had fundamental roles. Women expressed that postpartum sexual function and sexual satisfaction of their husbands played a significant role in choosing their birth method. The followings narratives are participants’ direct quotations. One of postnatal woman expressed that
“Those who had vaginal delivery said that their husbands were not satisfied with their sexual relationships after vaginal delivery (W19).”
One pregnant woman mentioned that
For my some relatives that it was their second or third childbirth, I witnessed that they chose cesarean sectoion to prevent sexual dysfunction after vaginal delivery (W3).” Another postnatal woman expressed that
“My sister experienced vaginal delivery in her first pregnancy and CS section in her subsequent pregnancy. In her first delivery, she had several sutures and her vaginal opening was so stretched that her husband was not satisfied with their sexual relationship at all and he forced her to perform genital cosmetic repair (W9).”
Construct validity
In the quantitative section, the participants who selected their birth method comprised 420 women with vaginal
delivery (n = 228) and cesarean section (n = 192), who were referred to three semi‑public and public hospitals and two healthcare centers affiliated to the Ahvaz Jundishapur University. All women had no previous childbirth or a previous vaginal delivery. Among women who had a previous vaginal delivery, 31 (7.4%) had chosen cesarean section in their present pregnancy. The mean age of the participants was 26.80 (5.16) years, and the cesarean section group was older with a higher marriage age and lesser gravity number. In addition, the women who selected cesarean section were more educated and employed with better an economic status in an urban area. Table 1 shows particular characteristics of participants (P < 0001).
Exploratory factor analysis
The Kaiser–Meyer–Olkin was 0.829 and the Bartlett’s test of sphericity was significant (2278, P < 0.001) showing sampling adequacy. In early draft of questionnaire with 82 items, the initial analysis indicated a 15‑factor structure for the questionnaire with 14 items loading unexpectedly and irrelevant to the loaded construct or repeated in other questions; Thus, repeated and irrelevant items were removed and a final 68‑item questionnaire loaded on 8 distinct constructs that jointly accounted for 42.97% of variance observed [Table 2].
Consistency and stability reliability of the scale was measured by Cronbach’s alpha coefficient. This coefficient for the whole scale was 0.87 and for subscales ranged from 0.40 to 0.90.
Cronbach’s rate should be between 80–70%,[28] and for context‑based studies, higher than 60 is acceptable.[21] Spearman–Brown test also showed that the instrument have an excellent internal consistency (0.889). The present study was conducted among pregnant women and key informants’ perceptions about any factors affecting women to choose their birth method. This research is an innovation because this scale was developed on the basis of the context and passed the psychometric stages for the first time in the world.
Discussion
The purpose of this study was to develop a scale for measuring attitude toward birth method selection in an Iranian sample population. This paper presents the procedure of tool development, structure, validity, and reliability of the ATBMS instrument. For measures of content validity, we used both quantitative and qualitative methods to assess face and content validity to take advantage of this combination in evaluating construct validity.[13]
Assessment of the content validity of a scale by experts is one of the best ways for gathering evidence for supporting a tool.[29] There are similar studies utilizing the ideas of expert panel to confirming their instrument’s content validity.[30,31]
Construct validity using factor analysis indicated 8 factors, including “beliefs and attitudes,” “sexual and physical attitudes,” “fear of childbirth,” “preference of convenience, health and supporting,” “Socio‑cultural norms,” “confidence to the birth practitioner,” “personal and practical choice,” and “sources of motivation.” To our knowledge, this is the first time that a qualitative study is conducted to develop a birth method selection questionnaire thus, this scale and its subscales did not compare to the specific childbirth scale but some relevant scales regards to childbirth were compared.
The internal consistency of the ATBMS scale was calculated to be more than 0.87. This finding is confirmed by the Wijma‑Wijma study .The Cronbach’s alpha coefficient in Wijma‑Wijma study, for A version was 0.93, and for B version, were 0.95, and 0.96, 2 hours and 5 weeks postpartum, respectively. Wijma‑Wijma study is the first tool for measuring the fear associated with childbirth among 196 women in their 32nd week of pregnancy (version A), and 166 women during the first 2 hours and 5 weeks after childbirth (version B). In addition, our results showed that “fear of childbirth” as Table 1: Baseline women characteristics in the normal delivery and cesarean section groups (n=420)
Characteristic Chosen birth method P
ND (n=228) CS (n=192) Total (n=420)
Age (years), mean (SD)/n (%) 26.95 (3.65) 32 (7.60) 26.80 (5.16) 0.014
Marriage age, n (%)
˂15 15 (3.57) 8 (1.90) 23 (5.47) 0.031
16‑20 97 (23.09) 61 (14.52) 158 (37.61)
21‑25 89 (21.19) 71 (16.90) 160 (38.09)
26‑30 23 (5.47) 44 (10.47) 67 (15.95)
31‑35 4 (0.95) 8 (1.90) 12 (2.85)
Gestational age, Week,
mean (SD) 27.77 (2.34) 27.95 (2.12) 27.86 (2.23) 0.728
Gravidity, n (%)
Primigravida 114 (27.14) 105 (25.00) 219 (52.14) 0.049
2‑4 111 (26.5) 81 (19.28) 192 (45.71)
≥5 3 (0.71) 6 (1.42) 9 (2.14)
Parity, n (%)
Nulliparous 121 (28.80) 115 (27.38) 236 (56.19) 0.417
1‑3 105 (25.00) 73 (17.38) 178 (42.38)
≥4 2 (0.47) 4 (0.95) 6 (1.42)
Education, n (%)
Primaryschool 46 (10.95) 13 (3.09) 59 (14.04) <0.001
Secondary 36 (8.57) 14 (3.33) 50 (11.90)
High school 25 (5.95) 17 (4.04) 42 (10.00)
Diploma 63 (15.00) 74 (17.61) 137 (32.61)
University 58 (13.80) 74 (17.61) 132 (31.42)
Husband’s education, n (%)
Primaryschool 33 (7.85) 11 (2.61) 44 (10.47) <0.001
Secondary 45 (10.71) 13 (3.09) 58 (13.80)
High school 19 (4.52) 12 (2.85) 31 (7.38)
Diploma 48 (11.42) 60 (14.28) 108 (25.71)
University 83 (19.76) 96 (22.85) 179 (42.61)
Employment, n (%)
Employer 3 (0.71) 2 (0.47) 5 (0.12) <0.001
Employee 11 (2.61) 35 (8.33) 46 (10.95)
Unemployed (household) 214 (50.95) 155 (36.90) 369 (87.85)
Economy status, n (%)
Good 78 (18.57) 61 (14.52) 139 (33.09) 0.015
Moderate 125 (29.76) 125 (29.8) 250 (59.52)
Week 25 (5.95) 6 (1.42) 31 (7.38)
Place of residency, n (%)
Urban 191 (45.47) 185 (44.04) 376 (89.52) <0.001
Rural 37 (8.80) 7 (1.66) 44 (10.47)
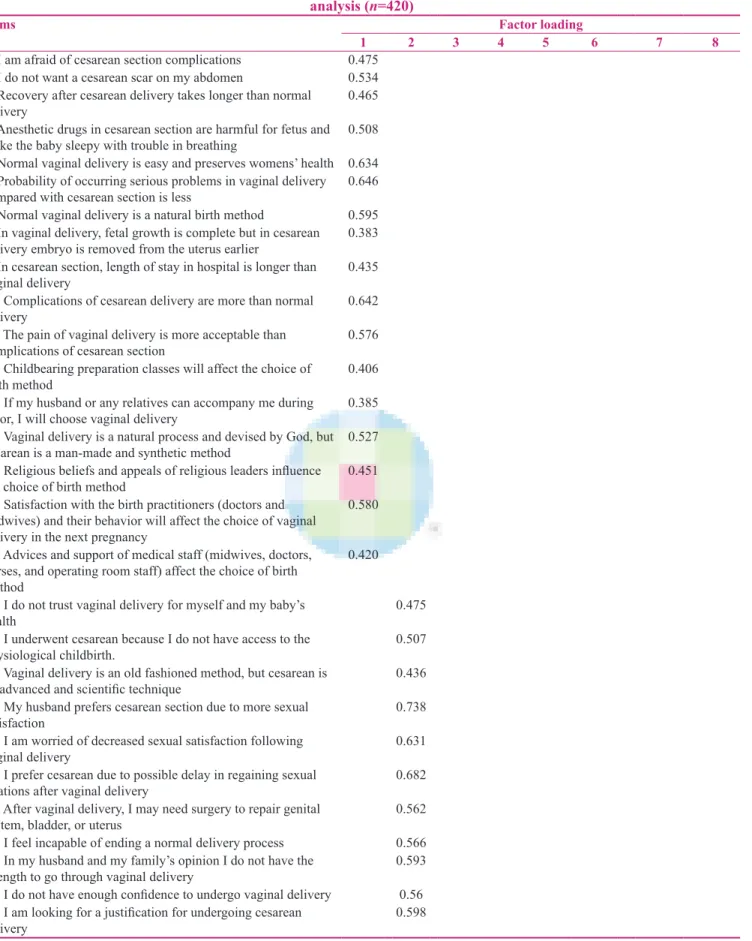
Table 2: Attitude toward birth method selection scale and its factor loading obtained from exploratory factor analysis (n=420)
Items Factor loading
1 2 3 4 5 6 7 8
1. I am afraid of cesarean section complications 0.475 2. I do not want a cesarean scar on my abdomen 0.534 3. Recovery after cesarean delivery takes longer than normal
delivery 0.465
4. Anesthetic drugs in cesarean section are harmful for fetus and make the baby sleepy with trouble in breathing 0.508 5. Normal vaginal delivery is easy and preserves womens’ health 0.634 6. Probability of occurring serious problems in vaginal delivery
compared with cesarean section is less 0.646
7. Normal vaginal delivery is a natural birth method 0.595 8. In vaginal delivery, fetal growth is complete but in cesarean
delivery embryo is removed from the uterus earlier 0.383 9. In cesarean section, length of stay in hospital is longer than
vaginal delivery 0.435
10. Complications of cesarean delivery are more than normal
delivery 0.642
11. The pain of vaginal delivery is more acceptable than
complications of cesarean section 0.576
12. Childbearing preparation classes will affect the choice of
birth method 0.406
13. If my husband or any relatives can accompany me during
labor, I will choose vaginal delivery 0.385
14. Vaginal delivery is a natural process and devised by God, but cesarean is a man‑made and synthetic method 0.527 15. Religious beliefs and appeals of religious leaders influence
the choice of birth method 0.451
16. Satisfaction with the birth practitioners (doctors and midwives) and their behavior will affect the choice of vaginal delivery in the next pregnancy
0.580 17. Advices and support of medical staff (midwives, doctors,
nurses, and operating room staff) affect the choice of birth method
0.420 18. I do not trust vaginal delivery for myself and my baby’s
health 0.475
19. I underwent cesarean because I do not have access to the
physiological childbirth. 0.507
20. Vaginal delivery is an old fashioned method, but cesarean is
an advanced and scientific technique 0.436
21. My husband prefers cesarean section due to more sexual
satisfaction 0.738
22. I am worried of decreased sexual satisfaction following
vaginal delivery 0.631
23. I prefer cesarean due to possible delay in regaining sexual
relations after vaginal delivery 0.682
24. After vaginal delivery, I may need surgery to repair genital
system, bladder, or uterus 0.562
25. I feel incapable of ending a normal delivery process 0.566 26. In my husband and my family’s opinion I do not have the
strength to go through vaginal delivery 0.593
27. I do not have enough confidence to undergo vaginal delivery 0.56 28. I am looking for a justification for undergoing cesarean
delivery 0.598
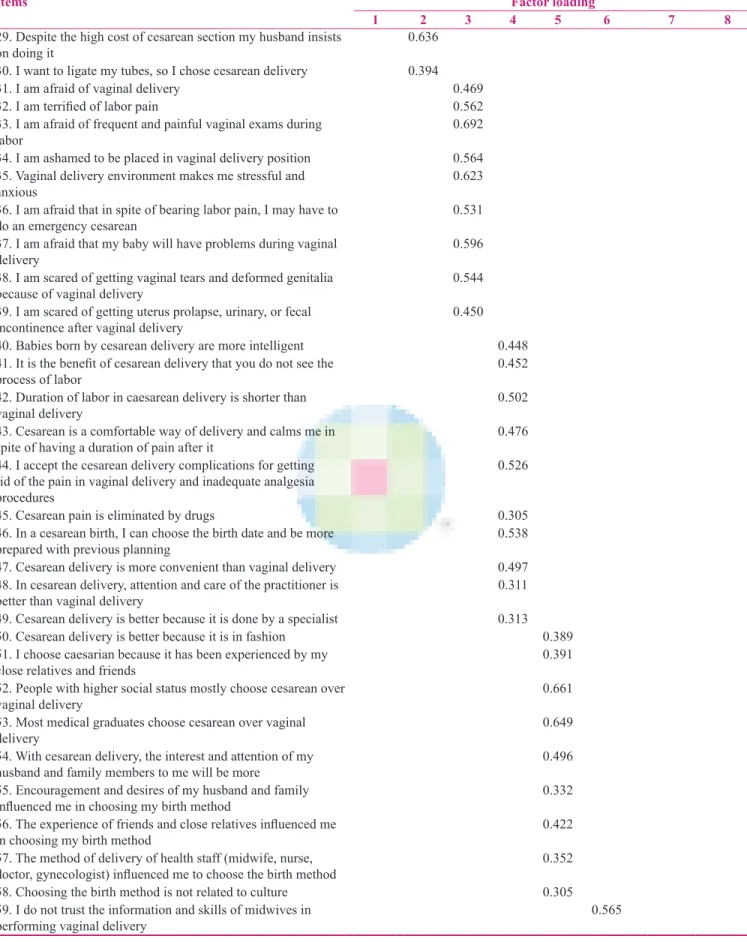
Table 2: Contd...
Items Factor loading
1 2 3 4 5 6 7 8
29. Despite the high cost of cesarean section my husband insists
on doing it 0.636
30. I want to ligate my tubes, so I chose cesarean delivery 0.394
31. I am afraid of vaginal delivery 0.469
32. I am terrified of labor pain 0.562
33. I am afraid of frequent and painful vaginal exams during
labor 0.692
34. I am ashamed to be placed in vaginal delivery position 0.564 35. Vaginal delivery environment makes me stressful and
anxious 0.623
36. I am afraid that in spite of bearing labor pain, I may have to
do an emergency cesarean 0.531
37. I am afraid that my baby will have problems during vaginal
delivery 0.596
38. I am scared of getting vaginal tears and deformed genitalia
because of vaginal delivery 0.544
39. I am scared of getting uterus prolapse, urinary, or fecal
incontinence after vaginal delivery 0.450
40. Babies born by cesarean delivery are more intelligent 0.448
41. It is the benefit of cesarean delivery that you do not see the
process of labor 0.452
42. Duration of labor in caesarean delivery is shorter than
vaginal delivery 0.502
43. Cesarean is a comfortable way of delivery and calms me in
spite of having a duration of pain after it 0.476
44. I accept the cesarean delivery complications for getting rid of the pain in vaginal delivery and inadequate analgesia procedures
0.526
45. Cesarean pain is eliminated by drugs 0.305
46. In a cesarean birth, I can choose the birth date and be more
prepared with previous planning 0.538
47. Cesarean delivery is more convenient than vaginal delivery 0.497 48. In cesarean delivery, attention and care of the practitioner is
better than vaginal delivery 0.311
49. Cesarean delivery is better because it is done by a specialist 0.313
50. Cesarean delivery is better because it is in fashion 0.389
51. I choose caesarian because it has been experienced by my
close relatives and friends 0.391
52. People with higher social status mostly choose cesarean over
vaginal delivery 0.661
53. Most medical graduates choose cesarean over vaginal
delivery 0.649
54. With cesarean delivery, the interest and attention of my
husband and family members to me will be more 0.496
55. Encouragement and desires of my husband and family
influenced me in choosing my birth method 0.332
56. The experience of friends and close relatives influenced me
in choosing my birth method 0.422
57. The method of delivery of health staff (midwife, nurse,
doctor, gynecologist) influenced me to choose the birth method 0.352
58. Choosing the birth method is not related to culture 0.305
59. I do not trust the information and skills of midwives in
performing vaginal delivery 0.565
a 10‑item domain in the ATBMS scale is an important factor in the willingness of women to do a cesarean section. This dimension corresponds with the Wijma Delivery Expectancy/Experience Questionnaire (W‑DEQ) scale specifically measuring the fear of childbirth with 33 questions about anxiety, control, and personal feelings in one domain, and all questions are asked both before and after the birth, which is a way to include the influence on the memory.[15] Childbirth is a stressful event and some women have traumatic stress symptoms, such as anxiety and fear of childbirth postpartum.[16]
In addition, the findings are in line with the childbirth experience study that was shown CEQ questionnaire have a Cronbach’s alpha coefficient ranged between 0.62–0.88 for 4 subscales containing own capacity (8 items regarding sense of control, personal feelings during childbirth, and labor pain, with Cronbach’s alpha coefficient of 0.82), professional support (5 items about information and midwifery care with Cronbach’s alpha coefficient 0.88), perceived safety (6 items about sense of security and memories from the childbirth with Cronbach’s alpha coefficient 0.78), and participation (3 items regarding own possibilities to influence the birthing situation with Cronbach’s alpha coefficient 0.62).[16]
Women expressed that “confidence in the birth practitioner” played a significant role in choosing their birth method. This domain is almost in line with the perceived safety domain in CEQ. Items regarding sense of security correlated with statements about memories formed the dimension labeled perceived safety. The own capacity
dimension included items relating to experienced emotions and sense of control, together with experienced labour pain. Professional support and participation are other dimensions of the four‑dimensional model of the childbirth experience as a tool to identify women with negative experiences and for evaluating efforts to improve the quality of childbirth care.[16]
The reliability of the instrument is one of the most important criteria that indicate the quality of the ATBMS instrument. The questionnaire had an acceptable internal consistency and stability. A reliable scale increases the power of a study detecting significant differences and relationships that actually occur in the study.[32] In a study by Dencker regarding development and evaluation of CEQ similar measurements were used for assessing the validity and reliability of the scales and the level of test–retest reliability weighted kappa of 0.68, and hence reported demonstrating a good test–retest reliability of the CEQ.[16] In addition, the examination of construct validity of W‑DEQ both before and after delivery, in nulliparous as well as in parous women, indicated a construct more clearly in parous than in nulliparous women. Internal consistency reliability and split‑half reliability of the W‑DEQ of ≤0.87 was reported to be good for a new research instrument.[15] In addition, the psychometric properties of an abbreviated version of the pregnancy experience scale (PES) designed to evaluate the maternal appraisal of positive and negative stressors during pregnancy showed that internal reliability is high for both the uplifts (α = 0.82) and the hassles (α = 0.83) subscales and the Spearman–Brown prophecy formula generated a minimum required alpha coefficient of Table 2: Contd...
Items Factor loading
1 2 3 4 5 6 7 8
60. The physician not attending at time of vaginal delivery
makes me anxious 0.630
61. I prefer the doctor who has performed my prenatal care
during pregnancy, do my delivery 0.609
62. After caesarian because of the pain, a caregiver is required
for mother and baby nursing care 0.446
63. I am sure with my decision and I insist on it 0.592
64. I am satisfied that I can choose my birth method 0.616
65. I do not have a good experience from my previous delivery 0.398
66. Physicians simply accept the request of cesarean by women 0.592
67. Physicians encourage women that cesarean is an easy and
comfortable birth method 0.587
68. Physicians do not explain about vaginal delivery and do not
encourage women to perform vaginal delivery 0.547
Eigen value 11.234 4.767 3.031 2.373 2.236 2.084 1.814 1.681
Explained variance (%) 16.521 7.01 4.458 3.489 3.288 3.065 2.667 2.472
Cumulative variance (%) 16.521 23.531 27.989 31.478 34.767 37.832 40.499 42.971
Factor 1: Beliefs and attitudes; Factor 2: Sexual and physical attitudes; Factor 3: Fear of childbirth; Factor 4: Preference of convenience, health and support; Factor 5: Socio‑cultural norms; Factor 6: Confidence in the birth practitioner; Factor 7: Personal and practical choice; Factor 8: Sources of motivation
0.71 for uplifts (full PES α = 0.91) and 0.82 for hassles for each subscale.[33] One of the characteristics of ATBMS questionnaire is its relation to the norms, values, and beliefs in Iranian society to the childbearing methods. One of these aspects is religious beliefs as one of the factors influencing the choice of birth method. Statements such as “appeal to the leadership religious (Imams),” “natural delivery as a method that has brought from God” shows that Iranian women choose their birth method based on their religious believes, especially about natural childbirth. This questionnaire has been designed and developed based on the concepts of birth method selection by pregnant women in Ahvaz city. For using this tool (ATBMS) in assessing the selected birth method for pregnant women in other ethnic and cultures groups, performing psychometric process is required.
As a limitation, this study focused mainly on the experiences of pregnant and early postnatal women. It is suggested to explore women’s satisfaction with their birth method in postnatal as well as their subsequent childbirth.
Conclusion
On the basis of the results, the ATBMS scale for determining the attitudes and factors influencing the choice of birth method in the Iranian culture were designed. ATBMS questionnaire has developed based on the exploration of the birth method experience of pregnant women and key informants through a qualitative study via in‑depth interviews. This scale is an easy tool for understanding and can be completed by women in 15–20 min duration, with an appropriate validity and reliability. Due to the lack of any reliable and validated tool to assess the birth method selection and factors influencing women’s decision making, considering the focus of WHO to reduce unnecessary cesarean sections as well as to detection factors that motivate women to choose cesarean section in absence of any medical indication. ATBMS questionnaire can be useful for effective recognition, planning, and intervention by governments. Usage of this scale is suggested in other studies.
Acknowledgement
We would like to thank the Ahvaz Jundishapur University of Medical Sciences, Ahvaz, Iran for their cooperation during the study.
Financial support and sponsorship Nil
Conflicts of interest
There are no conflicts of interest.
References
1. Souza J, Gulmezoglu A, Lumbiganon P, Laopaiboon M, Carroli G, Fawole B, et al. Caesarean section without medical indications is associated with an increased risk of adverse
short‑term maternal outcomes: The 2004‑2008 WHO Global Survey on Maternal and Perinatal Health. BMC Med 2010;8:71. 2. Health T. Caesarian section on maternal request. A health
technology assessment‑summary. Danish Centre for Evaluation and Health Technology Assessment, Contract No. 4. 2005. 3. Abbaspoor Z, Moghaddam‑Banaem L, Ahmadi F,
Kazemnejad A. Women’s fear of childbirth and its impact on the chosen birth method: A qualitative study. Payesh 2014;5:575‑87. 4. Declercq ER, Sakala C, Corry MP, Applebaum S. Listening
to Mothers II: Report of the Second National US Survey of Women’s Childbearing Experiences. J Perinat Educ 2007;16:15‑7.
5. Edwards J, Davies G. Elective caesarean section‑the patient’s choice? J Obstet Gynecol 2001;21:128‑9.
6. Thomas J, Paranjothy S. Royal College of Obstetricians and Gynaecologists Clinical Effectiveness Support Unit. National Sentinel Caesarean Section Audit Report. London: RCOG press; 2001.
7. Gibbons L, Belizán JM, Lauer JA, Betrán AP, Merialdi M, Althabe F. The global numbers and costs of additionally needed and unnecessary caesarean sections performed per year: Overuse as a barrier to universal coverage. World Health Rep 2010;30:1‑31.
8. Zar M. Diagnostic aspects of fear of childbirth: Linkopings universitet, Department of Behavioural Sciences; 2001.
9. Angeja A, Washington AE, Vargas J, Gomez R, Rojas I, Caughey A. Chilean women’s preferences regarding mode of delivery: Which do they prefer and why? BJOG 2006;113:1253‑8. 10. Habiba M, Kaminski M, Da Frè M, Marsal K, Bleker O,
Librero J, et al. Caesarean section on request: A comparison of obstetricians’ attitudes in eight European countries. BJOG 2006;113:647‑56.
11. Yazdizadeh B, Nedjat S, Mohammad K, Rashidian A, Changizi N, Majdzadeh R. Cesarean section rate in Iran, multidimensional approaches for behavioral change of providers: A qualitative study. BMC Health Serv Res 2011;11:159. 12. Iran Ministry of Health and Medical Education (IMHME),
Organization of Mother and Child Health, 2010. Available from: http://www.behdasht.gov.ir/.
13. Hyrkäs K, Appelqvist‑Schmidlechner K, Oksa L. Validating an instrument for clinical supervision using an expert panel. Int J Nurs Stud 2003;40:619‑25.
14. Doward LC, Meads DM, Thorsen H. Requirements for quality of life instruments in clinical research. Value Health 2004;7:S13‑6. 15. Wijma K, Wijma B, Zar M. Psychometric aspects of the W‑DEQ;
a new questionnaire for the measurement of fear of childbirth. J Psychosom Obstet Gynaecol 1998;19:84‑97.
16. Dencker A, Taft C, Bergqvist L, Lilja H, Berg M. Childbirth experience questionnaire (CEQ): Development and evaluation of a multidimensional instrument. BMC Pregnancy Childbirth 2010;10:81.
17. Graneheim UH, Lundman B. Qualitative content analysis in nursing research: Concepts, procedures and measures to achieve trustworthiness. Nurse Educ Today 2004;24:105‑12.
18. Holloway I, Wheeler S. Qualitative research in nursing and healthcare. Wiley‑Blackwell; 2009.
19. Lincoln YS, Guba EG. But is it rigorous? Trustworthiness and authenticity in naturalistic evaluation. New directions for evaluation 1986;1986:73‑84.
20. Wynd CA, Schmidt B, Schaefer MA. Two quantitative approaches for estimating content validity. West J Nurs Res 2003;25:508‑18.
Health and Biosciences: A Methodological Approach. 1st ed. Tehran: ACECR Press; 2011. [Persian]
22. Waltz CF, RB. B. Nursing research: Decision statistics and computer analysis. 2nd ed. Philadelphia: Fa Davis C;. 1983. 23. Polit DF, Beck CT. The content validity index: Are you sure you
know what’s being reported? Critique and recommendations. Res Nurs Health 2006;29:489‑97.
24. Jenkinson C, McGee HM. Health status measurement: A brief but critical introduction. Radcliffe Publishing. 1998.
25. Nunnally J. Psychometric theory. New York: McGraw‑Hill; 1978. 26. Sharma S. Applied multivariate techniques. USA: John Wiley &
Son;. 1996.
27. SPSS Inc: SPSS 18.0 for Windows. SPSS Inc C.
28. Bland JM, Altman DG. Statistics notes: Cronbach’s alpha. BMJ 1997;314:572.
29. Rubio DM, Berg‑Weger M, Tebb SS, Lee ES, Rauch S. Objectifying content validity: Conducting a content validity study in social work research. Social Work Res 2003;27:94‑104. 30. Stanton WR, Willis M, Balanda KP. Development of an
instrument for monitoring adolescent health issues. Health Educ Res 2000;15:181‑90.
31. Fok MS, Tsang WY. Development of an instrument measuring Chinese adolescent beliefs and attitudes towards substance abuse. J Clin Nurs 2005;14:86‑94.
32. Nancy B, Grovek FR. The practice of nursing research conduct, critique and utilization. Philadelphia: WB Saunders Company; 1993.
33. Dipietro JA, Christensen AL, Costigan KA. The pregnancy experience scale–brief version. J Psychosom Obstet Gynaecol 2008;29:262‑7.