Kyle J. Shaffer. Predicting Speech Acts in MOOC Forum Posts Using Conditional Random Fields. A Master’s Paper for the M.S. in I.S degree. April, 2015. 54 pages. Advisor: Jaime Arguello
Massive Open Online Courses (MOOCs) have emerged as a way to reach large numbers of students by providing course materials as free online resources. The popularity of these courses has been reflected in high enrollment numbers, however it is unclear how
successful MOOCs are at educating their students given their high attrition rates. One cause for this may be due to instructors’ inability to manage the large number of students that enroll. While discussion forums are available for students to seek help, instructors are unable to monitor the large number of posts written in these forums. This study investigates the effectiveness of using machine learning models to classify posts into speech acts as a way to help instructors monitor these discussion forums. Speech acts describe the purpose of a post and may be indicative of common functions such as asking questions or raising issues. A linear classifier is compared against a conditional random field (CRF) classifier, which is able to leverage contextual information about the forum in order to make predictions. The results of this study find that CRFs outperform a simpler linear classifier, and this suggests that casting this prediction problem as a sequence labeling task is fruitful for predicting these speech acts, and automatically identifying posts of interest.
Headings:
Data Mining
Web-based Instruction
Machine Learning
Text Mining (Information Retrieval)
PREDICTING SPEECH ACTS IN MOOC FORUM POSTS USING CONDITIONAL RANDOM FIELDS
by Kyle J. Shaffer
A Master’s paper submitted to the faculty of the School of Information and Library Science of the University of North Carolina at Chapel Hill
in partial fulfillment of the requirements for the degree of Master of Science in
Information Science.
Chapel Hill, North Carolina
April 2015
Approved by
Table of Contents
1. Introduction ... 2
1.1 Study Motivation ... 2
1.1 Study Goals ... 4
2. Literature Review ... 5
2.1 Machine Learning Approaches to Speech Act Detection ... 6
2.2 Computational Approaches to MOOC Analysis ... 11
3. Method ... 14
3.1 Description of Dataset ... 15
3.2 Speech Act Definitions ... 17
3.3 Data Collection ... 20
3.3.1 Crowdsourced Annotation ... 21
3.3.2 Data Collection Process ... 22
3.3.3 Evaluating Annotation Quality ... 24
3.4 Models ... 26
3.4.1 Linear Classification: Logistic Regression ... 26
3.4.2 Structured Classification: Conditional Random Fields ... 27
4. Machine Learning Experiments: Predicting Speech Acts ... 28
4.1 Description of Features ... 29
4.2 Evaluation Methodology ... 32
4.3 Experimental Setup ... 34
5. Results ... 36
6. Discussion ... 37
6.1 Model Comparison ... 37
6.2 Error Analysis ... 40
7. Conclusion and Future Work ... 45
Bibliography ... 48
Appendix I ... 51
1. Introduction
1.1 Study Motivation
The increasing intersection of technology and education has changed how both
instructors and students view the delivery of courses. Today massive open online courses,
or MOOCs, are the primary example of offering free and open course materials to a wide
range of people. MOOCs allow for large-scale open enrollment and are typically free of
cost, allowing for students from a variety of backgrounds to sign up. Students progress
through these courses by watching video lectures and completing tasks such as short
quizzes or homework assignments in order to be evaluated. In addition to these course
materials that are presented asynchronously, students are able to communicate with one
another and with course staff through online discussion forums. Students are free to write
whatever they like in these forums, and often use them as a venue to solicit help with
course material or to report issues with course management.
The ability to develop course content and offer remote access to these materials has
challenged the role of the in-person course offerings in “brick and mortar” institutions,
and has allowed for an unparalleled number of students to learn from some of the most
highly regarded instructors in the world at little to no cost. This course delivery method
has massive potential for increasing equality in education, and is particularly salient
given the steeply rising cost of education within the United States.
However, this movement within online education is not without its challenges.
course offerings and even the founder of Udacity, one of the largest current MOOC
platforms, has publicly called the first iteration of their remote course offerings a “lousy
product,” when discussing the number of students who do not complete these online
courses.1 The main message from these criticisms seems to be that the sheer volume of
students who sign up and have access to these materials provides no indication for how
successful students will be in completing the courses. These high attrition rates in
MOOCs appear to be a symptom their inability to engage students, and some have
suggested that MOOCs be scaled back given the large number of students who do not
complete these courses.
Despite widespread disagreement about the effectiveness of MOOCs, there is little
disagreement that many students are initially enrolling in these courses. The enrollment
for many courses can quickly rise to thousands of students, however these initial
enrollment numbers are not necessarily indicative of student success since few students
complete these courses. With such large course enrollments, and the threat of many of
these students dropping out, there is a unique opportunity to provide MOOC instructors
with a tool to alert them to student posts within discussion forums for greater
effectiveness in intervention. That is, threads within these forums that contain many
students posting about frustration or confusion with course materials could be flagged
and brought to the attention of the instructor through an automated application that would
classify posts and threads according to their need for intervention.
1Slate Magazine,
1.1 Study Goals
The present study aims to provide an experimental basis for developing such a tool by
building machine learning models and evaluating their performance in classifying
discussion forum posts into speech act categories. Speech acts are types of sentences or
utterances that perform a particular function within a broader discourse or conversation.
If these models are able to classify posts into these speech acts with an acceptable degree
of precision and recall, then this provides the basis for further developing software
accessible by the instructor that would alert her/him to posts within these forums that
warrant instructor intervention. This would be far preferable to ignoring struggling
students due to an inability to manually identify these posts.
In addition to an assessment of the precision and recall metrics, this study will also
test two different types of machine learning models on this classification task. One of the
assumptions made by many supervised machine learning models is that there is no
relationship between instances to be classified within the dataset. That is, for all practical
purposes, instances within the dataset are treated as independent of one another and the
features and prediction confidence interval values of one instance have no bearing on the
predictions of other instances. However, intuitively it is clear that discussion forums do
exhibit a structure in which forum users interact with one another and write different
types of responses given the previously written posts. This structure violates this
independence assumption, and contextual information derived from this structure may be
helpful in improving model performance for this task. In an attempt to make use of this
structure of the dataset, a type of structured learning model called a conditional random
performance over using a linear classifier, which makes simpler assumptions about the
underlying structure of the data.
The remainder of the paper will proceed as follows. Related work on MOOC and
online discussion forum analyses will be presented next in a literature review (Section 2).
Following this, Section 3 will present the methodology of this study including a
description of the dataset, a presentation of data collection methods for obtaining labels
for use in supervised machine learning experiments, and an overview of the models used
in this study. Section 4 will give an experimental overview before presenting results in
Section 5. Section 6 will provide a critical discussion of the results obtained before
concluding and presenting future work in this area in Section 7.
2
. Literature Review
Researchers in various disciplines have utilized quantitative and automated methods
to more rigorously study complex social phenomena at a large scale. Many of these
analyses have used data mining techniques to collect data from large and complex social
networks such as Twitter and Facebook, and MOOCs are an emerging area in which
these computational techniques are being used to ask and provide further insight to
important questions.
What follows is a survey of the literature that informs the current study. This past
work is divided into two sections by theme of the work. The first section (2.1) will cover
the broad task of using text mining and machine learning techniques to attempt to classify
and detect speech acts in various domains of analysis. The second section (2.2) will focus
attention on computational analyses of student engagement and attrition in MOOCs,
bearing on the proposed study, which seeks to combine aspects of each of these areas into
a unique analysis of student behavior within the discussion forums of one particular
MOOC.
2.1 Machine Learning Approaches to Speech Act Detection
Many attempts have been made to design classification systems that are able to detect
speech acts in various domains of interest. These studies employ speech act theory in
order to conceptualize the role of the different messages or other units of analysis being
sent in a longer sequence of messages. The goal of these studies is to engineer features
and develop models that are effective in classifying messages into one or more speech act
categories. Often these speech act categories are highly specific to the domain of
analysis, and researchers often provide specific definitions and examples of how they are
identified within their dataset.
An early example of such speech act classification appears in Cohen, Carvalho and
Mitchell (2004) in which the authors develop classifiers for email messages. This is a
unique study in that it is one of the first to investigate speech act classification, and offers
results for a fairly rare domain of analysis—email messages. This last point is especially
noteworthy given the sparseness of open datasets containing email message data for
obvious privacy reasons. The authors define four speech acts that are specific to their
dataset of emails from an online graduate course in business offered at Carnegie Mellon
University in 2004: (1) requests for information, (2) delivery of information, (3)
proposals, and (4) commitments. These speech acts were assigned to each email by two
expert annotators and these annotations are used as labels to test four algorithms
constructing features solely from the text of the emails the authors find, somewhat
surprisingly, that combinations of simpler classifiers such as decision trees perform better
in terms of accuracy than more complex linear classifiers such as support vector
machines.
Following and extending this work, Carvalho and Cohen (2005) likewise focus on
classifying these same four speech acts by taking into account features that leverage the
context of the email message. That is, it is hypothesized that an email’s position within a
thread of messages may have a bearing on what type of speech act the message contains
since intuitively many types of messages often follow one another, such as requests being
followed by deliveries. This is a very similar hypothesis to the one being tested in the
current study by utilizing conditional random fields. The authors then conduct three
experiments: one in which only linguistic features are used for the model, one in which
only contextual features are used, and a final experiment combining both linguistic and
contextual features. The authors find that the combined features perform best of any of
the models tested, but also note that linguistic features on their own are more predictive
than contextual features on their own.
Qadir and Riloff (2011) similarly focus on identifying speech acts within a veterinary
medicine message board dataset, but opt to focus on classifying individual sentences
within the dataset as opposed to entire messages. This has some advantages in that
messages may often contain several speech acts, and increasing the level of granularity to
sentences has the benefit of providing a one-to-one correspondence between the unit of
analysis within the study and the speech act labels used for the predictive task. Unlike the
John Searle’s (1976) taxonomy including commissives (utterances that commit the
speaker to some future action), directives (utterances that command another agent to take
an action), expressives (utterances that express a speaker’s psychological state or mood),
and representatives (utterances that commit the speaker to a belief about the truth of a
proposition). This is noteworthy since these are much more general speech acts and may
be much more difficult for models to accurately predict than those that are more specific
to a particular domain of analysis. The authors focus on lexical and syntactic features for
model building in addition to a dictionary of words that the authors constructed in order
to capture semantic characteristics peculiar to the message board dataset they sought to
analyze. Given these features, the authors train and test support vector machines on 150
message board posts that consisted of 1,956 individual sentences to be classified and
achieve precision scores between 80% and 85% when identifying directives and
expressives, but much lower precision scores when attempting to identify commissives
and representatives. Perhaps most interestingly, researchers find that when added to other
linguistic features, semantic keywords features that are most specific to the veterinary
medicine domain significantly boosts precision when added to other linguistic features.
However, models that use these semantic features alone perform the worst across all
speech acts looking to be detected.
Bhatia et al (2012) also look at message board classification in the domain of a
question-answer discussion forum. The authors opt to delimit their own set of speech
acts, looking at categories more pertinent to posts that have to do with the question and
answer structure of the forum, and thus the speech acts considered for this study have
significant roles within this type of dialog. Seven total classes are considered. This study
is useful in terms of the features the authors considered for their models. In most of the
studies surveyed above, authors focus on linguistic features with special attention to
keywords that may be semantically important to the particular domain of classification.
The authors of this study use linguistic n-gram features in addition to unique structural
features of each post such as absolute position in the thread, cosine similarity between the
current post and previous post, as well as the number of times each user has posted in the
forum. Additionally, the authors consider sentiment by using keywords of
well-established positive and negative sentiment and incorporate these as features. This seems
especially useful in these studies since a post that contains higher levels of negative
sentiment may be more likely to also be classified as a question or negative
acknowledgement of a previous post, and these could therefore be useful clues for the
model. However contrary to this intuition, the authors find in their experiments that
prediction of these speech acts is not significantly aided by sentiment features, while
linguistic features and additional features about users are most helpful for performance.
All of the studies surveyed above follow a method of straightforward supervised
learning experiments in which a linear classifier is trained only on labeled data and
evaluated on a previously unseen test set of data as to how well it discriminates between
several classes or labels. Two important studies are surveyed here that attempt to extend
this approach. The first attempts to do so by incorporating unlabeled data into the process
of training classifiers, while the second looks to evaluate graphical models that attempt to
predict the broader structure of a set of posts as opposed to simpler linear classifiers that
These are important extensions to consider since often the classification task entails
differentiating between many different classes as opposed to a simple binary
classification problem that needs to distinguish between only two, and they highlight the
importance of contextual and structural features for increasing classifier performance
when looking at sequential data. That is, the very nature of these messages occurring as
part of a chain of a greater conversation seems to suggest that there are patterns of where
they occur within the thread that could be leveraged by contextual features or different
models that are better able to incorporate such features.
Jeong, Lin, and Lee (2009) look at extending speech act recognition within email and
forum messages by leveraging unlabeled data during the model training step—a process
known as semi-supervised learning. The goal of semi-supervised learning is to increase
the size of the training dataset used by the learning algorithm to improve prediction
performance, and this can be much more efficient and feasible than obtaining more
labeled data which is often an expensive or labor-intensive process. The algorithm in
semi-supervised experiments attempts to learn the distribution of the labeled data within
the training set and classify the remaining unlabeled training data according to this
distribution. The algorithm then uses all of this labeled data for a final training step
before being evaluated on a test set.
The authors use two smaller labeled dialog datasets consisting of roughly 1,200
labeled instances and one large unlabeled email dataset consisting of roughly 30,000
instances for their training set and attempt to classify held-out instances of the dialog
datasets. The authors then run their experiments with primarily linguistic features for
accuracy than baseline classifiers that use only a supervised approach. The authors
conclude that utilizing additional unlabeled data can boost performance in classifying
speech acts, and make the more ambitious claim that this may work with unlabeled data
from disparate domains.
Finally Ji and Bilmes (2005) seek to use graphical models as opposed to linear
classifiers in order to classify what they call dialog acts, which are similar to speech acts
surveyed in other works here. In addition to focusing on linguistic based features such as
unigrams and n-grams, the authors also try to incorporate contextual features to classify
sentences within message board posts. The model developed by the authors attempts to
step through sentences word by word in a sequence in order to use the probabilities of
each individual word to identify the dialog act of the entire sentence. However, in
addition to the overall distribution of each word in the training set, the model also learns
the conditional probability of the word occurring given the word that occurred before it.
This additional contextual feature is the main extension of their approach compared with
the works surveyed above. The authors note an extremely large increase in accuracy
between their baseline model which only uses n-gram features to predict the dialog act of
a sentence (34%) and the extended model which attempts to model dependencies between
words when predicting dialog acts for sentences (63%). This suggests that context is a
helpful feature when looking at speech or dialog acts, and this provides further
motivation for utilizing conditional random fields in this study.
2.2 Computational Approaches to MOOC Analysis
Perhaps the most straightforward and visible issue in research about MOOCs has
and quantitative perspectives, however the survey that follows will focus mainly on
quantitative and computational methods used to analyze these complex social phenomena
at a large scale.
Penstein Rosé et al. (2014) focus on analyzing student attrition rates within MOOCs
offered through Coursera and the University of Pittsburgh using survival modeling
techniques that predict student engagement via their posts within course forums. In
addition to this analysis, the authors provide a more interpretive analysis by attempting to
cluster students using the discussion forums into emerging groups by using unsupervised
clustering algorithms. A dataset of 4,700 forum posts was analyzed with two main groups
of features used for predicting whether students would persist through the course or
leave—one being a “cohort” feature constructed by identifying which week of the course
a student joined, and the other being a sub-community feature identified by the clustering
algorithm. Through these methods, the authors find that the most prevalent predictors for
attrition were students’ membership in the first-week cohort, and students’ membership
in one sub-group identified by the clustering algorithm. These results suggest that
beginning a new course with many other students at the same time and finding a group of
students to engage with are helpful in encouraging a student to progress through a
MOOC, and these may be factors that are especially important in the online setting.
Chen et al. (2013) likewise attempt to predict student attrition in an online course in
human-computer interaction offered through Stanford University. In particular, the
authors focus on predicting whether a student will complete a given assignment at each
step in a time series of assignments that spans the longevity of the course under analysis.
complete an assignment three days before it was due with a high degree of accuracy, the
amount of data that was available to them decreased drastically throughout the span of
the course as the result of students leaving and no longer posting to the discussion
forums.
A similar study on predicting MOOC attrition is carried out by Sharkey (2014). In
particular, the study looks at using post content to predict attrition in one MOOC, and
attempts to apply this model learned from the first MOOC to a second MOOC in order to
test generalizability. The authors note that while their model performs with a level of
accuracy between 80 and 85%, the majority of this metric is the result of predicting that
students will leave the course, which tends to be the majority class. Thus, their model is
biased in favor of picking whatever the majority class happens to be, which in the case of
the present study is not the class of interest.
Several other studies focus on identifying more abstract aspects of MOOC forum
posts such as sentiment or subjective point of view. Wen et al. (2014), for instance,
attempt to develop classifiers for identifying posts with highly negative sentiment as a
way to provide the basis for a tool that would flag these posts for instructor intervention.
The researchers analyze MOOC forum datasets from three different courses offered on
the Coursera platform in the domains of teaching, science fiction literature, and computer
programming totaling roughly 35,000 posts. In addition to classifying these posts
according to sentiment, the authors also identify four general topics throughout the forum
by using a clustering technique and look to classify sentiment within each of these four
topics. While sentiment may seem like an intuitive marker for how well a student is doing
predicting whether students will leave a MOOC, and even find that both positive and
negative sentiment moderately predict student dropouts, though neither of these results is
statistically significant.
Finally, Elouazizi (2014) seeks to predict point of view and cognitive presence using
the text of the forum posts within MOOCs. It is argued within the study that these
subjective aspects of the posts are likely indicative of how engaged a student is in their
learning, and this would be useful information for instructors to have when teaching at
such a large scale. Another key difference between this study and those above within this
section is that the author emphasizes testing the prediction of these aspects of cognitive
presence in two different courses: one MOOC with an extremely large enrollment, and
another online course with lower enrollment totals. The author defines four classes of
cognitive engagement to predict, two of which indicate engagement with course material,
while the other two indicate disengagement with course material. While only linguistic
features are used for training and testing models, the author focuses on key cognitive
verbs that are hypothesized to be stronger indicators of a student’s cognitive presence.
Through experiments, the author finds lower levels of cognitive engagement in the
high-enrollment MOOC data as measured by these linguistic features, and the author suggests
that this may point to an adverse effect of such high enrollment numbers within many of
the major MOOCs.
3. Method
In the following section, the methodology of the study is presented. First a description
of the dataset is presented in Section 3.1. In Section 3.2 the definitions for the speech acts
obtaining labels for supervised machine learning experiments, and Section 3.4 provides
an overview of the models to be tested in this study. The interested reader is referred to
Appendix I for a more general overview of the supervised machine learning methods
used in this study.
3.1 Description of Dataset
The dataset under analysis is comprised of all published communication within the
discussion forums from a MOOC on Metadata offered through the School of Information
and Library Science at the University of North Carolina, Chapel Hill on the Coursera2
platform. The full dataset contains both published and deleted posts, and this study is
concerned only with posts that were not deleted by an author. The course was taught over
eight weeks from August to November of 2013, and had an initial enrollment of just over
27,000 students in its first week, with an ending enrollment of just under 26,000 in its
final week, though not all of these students remained active throughout the duration of
the MOOC. Enrolled students need not participate in the MOOC at all to retain
enrollment. These two figures depict the difference between students who initially
enrolled and those who actively un-enrolled.3
Initial enrollments for the course are quite high, however only 1,4184 of the registered
students completed enough course material to earn a statement of accomplishment. While
this appears to be an extremely low completion rate, there are important caveats to
consider about differences between the MOOC education environment and that of more
2 https://www.coursera.org
traditional educational settings including marked differences in student motivation and
reasons for enrollment Koller et al (2013).
Throughout the duration of the MOOC, students were evaluated on eight weekly
homework assignments that included short-answer and coding segments, and these along
with a final exam made up the evaluation component of the course. Each of these
homework assignments followed one of eight learning modules offered throughout the
course, ranging from a broad theoretical introduction to metadata and organization
schemas to specific domain applications including metadata for the web. The content of
each learning module was presented through a set of video lectures recorded by the
course instructor along with selected readings that were assigned each week. The
instructor and one teaching assistant were responsible for managing the course and
responding to students through the discussion forums.
Before presenting summary statistics on the discussion forums, it is helpful to provide
some terminology in order to clarify the unit of analysis for the present study. Students
communicated with one another and with instructors of the MOOC through written
messages or posts, and these make up the most granular unit of analysis, and the main
focus of the predictive task.5 This statement/response structure of these messages makes
speech act prediction an appropriate and informative task in this domain. A thread is a
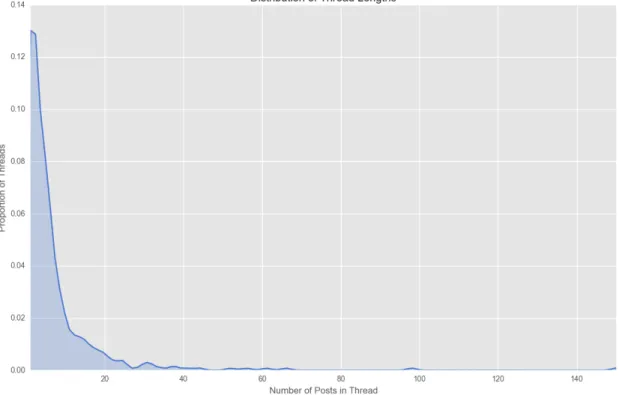
collection of posts and comments that typically make up a distinct topic. Threads vary
widely in length throughout the dataset ranging from just over 200 posts to one post in
length. Finally, a forum is the coarsest unit of analysis, and is comprised of a collection of
5 Individual messages within the forums consisted of posts, which are top-level messages,
threads. The discussion forums are comprised of these threads, which themselves are
comprised of individual posts. The dataset consists of 2,943 individual messages (2,166
posts and 777 comments), 425 threads, and 15 forums.
Figure 1: Distribution of thread lengths.
3.2 Speech Act Definitions
In this section, definitions are presented for the speech acts to be predicted. The
theory of speech acts arose out of work in philosophy of language and linguistics, and
seeks to characterize sentences or utterances in terms of the function they serve within a
broader discourse. An early authoritative taxonomy was provided by philosopher John
Searle who defined several canonical examples of speech acts including directives which
compel the listener of an utterance to perform some action, and expressives which serve
to communicate the psychological or emotional state of the speaker (Searle, 1976). While
computational approaches to speech act detection often employ speech act definitions
specific to a domain of analysis as in Cohen, Carvalho, and Mitchell (2004) above. The
present study follows this approach of defining speech acts specific to the domain of
analysis.
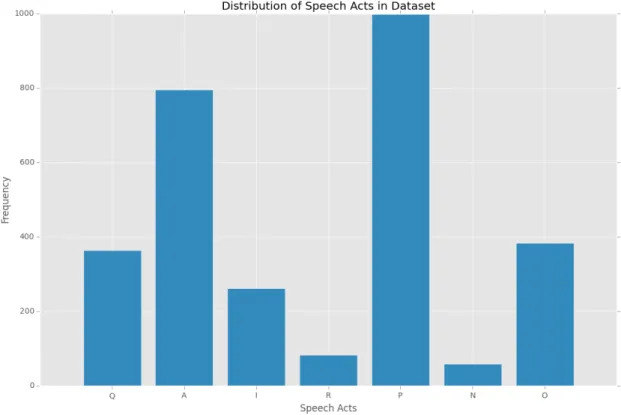
Seven speech acts were defined for annotation by crowdsourced workers. These
speech acts describe several common purposes for writing posts within a MOOC and
include questions, answers, issues, issue resolutions, positive acknowledgement,
negative acknowledgement, and an other category. These definitions are presented
below.
Questions are defined as a request for information or clarification about course
content, and may appear in interrogative form or as a statement within the post. Common
questions revolve around confusion with homework or quiz materials. Answers are
defined as posts that contain an attempt to provide useful information in direct response
to a question post. Answer posts may not successfully fulfill a previously asked question,
but must attempt to directly address a previously asked question.
Issues can be viewed somewhat as an analogue to questions, except that issues must
be raised in regards to course logistics as opposed to concepts or course content.
Common issues are directed at submitting homework assignments or other discrepancies
about how material is delivered. A final important distinction between questions and
issues is that questions are typically a part of any learning process and would likely not
be viewed negatively by an instructor, while issues are typically viewed in a negative
light by instructors and may require their direct intervention. Likewise, issue resolutions
previously raised issue, and (b) function primarily to resolve an issue raised about the
course. An important clue that may help identify issue resolutions is that instructors may
be more likely to write them within a thread, however an issue resolution need not
definitively resolve an issue.
Positive acknowledgment and negative acknowledgement are speech act categories
designed to capture sentiment-based posts throughout the forum, and express positive and
negative sentiment respectively toward a previously written post. One difficult aspect of
finding these speech acts is the requirement that they be written in direct response to a
previous post, and this can contribute to confusion between the negative
acknowledgement and issue categories.
Finally, the other speech act serves as a category to capture all other speech acts that
may be present within the threads. Given that MOOC students are free to write about
whatever they choose, much of the writing is quite “noisy” and difficult to place squarely
in one speech act category. The other category serves as a label for these posts, which
Figure 2: Distribution of labeled speech acts throughout dataset.
3.3 Data Collection
In the following sections, an overview of the data collection methodology is
presented. First, Section 3.1.1 presents an overview of crowdsourced data collection
methods used for obtaining labels for the machine learning experiments. Section 3.3.2
describes the implementation of an interface for this data collection and the instructions
given to non-experts using the Amazon Mechanical Turk web service. Finally, it is
important that good labels are used for the machine learning models to learn from.
Section 3.3.3 presents results of evaluating the quality of the labels by measuring
inter-annotator agreement between the non-expert MTurk workers, and between the MTurk
3.3.1 Crowdsourced Annotation
In supervised machine learning, the goal is to train a model to identify a set of
concepts based on representative features that are “learned” from a set of training data.
More technically, supervised learning can be thought of as function approximation. That
is, the assumption is that some function f describes the relationship between a set of
features x and a label y, and the goal of supervised learning is to train a model to infer
this function from a set of training data in order to predict further labels for previously
unseen data. This makes aspects such as feature engineering extremely important, but
also necessitates a set of good labels that supervised machine learning algorithms will use
as their ground truth or “gold standard” to learn from. Often high-quality labels for the
concepts to be predicted are not present or ready-made within the dataset, and this
necessitates a first step of collecting labels.
In the past, studies have relied on experts to annotate datasets with gold-standard
labels, but as the size of these datasets has grown, this process has become prohibitively
expensive and time consuming. In recent years crowdsourced options have become
widely used among researchers as a way to obtain labeled datasets inexpensively and in a
fraction of the time it would take for expert annotation. While there are concerns about
the quality of the labels obtained through this method, prior work has shown that
aggregating redundant labels for each instance within a dataset can lead to improved
quality as opposed to only collecting a single label per instance within the dataset (Sheng
et al, 2008). Following this insight, labels for this study were collected using the
crowdsourcing framework Amazon Mechanical Turk (hereafter MTurk).6 MTurk allows
anyone with an Internet connection to select Human Intelligence Tasks (HITs) posted by
researchers, and complete simple tasks within HITs for a small compensation.
3.3.2 Data Collection Process
MTurk workers were first shown a set of speech act definitions as presented above in
Section 3.2, and also provided additional tips and examples to help them differentiate
between speech acts that may be easily confused. Some of the posts within the dataset
were easily identifiable as belonging to a particular speech act, and MTurk workers were
provided with typical examples of these categories (see Table 1 below). While clear
definitions were given for these speech acts, these were not exhaustive, and therefore a
final category was designated (other) to serve as a placeholder for all posts that did not
fit into any of the previous categories. This makes the other category extremely noisy,
containing anything from introductions (“Hi everyone. I'm a web designer and extremely
interested in this course!”) to sharing tangential material (“sorry, this is not exactly
relevant, but I could not stop myself from sharing...”), and this likely contributed to some
confusion in the annotation process detailed below. Often these speech acts were
informal or conversational in nature, including introductions, organizing in-person study
groups based on geographic location, and expressions of excitement about the course. An
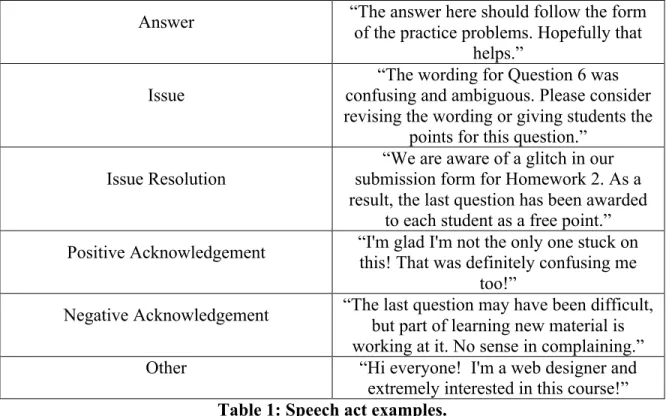
example of each speech act is presented in Table 1 below.
Speech Act Example
Question
“In Question 8 on the assignment I'm confused about the code formatting. In lectures, the instructor said syntax should
be of the form X, but do you have to include Y? Any ideas what I'm doing
Answer “The answer here should follow the form of the practice problems. Hopefully that helps.”
Issue
“The wording for Question 6 was confusing and ambiguous. Please consider revising the wording or giving students the
points for this question.”
Issue Resolution submission form for Homework 2. As a “We are aware of a glitch in our result, the last question has been awarded
to each student as a free point.” Positive Acknowledgement “I'm glad I'm not the only one stuck on this! That was definitely confusing me
too!”
Negative Acknowledgement “The last question may have been difficult,
but part of learning new material is working at it. No sense in complaining.”
Other “Hi everyone! I'm a web designer and
extremely interested in this course!” Table 1: Speech act examples.
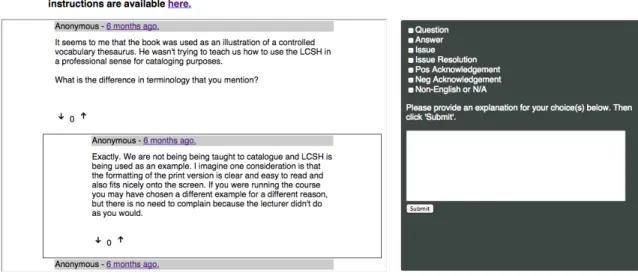
To collect these annotations, an interface was designed presenting MTurk workers
with an outlined post to be labeled within a thread. MTurk workers were able to scroll
throughout the thread and explore its context before labeling the outlined post with one or
more speech acts ranging from none (by labeling the post as other) to all seven speech
acts. Figure 1 shows an example of this data collection interface. To help ensure worker
quality and English-language proficiency, annotations were accepted only from MTurk
workers within the U.S. that had an acceptance rate of 95% or greater. In addition,
MTurk workers were asked to provide justification for their answer as prior work has
shown that users are more likely to submit high-quality work when asked to defend their
answers. As a final set of precautions, any given user was only allowed to complete 30
of the HIT. These trap questions were thought to be trivially simple in the eyes of the
author, and users who failed to answer three of these five correctly were removed.
Figure 3: Annotation collection interface.
3.3.3 Evaluating Annotation Quality
Using the above framework, five redundant annotations were collected for each post
within the dataset. Inter-annotator agreement was measured with respect to each speech
act using Fleiss' Kappa Agreement between the annotators. The author also served as an
“expert” annotator, and labeled 30% of the dataset and measured Cohen's Kappa
Agreement between the expert annotations and the majority vote annotation from the
MTurk workers, where the majority vote was taken to be the speech act that at least three
annotators agreed upon for a given post. Cohen's Kappa Agreement scores between the
MTurk workers and the expert annotator fell between 0.635 and 0.893, and these scores
were found to be satisfactory given the difficulty of the annotation task, however it is
Despite providing examples of each speech act and tips for how to differentiate
between boundary cases, some speech acts were nonetheless still ambiguous to MTurk
workers. Given the informal writing in the majority of the threads, it is perhaps
unsurprising that many of the posts were difficult to place cleanly into a speech act
category with high agreement among MTurk workers. Speech act pairs that appeared
naturally confusable were identified, and one speech act in particular, positive
acknowledgement, appeared to frequently co-occur in annotations with several other
speech acts, most notably answer and other.
A qualitative look at some of these annotations made it clear why these categories
may have been extremely difficult to distinguish between. For example, here is a post that
received equal annotations for both positive acknowledgement and other: “Hi I'm
[name] from [location]. I'm currently working part-time as a cataloger, and part-time as a
Digital Librarian. I've been a cataloger since 1990, but a digital librarian for only 2
months, so I”m [sic] here to learn all the things I’ve forgotten about metadata. Nice to
meet you all.” While the overall tone of this post is positive and friendly, it does not
specifically convey positive sentiment or encouragement directly to a previous post.
Rather it serves as a general introduction and should have been labeled as other.
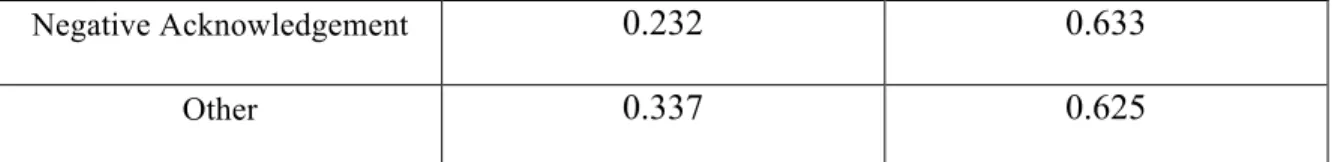
Speech Act Fleiss’ Kappa Cohen’s Kappa
Question 0.569 0.893
Answer 0.414 0.790
Issue 0.421 0.669
Issue Resolution 0.286 0.635
Negative Acknowledgement 0.232 0.633
Other 0.337 0.625
Table 2: Inter-anotator agreement between MTurk workers (Fleiss’ K) and between MTurk workers and expert annotators (Cohen’s K).
3.4 Models
The following section provides an overview of the models used in the study. First, the
logistic regression classifier is described. Next, sequential models are briefly introduced
before describing conditional random fields, which will be used to compare against
logistic regression in terms of precision, recall, and F1 score.
3.4.1 Linear Classification: Logistic Regression
Several popular models are available for linear classification. Logistic Regression
was chosen as the model for performing this classification task, and a Python
implementation7 is used to build the models using the Scikit-Learn8 machine learning
library. Logistic regression estimates a conditional probability from the training data
using the following equation:
𝑃 𝑌= 1 𝑋 = 1
1+ exp (𝑤! ! 𝑤!𝑋!)
!!!
where Y is the speech act to be predicted conditioned on X, which is the set of features
used by the classifier.The intuition for classification is the same as prediction of real
values with linear regression, however in logistic regression, Y is instead the probability
of a predicted binary outcome instead of an unbounded real-valued output as in linear
7
http://scikitlearn.org/stable/modules/generated/sklearn.linear_model.LogisticRegression.h tml
regression. Both models have the advantage of a straightforward interpretation of
modeling the outcome variable, or label, as the result of some linear combination of a set
of independent variables, or features.
3.4.2 Structured Classification: Conditional Random Fields
While linear classifiers can be effective in many settings, several works surveyed
above showed the effectiveness of using structured learning models. These models
likewise attempt to infer a function that describes the relationship between features to
labels as in the standard binary classification case, but predict a sequence of labels to a
set of test instances as opposed to assigning predicted labels individually to test instances
as in the case of logistic regression. Casting this task as a sequence prediction problem
allows for a model to exploit the sequential nature of the posts within these threads, and
may help improve model performance.
In particular, conditional random fields are a family of popular sequential models, and
will be used for comparison against logistic regression in the speech act prediction task.
A structured machine learning library written in Python called PyStruct9 is used to
implement a linear chain conditional random field and test its performance on this
classification task (Mueller and Behnke, 2014). While other models exist for sequence
prediction, conditional random fields are a good choice here since they estimate a
conditional probability distribution over the observed features and labels in a similar
fashion to logistic regression, allowing for a fair comparison between the two models.
Using conditional probabilities for these estimates as opposed to using joint probabilities
has other theoretical advantages, but these points will not be emphasized here (Lafferty et
al, 2001).
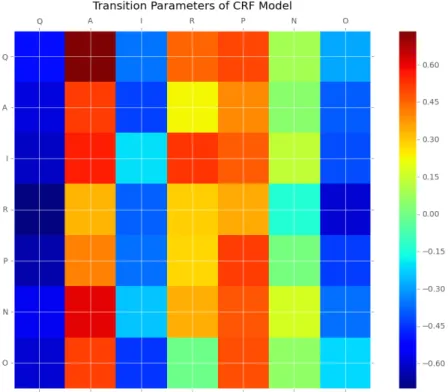
The most important aspect of conditional random fields (hereafter CRFs) for
comparing them against linear classifiers is their ability to model changes in so-called
“states.” For the purposes of the experiments described here, these states are simply the
speech acts that constitute the labels for the posts, and therefore there are seven states.
CRFs use a feature function in order to model states that are adjacent to one another, and
learn probabilities of changing from one state to another. More formally, a feature
function can be defined as 𝒇(𝒁𝒏!𝟏,𝒁𝒏,𝒙,𝒏)where Zn-1 is the previously observed state,
Zn is the current state, x is the entire input sequence, and n is the index of the current
sequence the model is in. For the purposes of forum post classification, the intuition is
that this ability to model changes in state may increase performance since many states, or
speech acts, within the dataset may regularly follow one another, as in the case of
answers following questions within the discussion thread.
4
. Machine Learning Experiments: Pred
icting Speech Acts
The previous section provided a description of the dataset under analysis, a
description of the data collection process, and an introduction to the models that will be
tested in this study. In this section, the machine learning experiments are described.
These are used to (a) evaluate whether machine learning models are able to classify posts
into these speech act categories, and (b) to compare the performance of two different
types of model on this task. Section 4.1 describes the features used by the classifiers. The
next section (4.2) provides an overview of how all classifiers were evaluated and gives a
score as well as a brief description of cross validation—a popular method for evaluating
classifiers in supervised learning. Finally, Section 4.3 covers the experimental setup.
4.1 Description of Features
Beyond collecting gold-standard labels, perhaps the most important aspect of
supervised learning is extracting and constructing high-quality features for the learning
algorithm to use in the training stage. Various types of features were constructed for
prediction of these speech act categories, and these are presented below. The number of
individual features within each feature set is shown in parentheses. In total, 237 features
were used for each model.
LIWC Word Count Features
These features were constructed using the Linguistic Inquiry Word Count (LIWC)
text analysis software (Tausczik and Pennebaker, 2010). LIWC features are designed to
capture a variety of psychological aspects of written text, and these may be useful for
predicting speech acts related to aspects of sentiment and cognitive engagement with
course material in the forum. These are computed by comparing input text to various
word list dictionaries correlated with different psychological and emotional states. Each
post within the discussion forums was standardized by down-casing all text and removing
punctuation before feeding these threads to the LIWC software, which produced
numerical output for these features.
• Affect (8) These features capture general positive and negative sentiment within
posts, as well as more general emotions such as sadness anxiety, and the presence
• Cognitive Engagement (9) These features attempt to measure more abstract
aspects of posts including whether the post is comparing and contrasting items,
expressing uncertainty, or considering a causal relationship.
• Personal Concern (9) These features capture personal aspects of text within
posts including personal accomplishments, money, and death.
• Linguistic (26) Several more general linguistic aspects of the writing in posts
were captured using these features, including relative and absolute word
frequency counts, average word counts per sentence, counts for different verb
tenses, as well as expressions such as quantification and negation.
• Perceptual (4) These features attempt to capture aspects of text directly related to
sense perception including hearing, feeling, and seeing.
• Social (4) Features referencing social aspects such as other humans, family, or
friends were computed for these features.
• Spoken (3) Different features were computed to capture typically spoken
linguistic features such as non-fluencies (“uh”, “hmm”) and fillers (“blah”, “you
know”).
Manually Constructed Features
In addition to the features computed using the LIWC software, several features were
constructed from other aspects of thread posts.
• Sentiment features (4) Sentiment features may be informative for particular
speech acts, especially positive and negative acknowledgement. These features
negative words that occurred in each post using wordlists constructed by Liu et al
(2005).
• Unigram (140) The terms present in a post are likely predictive of the topic or
content therein. To capture these more nuanced aspects of posts, the χ2 correlation
was computed between each stemmed unigram and each speech act
independently. The 20 unigrams with the top χ2 value per speech act category
were then taken for these features.
• Text Similarity (6) Similarity between post types may be useful in training
classifiers. Thus, the cosine similarity10 metric was used to measure similarity
between posts based on TF-IDF11 weighting scheme of terms in posts.
Specifically, similarity between a post and the previous post; similarity with the
first post in the thread; and the minimum, maximum, mean, and variance of the
similarity with the previous thread post were all computed as similarity features.
• Temporal Features (3) Given that students were expected to complete
homework assignments and quizzes, features were computed to measure the time
in days, hours, and minutes between the time a post was written and the time the
nearest homework assignment was due.
• Author (1) The type of speech acts contributed in a discussion thread likely
varies between instructors and students. To capture this, the author of a thread is
10 Cosine similarity measures the similarity between two vectors by computing the cosine
of the angle between them. The text of each post is represented as such a vector with each feature described here appearing as a numeric value within this vector.
11 TF-IDF (term frequency-inverse document frequency) is a statistic that attempts to
represented in this binary feature where 1 indicates that the post was written by an
instructor and 0 indicates the post was written by a student.
• Link (1) Link-sharing may be predictive of answers. Link-sharing is modeled as a
binary feature indicating the presence or absence of a hyperlink.
• Modal Verbs (2) Modal verbs were shown to be predictive in past work on
discussion forum classification (Bhatia et al, 2012). These features are computed
by calculating the absolute and relative frequencies of common modal verbs in a
post.
• Position (2) The relative and absolute position of the post within the thread is
given by this set of features.
• Post/Comment (1) This binary feature indicates whether the post is a “top-level”
post or a comment that is structurally tied to a previous post.
• Punctuation (13) Punctuation features may be specific to several speech acts, but
particularly to identifying questions. To capture this, relative and absolute
frequencies of thirteen punctuation types were calculated for each post.
• Votes (1) In addition to simply writing the posts, students can communicate with
one another in the form of “voting” on posts. Students may “up-vote” a post they
found particularly helpful or insightful, and “down-vote” a post they found
unhelpful or distracting. These vote counts were included in the dataset and are
utilized in the models for this study.
4.2 Evaluation Methodology
Both logistic regression and conditional random field models were evaluated using
defined as the proportion of test instances classified as belonging to speech act S that
actually belong to speech act S. Recall may be informally defined as the proportion of
total test instances that belong to speech act S that were identified by a classifier as
belonging to speech act S. More formally precision can be formulated as:
𝑃= 𝑡𝑟𝑢𝑒 𝑝𝑜𝑠𝑖𝑡𝑖𝑣𝑒𝑠𝑡𝑟𝑢𝑒 𝑝𝑜𝑠𝑖𝑡𝑖𝑣𝑒𝑠+𝑓𝑎𝑙𝑠𝑒 𝑝𝑜𝑠𝑖𝑡𝑖𝑣𝑒𝑠
where true positives are test instances the classifier has correctly predicted as belonging
to speech act S, and false positives are test instances the classifier has incorrectly
predicted as belonging to speech act S. Similarly, recall can be formulated as:
𝑅 = 𝑡𝑟𝑢𝑒 𝑝𝑜𝑠𝑖𝑡𝑖𝑣𝑒𝑠
𝑡𝑟𝑢𝑒 𝑝𝑜𝑠𝑖𝑡𝑖𝑣𝑒𝑠+𝑓𝑎𝑙𝑠𝑒 𝑛𝑒𝑔𝑎𝑡𝑖𝑣𝑒𝑠
where false negatives are test instances the classifier has incorrectly predicted as not
belonging to class S. Finally, the tradeoff between precision and recall is reported in the
F1 score, which computes the harmonic mean between precision and recall:
𝐹1= 2×𝑃𝑟𝑒𝑐𝑖𝑠𝑖𝑜𝑛 × 𝑅𝑒𝑐𝑎𝑙𝑙
𝑃𝑟𝑒𝑐𝑖𝑠𝑖𝑜𝑛+𝑅𝑒𝑐𝑎𝑙𝑙
Supervised learning experiments use a held-out test set in order to evaluate the
performance of classifiers. That is, a classifier is trained on a set of data in order to
approximate a function f that describes a relationship between a set of features x and a
label y for each instance within a set of training data. This function f is then used by the
classifier to make predictions on a held-out test set ,which is completely unique from the
training set. One approach for evaluation is to split the data into one training set for
model learning and one test set for evaluation of model performance. However, this may
not give a complete picture of performance since the data could have been split in a
One way to overcome this is to employ a method called k-fold cross validation. In this
method, the original dataset is randomly split into k folds, and k-1 of these folds are used
for training, while the fold left out of training is used for testing. These steps are then
applied iteratively such that each fold is used as the test set, while training on the
remainder of folds that are not used in the test set. The final reported metrics using this
method are then averaged across the k folds to compute the model’s average
performance. While the value of k is arbitrarily chosen, ten is a popular value for k, and
will be used in the experiments here. This method of evaluation allows for a more
realistic picture of model performance to be shown since it is trained and tested on
several different partitions of the dataset.
4.3 Experimental Setup
Details of the experiments are presented in this section. Both logistic regression and
CRF models were trained and tested using 10-fold cross validation. The same ten folds
were used for both models, ensuring a fair comparison between the two when looking at
performance. Both logistic regression and the learning algorithm12 for the CRF have a C
parameter that can take on different values. This parameter controls the misclassification
cost on the training set, and different values may affect performance. For both logistic
regression and the CRF learning algorithm, C was set to 1 for all experiments.
Logistic regression was trained in a so-called “one vs. rest” fashion for the prediction
of these speech acts. That is, one logistic regression classifier was trained for each speech
act independently, totaling seven classifiers. In addition to outputting a predicted label,
logistic regression outputs a probability of the test instance belonging to a certain label or
12 The PyStruct implementation of the linear chain CRF uses a structured support vector
speech act. In order to make a single prediction, the label with the highest probability is
taken to be the predicted label for a test instance.
Before using the features described in Section 5.1 as input for classifiers, the values
of these features were first normalized to a scale between 0 and 1.13 The raw numerical
values for these features may vary widely, and this large range could skew the probability
distributions learned by the classifiers being tested. Feature normalization thus attempts
to limit the influence of very large or very small feature values that are likely not
representative of the overall distribution of the dataset. This feature normalization step
was performed in each fold of cross validation, and the same feature scale used for the
training set was applied to the test set in each fold.
Finally, the implementation of logistic regression used in these experiments allows
for an option to apply weighting schemes to labels within the training set if the
distribution of these labels is not uniform. As can be seen in Figure 2 above, the labels
throughout the dataset are not uniformly distributed and this presents a challenge when
training these classifiers. For training logistic regression, this label weighting option was
set to inversely weight labels within the training set, placing greater weight on labels that
are seen infrequently in the training set and placing less weight on labels seen frequently
within the training set. This re-weighting is performed in each fold of cross validation so
as to be tailored to each training set.
13 This task is often called min-max normalization. It is achieved by using the following
equation 𝑁𝑜𝑟𝑚 𝑐! = !!!!!"#
!!"#!!!"# where ci is an individual value in column C, Cminis the
5
. Results
Results from these experiments are shown in Table 3 below. Best results for each
speech act by metric are highlighted in bold. Often classification results are presented
with the assumption that a model has a 50% random chance of identifying an instance as
belonging to the correct class. That is, if a classifier has not learned any meaningful
relationship between the features and target labels, we would expect a “random guess”
from the classifier as to which label an instance in the dataset belongs to, and this is often
taken as an implicit baseline to compare against. However, this assumes (a) that the
prediction task is binary where we are interested in predicting either the presence or
absence of a label and (b) that the labels in the training and test sets are evenly balanced,
with half of the instances consisting of positive examples of the label to be identified and
half consisting of negative examples.
These two assumptions do not hold in the present experiments since the goal is to
classify posts into one of seven possible labels, and it has been shown that the speech act
labels are not uniformly distributed within the dataset, with answers and positive
acknowledgment occurring quite often and issue resolutions and negative
acknowledgement being especially sparse. Thus, along with results from both models
tested in this study, precision and F1 score metrics are reported for a baseline heuristic for
each speech act label within the test sets.
Each baseline precision metric indicates the proportion of the test set consisting of
each speech act, averaged over the ten folds of cross validation. These values are
computed as !! ! 𝑃!
!!! , where N is the number of folds used for cross validation (ten in
iteration number i of cross validation. This can be interpreted as the precision attained for
labeling every instance within the test set as speech act S. This provides a more realistic
measure to compare against when evaluating the performance of both the logistic
regression and CRF models.
Finally, F1 scores are computed for these baseline metrics by assuming perfect recall
(recall = 1) for each speech act within the test sets, and computing the harmonic mean
between these recall metrics and the precision metrics described above. This offers
further depth of comparison between the two models tested, and a more naïve baseline
approach. The discussion below will focus primarily on precision and F1 score since
these are reported across all classification methods, however recall is reported for
completeness.
Speech
Act Logistic Regression CRF Heuristic Baseline
Precision Recall F1 Precision Recall F1 Precision F1
Question 0.238 0.184 0.208 0.450 0.355 0.397 0.124 0.220
Answer 0.421 0.315 0.360 0.429 0.465 0.446 0.270 0.425
Issue 0.264 0.285 0.274 0.431 0.264 0.327 0.090 0.165
Issue
Resolution 0.083 0.228 0.122 0.203 0.133 0.161 0.028 0.055
Pos-Ack 0.464 0.39 0.424 0.460 0.600 0.521 0.339 0.506
Neg-Ack 0.054 0.226 0.087 0.050 0.050 0.050 0.020 0.039
Other 0.361 0.438 0.396 0.446 0.320 0.373 0.131 0.032
Table 3: Results of 10-fold cross validation for Logistic Regression and Conditional Random Field models
6. Discussion
6.1 Model Comparison
Several trends are worth noting in these results. First, both the logistic regression and
conditional random field models outperform the F1 scores of the baseline heuristic with
respect to every speech act. This is encouraging overall, and indicates that the features
learn from. Second, the CRF model makes some impressive gains over both the baseline
heuristic and the logistic regression model. For instance, questions appear with roughly
12.4% frequency within the test sets on average, and logistic regression identifies these
posts with 23.8% precision. This may appear to be quite low performance, but it is
important to keep the caveats above in mind. Regardless, the CRF model significantly
outperforms both these metrics with 45.0% precision. This provides evidence that
modeling this task as a sequence prediction problem has some advantages, and the CRF
is able to leverage the structural qualities of these threads to make better predictions, at
least with respect to questions.
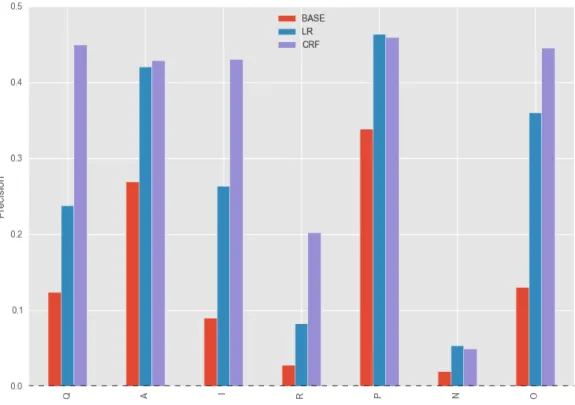
Figure 4 provides a graphical comparison of precision performance for the two
models and the baseline heuristic. Overall, we see that the CRF model achieves best
performance for all speech acts except two—positive acknowledgement and negative
acknowledgement, where it is slightly outperformed by logistic regression. The gains
made by logistic regression in classifying these speech acts are quite small (+0.004 for
both positive and negative acknowledgement), and it is not clear whether these results
indicate a true difference in performance between the two models. Overall, the precision
performance indicates that both classifiers outperform the baseline and likely learn a
reasonable function in order to classify these speech acts, however further work could be
conducted to improve performance. Additionally, these results indicate that the CRF
Figure 4: Precision scores for baseline heuristic (BASE), logistic regression (LR), and conditional random field (CRF)
While precision is a useful and popular metric for evaluation, it is important to
investigate the performance tradeoffs between precision and recall and this is exactly
what the F1 score is used to communicate. Figure 5 presents a graphical depiction of the
performance of the two models and the baseline heuristic with respect to the F1 score.
Here, a few different trends emerge. While precision scores for the baseline heuristic are
quite low, since we are assuming perfect recall this allows for many of the F1 scores for
this heuristic to approach the performance of the two classifiers tested in this study. This
strong assumption about recall allows the baseline heuristic to outperform the logistic
regression model in several cases (questions, answers, and positive acknowledgement).
However, the CRF model shows F1 scores that outperform the baseline heuristic in all
exception of negative acknowledgement and other. This provides further evidence that
the CRF model is able to leverage useful information from modeling these threads in
sequence, and this aids in this prediction task.
Figure 5: F1 scores for baseline heuristic (BASE), logistic regression (LR), and conditional random field (CRF)
6.2 Error Analysis
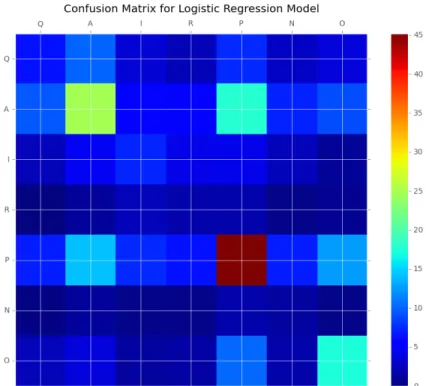
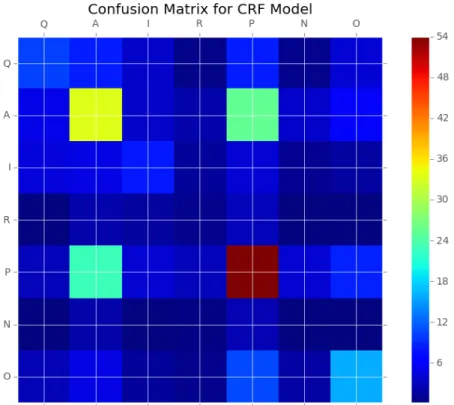
Investigating a model’s errors is often more informative than presenting its successes.
In this section, an error analysis is presented for both logistic regression and CRF models.
Confusion matrices are useful visual tools for investigating the performance of classifiers,
and one confusion matrix per classifier is presented below. These matrices depict
predictions made by the model on the y-axis (left-hand side) and the true labels along the
x-axis (top). Thus, if we label any predicted label as i and any true label as j, the value of