Sharif University of Technology
Scientia IranicaTransactions B: Mechanical Engineering http://scientiairanica.sharif.edu
Articial neural network modelling for polyethylene
FSSW parameters
M. Kurtulmus
a;and A. Kiraz
ba. Applied Science High School, Marmara University, Istanbul, Turkey. b. Department of Industrial Engineering, Sakarya University, Sakarya, Turkey. Received 16 December 2017; accepted 28 May 2018
KEYWORDS Friction Stir Spot Welding (FSSW); High density
polyethylene (HDPE); Articial neural networks; Optimization.
Abstract. In a Friction Stir Spot Welding (FSSW) process, welding parameters (the tool rotational speed, tool plunge depth, and stirring time) aect the nugget formation in high-density polyethylene (HDPE) sheets. The size and microstructure of the nugget determine the resistance of the joint to outer forces. The optimization of these parameters is vital to obtaining high-quality welds. Feed forward back-propagation articial neural network models are developed to optimize the FSSW parameters for HDPE sheets. Input variables of these models include tool rotation speed (rpm), the plunge depth (mm), and the stirring time (s) that aect lap-shear fracture load (N) output. Prediction performances of 6 models in dierent specications are compared. These models dier in terms of the training dataset used (80%-100%) and the number of neurons (5-10-20) in a hidden layer. The best prediction performances are obtained using 20 neurons in a hidden layer in both training dataset. There is good agreement between developed models' predictions and the experimental data.
© 2018 Sharif University of Technology. All rights reserved.
1. Introduction
In the automotive industry, aluminium alloys and aluminium composite parts are widely used in the body structure of cars accounting for 20% of the total weight of the vehicle [1]. The automotive industry invented the Friction Stir Spot Welding (FSSW) process in 2001 to join aluminium parts together [1]. This welding process was successfully applied to thermoplastic sheets [2]. The FSSW process is applied to thermoplastic sheets in four stages: (1) plunging, (2) stirring, (3) solidifying, and (4) retracting [3-5]. At the end of the operation, a nugget forms which joins the workpieces together. The tool rotation speed, its plunged depth,
*. Corresponding author.
E-mail address: [email protected] (M. Kurtulmus) doi: 10.24200/sci.2018.50030.1473
and stirring time determine the size, characteristics of the nugget, and the mechanical properties of weld joints [4,5].
Recently, in the eld of joining materials, computer-aided Articial Neural Network (ANN) mod-elling has gained increasing importance. Controlling the welding parameters and mechanical properties of welds are important problems in welding processes [6]. ANN models have a wide range of applications regard-ing optimization of weldregard-ing parameters and analysis of quality control specications [7-12]. Based on the literature examinations, there are very few number of studies on optimization of welding parameters of FSSW thermoplastic sheets. There are 2 applications of the Taguchi method [13,14] and an ANN application [15]. In this ANN-based paper, only two welding parameters were studied. The present study makes an attempt to use ANN modelling to optimize FSSW parameters of HDPE sheets.
2. Materials and methods
HDPE sheets with 4 mm thickness were used in this study. A semi-automatic milling machine was used to weld the sheets. The lap-shear test is the most common weld test for spot welds. Therefore, lap-shear test specimens were produced by the milling machine. In lap-shear tests, fracture loads were identied. The fracture load determines the weld quality of a spot weld. A high fracture load indicates that a high-quality spot weld has been produced in the joining operation. Table 1 displays how the welding parameters vary in this research. In each welding operation, the stirring tool immerged into the weld area with a 3.3 mm/s plunging rate. The deviation limits of the plunging depth varied within 0:01 mm. All the welds were produced without preheating. In each welding, 50-second constant dwell time was used. Moreover, 192 welds were produced with 64 dierent welding parameters. By each welding parameter, 3 welds were produced. The tests were planned to determine the eects of tool plunge depth, rotation speed, and stirring time on polyethylene FSSW lap-shear fracture load. The lap-shear tests were done on an Instron machine at a constant crosshead speed of 5 mm/s. For each of welding parameters, 3 tests were done and the arithmetic average was calculated.
3. Results and discussion
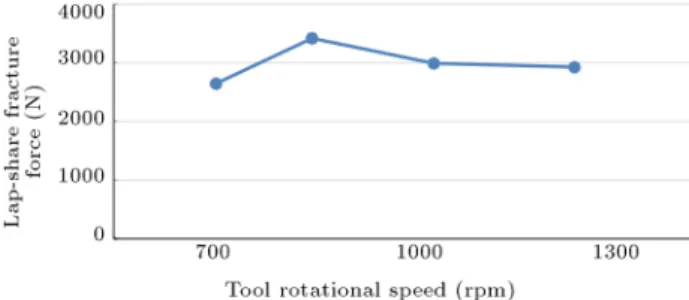
The relations between FSSW parameters (welding stirring time, plunge depth, and tool rotational speed) and lap-shear fracture load of HDPE welds are shown in Figures 1, 2, and 3, respectively. The graphics were drawn by using the calculated arithmetic averages of the lap-shear fracture loads. Each point on the graph represents the average fracture load of three welds produced with the same welding parameters. The eects of welding parameters on the lap-shear fracture load are not explained in this paper, because other authors have already investigated them in detail [3,4]. 4. Developed articial neural network models In this study, 6 ANN models are developed including three input variables: tool rotation speed (rpm), plunge depth (mm), and dwell time (s), which aect the Lap-shear fracture load (N) output. Feed forward back-propagation ANN models are used to predict the
Lap-Figure 1. The eect of stirring time on lap-shear tensile fracture load.
Figure 2. The eect of tool rotational speed on lap-shear tensile fracture load.
Figure 3. The eect of plunged depth on lap-shear tensile fracture load.
shear fracture load. A sample dataset of laboratory experiments is shown in Table 2. The input-output data can be actual or normalized. It is obvious that using normalized data leads to better results. Dataset is normalized using Eq. (1):
X = (Xi X min)=(X max X min) X = Normalized data
Xi = Actual data
X min = Minimum value of actual data
X max = Maximum value of actual data (1)
Table 1. Welding parameters and their ranges.
Welding parameters Units Ranges
Tool plunge depth Millimeter (mm) 0.1 - 0.2 - 0.3 - 0.4 Tool rotation speed Round per minute (rpm) 560 - 710 - 900 - 1200
Table 2. Sample dataset from laboratory experiments.
Inputs Outputs
Data No.
Tool rotation
speed
Plunge depth
Dwell
time Lap-shear fracture load
Experiment 1 Experiment 2 Experiment 3
1 560 0.1 25 400 500 450
2 560 0.3 25 800 800 900
3 710 0.1 45 2198 2306 2434
4 900 0.2 35 2459 2824 2300
5 900 0.4 15 1000 900 780
6 1120 0.2 25 2330 2600 2560
7 560 0.1 35 715 785 850
8 1120 0.1 25 900 1200 1350
9 710 0.4 35 2210 1923 2100
... ... ... ... ... ... ...
64 900 0.4 45 2760 2838 2976
Table 3. Normalized dataset sample of laboratory experiments.
Inputs Outputs
Tool rotation speed Plunge depth Dwell time Lap-shear fracture load
0.001779359 0.125 0.125 0.002976190
0.268683274 0.875 0.375 0.389880952
0.606761566 0.625 0.625 0.671130952
0.998220641 0.625 0.125 0.122023810
0.001779359 0.125 0.875 0.406547619
0.268683274 0.375 0.125 0.251190476
0.606761566 0.625 0.625 0.627976190
0.998220641 0.625 0.625 0.583333333
0.268683274 0.625 0.125 0.235119048
0.606761566 0.375 0.875 0.913095238
0.998220641 0.625 0.125 0.190476190
Six ANN models, including dierent properties, are developed in this study, and their prediction perfor-mances are compared. Three of the developed ANN models respectively include 5-10 and 20 neurons in the hidden layer; 80% of this dataset is used for training data and the other 20% for validation. In the other three developed ANN models, 5-10 and 20 neurons in the hidden layer are trained with 100% of dataset and validated with the same dataset used in the rst three ANN models. The normalized training and testing dataset samples of laboratory experiments are shown in Table 3; testing dataset is shown in bold.
In this study, feed forward back-propagation ANN model is preferred, which has been used herein for multi-layered ANNs due to being a global approximator
and the best performed ANN model under current values.
Levenberg Marquardt is used as a training algo-rithm in the developed feed forward back-propagation ANN model. Gradient Descent with Momentum (GDM) learning algorithm is applied to the learning algorithm in Matlab software. Variables are normalized between 0-1; therefore, LOGSIG (Log- sigmoid) trans-fer function is pretrans-ferred for the developed ANN model. Six dierent ANN models are developed with dierent properties as mentioned above (percentage of training dataset and the number of neurons in the hidden layer). As a result of tests and analyses, network's optimum topology has been obtained with specic iteration. The developed ANN model consists of 3-neuron-input
layers that represent inputs, hidden layers made of 5-10 and 20 neurons, and the output layer made of a neuron. Structures representing ANN's input, output, and hidden layers are shown in Figure 4. Then, the developed ANN models have been run 6 times with the mentioned properties.
Figure 4. Structure of developed ANN models.
5. Conclusion
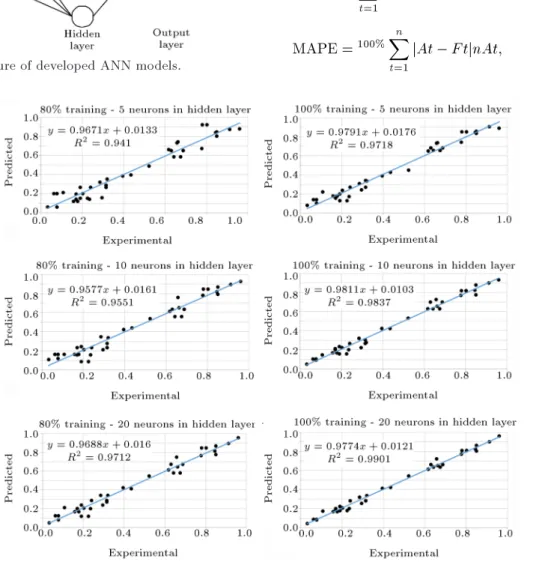
In this study, six dierent developed models were compared with actual data, as illustrated in Figure 5. Outputs of these ANN models were compared with the actual values listed in the chart below after training completion. Then, MAE (Mean Absolute Error) and MAPE (Mean Absolute Percentage Error) were selected as types of error by means of Eqs. (2) and (3) to validate the developed ANN models given in Table 4. The best prediction performance was obtained with 100% training set and 20 neurons in the hidden layer as shown in bold in Table 4:
MAE =1 n
n
X
t=1
jAt F tj (2)
MAPE =100%Xn t=1
jAt F tjnAt; (3)
Figure 5. Regression analysis results of 6 developed ANN models. Table 4. MAE and MAPE values of 6 developed ANN models.
Ratio of training dataset 80% 100%
Number of neurons in hidden layer 5 10 20 5 10 20
MAE 0.0567 0.0475 0.0392 0.0384 0.0305 0.0233 MAPE (%) 27.462 27.645 17.606 21.417 13.381 10.035
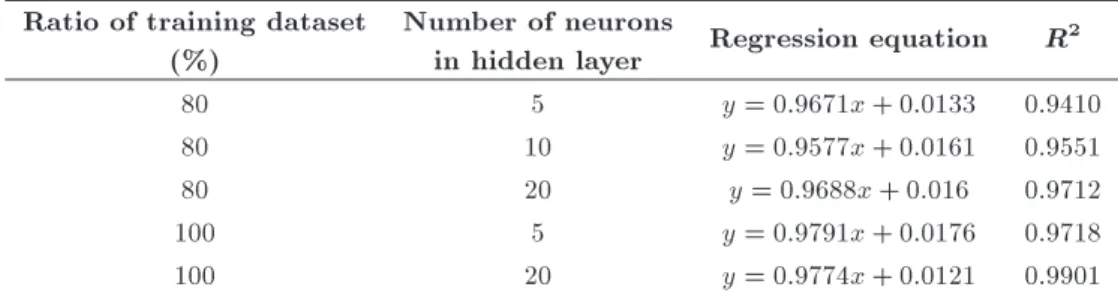
Table 5. Regression equation and MSE values of developed ANN model. Ratio of training dataset
(%)
Number of neurons
in hidden layer Regression equation R2
80 5 y = 0:9671x + 0:0133 0.9410
80 10 y = 0:9577x + 0:0161 0.9551
80 20 y = 0:9688x + 0:016 0.9712
100 5 y = 0:9791x + 0:0176 0.9718
100 20 y = 0:9774x + 0:0121 0.9901
where At is actual data, F t is forecast at time t, and n is the number of samples.
Figure 4 shows the comparison between experi-mental and predicted values of the output variable by using 6 developed ANN models. Comparison results (regression equations and MSE values) of all developed ANN models are concisely given in Table 5.
References
1. Lathabai, S., Painter, M.J., and Cantin, G.M.D. \Fric-tion stir spot welding of automotive lightweight al-loys", Proceedings of the 7th International Conference on Trends in Welding Research, May 16-20, Georgia USA (2005).
2. Lambiase, F., Paoletti, A., and Ilio, D. \Mechanical behaviour of friction stir spot welds of polycarbonate sheets", The International Journal of Advanced Man-ufacturing Technology, 80, pp. 301-314 (2015).
3. Kurtulmus, M. \Friction stir spot welding parameters for polypropylene sheets", Scientic Research and Essays, 7(8), pp. 947-956 (2012).
4. Bilici, M.K. and Yukler, A.I. \Eects of welding parameters on friction stir spot welding of high density polyethylene sheets", Materials and Design, 33, pp. 545-550 (2012).
5. Bilici, M.K. and Yukler, A.I. \Inuence of tool geom-etry and process parameters on macrostructure and static strength in friction stir spot welded polyethylene sheets", Materials and Design, 33, pp. 145-152 (2012).
6. Chandrasekhar, N. and Vasudevan, M. \Intelligent modeling for optimization of A-TIG welding process", Materials and Manufacturing Processes, 25, pp. 1341-1350 (2010).
7. Acherjee, B., Mondal, S., Tudu, B., and Misra, D. \Application of articial neural network for predicting weld quality in laser transmission welding of thermo-plastics", Applied Soft Computing, 11(2), pp. 2548-2553 (2011).
8. Anand, K., Barik, B.K., Tamilmannan, K., and Sathiya, P. \Articial neural network modeling studies to predict the friction welding process parameters of Incoloy 800H joints", Engineering Science and Tech-nology, an International Journal, 18, pp. 394-407 (2015).
9. Okuyucu, H., Kurt, A., and Arcaklioglu, E. \Articial neural network application to the friction stir welding of aluminum plates", Materials and Design, 28, pp. 78-84 (2007).
10. Davraz, M., Kilincarslan, S., and Ceylan, H. \Predict-ing the Poisson ratio of lightweight concretes us\Predict-ing articial neural network", Acta Physica Polonica A, 128(2B), p. 184 (2015).
11. Ozcanli, Y., Kosovali Cavus, F., and Beken, M. \Comparison of mechanical properties and articial neural networks modeling of PP/PET blends", ACTA Physica Polonica A, 130(1), p. 444 (2016).
12. Tekin, H.O., Manici, T., Altunsoy, E.E., Yilancioglu, K.K., and Yilmaz, B. \An articial neural network-based estimation of Bremsstarahlung photon ux cal-culated by MCNPX", ACTA Physica Polonica A, 132(3), p. 967 (2017).
13. Bilici, M.K., Yukler, A.I., and Kurtulmus, M. \The optimization of welding parameters for friction stir spot welding of high density polyethylene sheets", Materials and Design, 32, pp. 4074-4079 (2011).
14. Bilici, M.K. \Application of Taguchi approach to optimize friction stir spot welding parameters of polypropylene", Materials and Design, 35, pp. 113-119 (2012).
15. Chavan, A. and Shete, M.T. \Optimization of fric-tion stir spot welding process using articial neural network", International Journal of Science Technology and Engineering, 1, pp. 353-358 (2015).
Biographies
Memduh Kurtulmus obtained his MSc degree in Metal working eld in 1994 at Marmara University, Istanbul, Turkey. He nished MSc study in 1998 and PhD program in 2005 at Marmara University. Both of his theses were in welding technology eld. He obtained Level 3 certicates about Non-Destructive Testing Processes at the Turkish Standarts Institute in 2003. He received a BSc degree in Mechanical Engi-neering at Istanbul Newport University. He became an International Welding Engineer at Romanian Welding Institute in 2006. He worked at Marmara University Technical Engineering Faculty as a Research Assistant in the years of 1994-2006. He became an Assistant
Professor at the same faculty in 2006. He is an expert in maintenance welding and NDT processes. His 52 papers were published in journals and symposium proceedings.
Alper Kiraz was born in 1985. He graduated in 2007 from the Department of Industrial Engineering at Sakarya University, where he started his undergraduate studies in 2003. He started his master's degree in
Industrial Engineering at Sakarya University in 2007 and started his career as a Research Assistant at Sakarya University Faculty of Engineering Department of Industrial Engineering at the beginning of the year. He completed his master's thesis titled \Virtual Laboratory Design with Articial Neural Networks" and started his PhD in January 2010. He is currently an Assistant Professor of Industrial Engineering at Sakarya University.