Sharif University of Technology
Scientia IranicaTransactions B: Mechanical Engineering http://scientiairanica.sharif.edu
Research Note
A note on the critical gap of bubble coalescence during
foaming process: Diuse-interface modeling
E. Amiri Rad
Department of Mechanical Engineering, Hakim Sabzevari University, P.O. Box 397, Iran Received 27 July 2016; received in revised form 21 February 2017; accepted 1 May 2017
KEYWORDS Bubble; Coalescence; Critical gap; Foaming;
Lattice Boltzmann.
Abstract.Bubble coalescence is an important stage of foaming process. A goal of foaming is to produce numerous, uniform-size bubbles. Therefore, suppression of bubble coalescence is desirable during foaming process. For stationary bubbles, if their distance is less than a critical gap, they will coalesce. Actually, in this case, attractive forces attract the outer surfaces to touch each other and form a growing gas bridge, which nally merges the bubbles. For bigger distance, the attractive forces cannot make a bridge and coalescence will not happen. In this study, the dynamics of bubble coalescence are modeled using a diuse-interface LBM. Then, critical gap of bubble coalescence is dened as the maximum distance between the stationary bubbles where the coalescence will happen. Sensibility of critical gap is obtained with respect to critical properties of material, bubble size, viscosity of gas and liquid, density ratio, surface tension, temperature, and interface thickness. The results show that interface thickness is the only factor that controls the critical gap. In other words, in the case of stationary bubbles, by a precise estimation of interface thickness, the coalescence can be predicted. Critical gap is a useful parameter in foaming where the maximum number of bubbles is desirable.
© 2018 Sharif University of Technology. All rights reserved.
1. Introduction
Foaming is a complex process in multiphase systems that has important applications in the food and chemical industries, reghting, mineral processing, and structural material science and has considerably attracted interest of the researchers [1-8]. Foaming consists of 3 stages, namely, nucleation, bubble growth, and coarsening. During the coarsening stage, formed bubbles coalesce and combine with larger bubbles. The bubble and droplet coalescence has been addressed by many researchers via experimental or numerical studies [9-34].
*. Tel/Fax: +98 5144012521;
E-mail address: [email protected] doi: 10.24200/sci.2017.4335
Bubble coalescence is mainly explained by two theories. The rst one is lm drainage theory, which considers the time required for the drainage of the thin liquid between two bubbles. Actually, the interfacial forces, such as van der Waals attractive force, cause the drainage of liquid lm. The details of this theory have been discussed by Chaudhari and Hofmann [30]. The second theory is stochastic theory, which was proposed in 2002 by Ghosh and Juvekar for coalescence of drops and bubbles [25]. Paulsen et al. used an electrical method and high-speed imaging to describe the droplets coalescence. They showed that the outer uid had a small eect on the coalescence dynamics [9-12].
Baroudi et al. investigated the growth dynamics of the connecting liquid bridge during the coalescence of two droplets in a binary system using LBM [13]. Sprittles simulated coalescence numerically and
com-pared the results with experimental data [14]. Czer-ski investigated sound during bubble coalescence [15]. Case et al. employed an electrical method to study the coalescence of two low-viscosity droplets at early times [16,17]. Aryafar et al. used an ultrafast x-ray phase-contrast imaging to investigate the early merging dynamics of two water drops in air [18]. Giribabu and Ghosh developed an experimental technique for studying coalescence where two bubbles were allowed to rest together in a conical cell, which was immersed in an aqueous surfactant solution [19]. They focused on the interfacial dynamics after two bubbles touched. Gilet et al. experimentally investigated the par-tial coalescence of a droplet on a planar liquid/liquid interface for various viscosity ratios [20]. Dirk et al. studied droplet coalescence in a molecular system for dierent viscosities and an ultralow surface ten-sion [21]. Thoroddsen et al. used an ultra-high-speed video camera to study the coalescence for dierent drop sizes and liquid viscosities [22]. Duchemin et al. studied the coalescence of two droplets where they assumed approach velocity of zero and neglected the dynamical eects of the outer uid. They found that the minimum radius of the connecting bridge was proportional to square root of time [23]. Wu et al. used a high-speed imaging system to investigate the coalescence of two liquid drops driven by surface tension [24]. Their experimental results conrmed the scaling law that was proposed by Duchemin. Eggers et al. simulated coalescence with an external viscous uid both analytically and numerically [26]. Stover et al. used both FEM and experimental methods to study small bubble coalescence [28].
The bubble coalescence is governed by interaction forces between the bubbles. When two bubbles are at rest beside each other, there are some attractive and repulsive forces between their interfaces. When attractive forces overcome the repulsive forces and in-ertia of the droplets, the bubbles will certainly coalesce. The main attractive force is van der Waals, which is responsible for coalescence.
The van der Waals force between the bubbles is inversely proportional to the distance between their interfaces. Therefore, the closer the bubbles, the higher the van der Waals force would be, which makes coa-lescence easier. When they are farther, the van der Waals force is not strong enough to attract them and cause coalescence. Eventually, there should be a critical distance between the bubbles.
The desirable foaming process occurs when there are numerous, equal-size bubbles. This means that avoiding or postponement of coalescence is a favor. However, even in a static system without bubble mo-tion and collision, when the distance between interfaces is less than a minimum value (critical gap), van der Waals attractive forces may push the neighbor bubbles
toward each other to coalesce. If the bubbles stand far away adequately and their distance is greater than the mentioned critical gap, they will not coalesce and this is desirable in foaming process. The objective of this paper is simulation of coalescence stage of foaming and investigating the critical gap between the bubbles.
Conventionally, the interface of gas and liquid is assumed innitely thin where the physical properties are discontinuous. Obviously, coalescence is governed by the interface dynamics of a gas-liquid system and cannot be handled by such a sharp-interface model. Therefore, a diuse-interface model is used that sim-plies the treatment of the interface. Here, the uid properties change smoothly across the interface layer. A diuse-interface model also considers the morphological variations of interfaces much more easily than a sharp-interface description does.
Lattice Boltzmann method is considerably e-cient for simulating interface dynamics [35-45]. Re-garding the thermodynamic treatment of the free en-ergy, i.e. the use of a van der Waals uid model, the behavior of bubble interfaces in the free-energy LBM can be related to van der Waals forces [42,43]. This is an important advantage over similar methods in which a specied length or the grid resolution governs the occurrence of coalescence.
In this paper, a van der Waals-based free en-ergy LBM is used for modeling a gas-liquid system. Using the developed model, coalescence process of 2 stationary equal-size bubbles in a static bulk liquid is modeled; consequently, critical gap of coalescence and its dependency on the important parameters of the system are studied.
2. Simulation method
Lattice Boltzmann equation with a single relaxation time parameter can be expressed as the following [46]:
fi(~r+~cit; t+t)=
1 1
f
fi(~r; t)+1 ff
0
i(~r; t); (1)
where ~r is the lattice position vector, ~ci is particle
velocity, t is time, f is the single relaxation time
parameter, fi(~r; t) denotes the particle distribution
associated with the discrete velocity ~ci, and fi0
indi-cates the local equilibrium distribution function. The discrete velocity ~ciis chosen, such that ~cit is a lattice
vector. In this paper, a two-dimensional square lattice with 9 velocity vectors (D2Q9 Lattice) is used.
Using a suitable equilibrium distribution function, Eq. (1) can describe continuity and Navier-Stokes equations for a non-ideal, one-component uid [41]. Hydrodynamic parameters of the ow are related to distribution function as follows:
=X
i
uj =
X
i
ficij; (3)
where is uid density and uj is ow velocity vector.
The key point in simulating non-ideal, two-phase ow by LBM is nding a suitable equilibrium distribution function that describes the thermodynamic behavior of this ow. Equilibrium distribution function can be considered as a second order expansion of velocity:
f0
i =A+Bujcij+CU2+Dujukcijcik+Gjkcijcik: (4)
Regarding the conservation of Eqs. (2) and (3), the zeroth and rst moments of equilibrium distribution function are as the following:
X
i
f0 i = ;
X
i
f0
icij = uj: (5)
The next moment is chosen such that the continuum macroscopic equations correctly describe the hydro-dynamics of a one-component, non-ideal uid. This gives [40]:
X
i
f0
icijcik=Pjk+ ujuk
+
uj@x@ k+uk
@
@xj+jkum
@ @xm
: (6) Pjkis the pressure tensor and is kinematic viscosity.
The rst formulation of the model omits the third term in Eq. (6) and is not Galilean invariant. Holdych et al. showed that the addition of this term led any non-Galilean invariant terms to be of the same order as nite lattice corrections to the Navier-Stokes equations [47]. In order to fully constrain the coecients, a fourth condition is needed, which is [44]:
X
i
f0
icijcikcim=c 2
3 (ujkm+ ukjm+ umjk): (7) The pressure tensor can be dened as [48]:
Pij= p(~x)ij+
@ @xi @ @xj ; (8)
where is capillary coecient and p(~x) is:
p(~x) = p0 r2 2j@j2: (9)
Also, p0 is obtained using equation of state as:
p0= 0 ; (10)
where is the bulk free energy density as the following [41]:
= pc( + 1)2(2 2 + 3 2): (11)
Here, is compressibility constant; = c 1
is the non-dimensional density; = 1 T
Tc is the
non-dimensional temperature; and Tc, pc, and c are
the critical temperature, critical pressure, and critical density, respectively.
Landau dened the total free energy of a two-phase system as a composite of bulk and interfacial parts as follows [49]:
= Z
(T; ) +2j@j2
dV: (12) This function can describe the equilibrium properties of a one-component, two-phase uid. Obviously, pressure is the connector between free energy function and LBM algorithm.
Subscribing Eq. (4) in Relations (5), (6), and (7), the unknown coecients of equilibrium distribution function can be found and equilibrium distribution function of a two-phase system can be thoroughly determined [38].
The analysis of Holdych et al. showed that Eq. (1) approximated the continuity as follows:
@
@t + r:~u: (13)
Also, Navier-Stokes equations can be recovered in low Mach numbers as follows [41]:
@ui
@t + @uiuj
@xj =
@Pij
@xj + v
@ @xj @ui
@xj +
@uj
@xi + ij
@uk @xk 3v c2 @ @xj ui@P@xjk
k +uj
@Pik
@xk +
@
@xk(uiujuk)
: (14) Therefore, the solution to Lattice Boltzmann equation will lead to continuity and Navier-Stocks solution in low Mach numbers.
In original free energy method, the same relax-ation time parameter is used for both liquid and vapor [42,43]. In this situation, the model cannot cover dierent kinematic viscosity ratios. Therefore, a local relaxation time parameter is introduced to overcome this problem. In this method, 2 dierent relaxation time parameters are dened for liquid and vapor, and local relaxation time parameter is found by a linear interpolation between them as follows [37]:
f= g l
g l ( l) + l: (15)
Subscribes g and l refer to vapor and liquid, respec-tively, and is local density of the ow. By local denition of relaxation parameter, kinematic viscosity can be dierently dened for liquid (l) and vapor
3. Results and discussion 3.1. Interface thickness
Interface thickness is a consequence of the diuse-interface model and its accurate estimation has impor-tant role in valid modeling. Interface thickness of such a gas-liquid system can be theoretically given by [41]:
h = s
2 c
4pc: (16)
In a gas-liquid system, the main physical variable, which distinguishes the phases, is density that grad-ually varies across the interface. To check the validity of the simulation, a planar interface is implemented in a 150 100 grid size for critical properties of pc = 0:125, and pc = 3:5. Using the equilibrium
density prole obtained by the developed diuse-interface model, diuse-interface thickness can be numerically estimated. Dierent cases of g, l, , and are
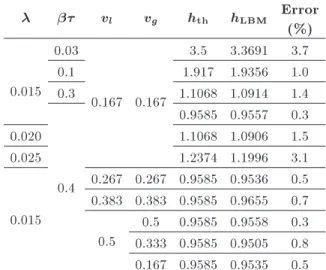
chosen and interface thickness is found theoretically and numerically as shown in Table 1. Also, the eects of bubble radius on the interface thickness are shown in Table 2.
Based on the results of Tables 1 and 2, the developed model can capture the interface thickness precisely and its error is almost negligible.
Table 1. Numerical and theoretical interface thicknesses for planar geometry (pc= 0:125, and c= 3:5).
vl vg hth hLBM Error
(%)
0.015 0.03
0.167 0.167
3.5 3.3691 3.7
0.1 1.917 1.9356 1.0
0.3 1.1068 1.0914 1.4
0.4
0.9585 0.9557 0.3
0.020 1.1068 1.0906 1.5
0.025 1.2374 1.1996 3.1
0.015
0.267 0.267 0.9585 0.9536 0.5 0.383 0.383 0.9585 0.9655 0.7
0.5
0.5 0.9585 0.9558 0.3 0.333 0.9585 0.9505 0.8 0.167 0.9585 0.9535 0.5
3.2. Surface excess energy
Surface excess energy is the concentrated energy at the interface that is interpreted as the surface tension. The expression for the surface excess energy of a van der Waals uid at equilibrium is found to be [50]:
=
1
Z
0
d d
2
d: (17)
Therefore, by the density prole obtained from the diuse-interface model, the excess free energy of the interface can be found numerically.
On the other side, surface excess energy can be theoretically derived by the following formula [41]:
th=43c
q
2()3 pc: (18)
A central bubble is considered in a 150 100 grid size with critical properties of pc = 0:125, and pc = 3:5.
To check the accuracy of the results, theoretical and numerical values of surface excess energy are tabulated for dierent cases of bubble radius and thermophysical properties in Table 3.
Based on the results, the error of numerical sur-face excess energy, in comparison with the theoretical one, is less than 2%, which is almost negligible. 3.3. Grid dependency
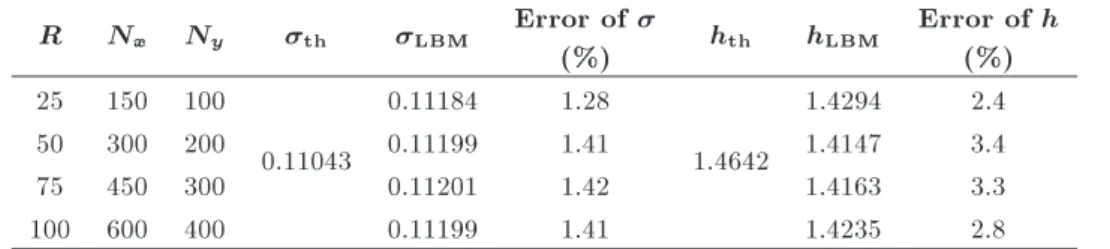
Grid size is dened as a function of the bubble radius (6R 4R). The sizes of the grids used in this analysis are 150 100 (R = 25), 300 200 (R = 50), 450 300 (R = 75), and 600 400 (R = 100). The eects of grid resolution on the surface tension and interface thickness are shown in Table 4.
Based on the results, using the 150 100 grid size would provide reasonable accuracy and avoid high computational costs.
Table 3. Numerical and theoretical surface excess energy (pc= 0:125, and c= 3:5).
R th LBM Error
(%) 25 0.01 0.03 0.00121 0.00120 1.17 30 0.015 0.1 0.00904 0.00906 0.21 35 0.02 0.2 0.02951 0.02977 0.85 40 0.025 0.3 0.06062 0.06141 1.29
Table 2. Numerical and theoretical interface thicknesses for dierent radiuses (pc= 0:125, and c= 3:5).
R vl vg hth hLBM Error
(%) Planar
0.015 0.4 0.167 0.167 0.9585
0.9557 0.3
40 0.9558 0.3
30 0.9655 0.7
Table 4. Eects of grid size on the accuracy of model (pc= 0:125, c= 3:5, = 0:4, and = 0:035).
R Nx Ny th LBM Error of
(%) hth hLBM
Error of h (%) 25 150 100
0.11043
0.11184 1.28
1.4642
1.4294 2.4
50 300 200 0.11199 1.41 1.4147 3.4
75 450 300 0.11201 1.42 1.4163 3.3
100 600 400 0.11199 1.41 1.4235 2.8
3.4. Order of convergence
Order of convergence of the scheme with respect to surface tension can be obtained as follows:
lim
n!1
n+1
n
= : (19)
This means that for large iterations, the surface tension converges to `' with order of convergence of . The value of is called the asymptotic error constant.
For dierent grids in Table 4, the order of conver-gence is found after 3000 iterations as shown in Table 5. Obviously, for all of them, the sequence converges linearly with the order of 1.
3.5. Critical gap of bubble coalescence
In this Section, 2 initially stationary equal-size bubbles with radius of (R) are suspended in static liquid, while the distance between their outer boundaries is (W ). The schematic conguration of the problem is shown in Figure 1.
In the case of small distances between the bubble boundaries, van der Waals attractive forces are in the order that they can move the bubble surfaces toward each other, make a bridge, and cause coalescence as Figure 2 shows. But, if their distance is greater than a critical value{it is named critical gap (Wcr) in this
paper{van der Waals attractive forces are not as big as they can make bubble coalescence. In the following, the eects of dierent parameters on the critical gap of bubble coalescence are investigated.
Figure 1. Schematic conguration of initial conditions of the problem.
Table 5. Order of convergence of the model (pc= 0:125, c= 3:5, = 0:4, and = 0:035).
R Nx Ny Order of
convergence
Asymptotic error constant
25 150 100 1 1
50 300 200 1 1
75 450 300 1 1
100 600 400 1 1
3.5.1. Eects of bubble radius
One parameter that may aect the coalescence process is bubble size. In order to nd the sensibility of critical gap against bubble diameter, the critical gap of coalescence is obtained for dierent radii in the case of pc = 0:125, c = 3:5, = 0:4, and = 0:035. The
critical gap of coalescence is found almost the same for all test cases of dierent radii, with a standard deviation of 1.53%. Therefore, occurrence or non-occurrence of coalescence is independent from bubble radius, and bubble size does not have any inuences on the critical gap of coalescence.
3.5.2. Eects of relaxation time parameter
Relaxation time parameter is a key factor in LBM simulation that also governs kinematic viscosity. By local denition of time relaxation parameter, kinematic viscosity can be dened dierently for liquid and vapor. The critical gap of coalescence is found almost the same for dierent time relaxation parameters (kine-matic viscosity) of gas in the case of constant time relaxation parameter (kinematic viscosity) of liquid with a standard deviation of 0.01%.
In the next step, time relaxation parameter (kinematic viscosity) of gas is xed and critical gap of coalescence is found for dierent values of time relaxation parameter (kinematic viscosity) of liquid. In this case, the standard deviation is 1.3%. Based on the results, critical gap of coalescence is independent of time relaxation parameter. Therefore, kinematic viscosity will not aect the critical gap of coalescence. The independency of results from time relaxation parameter also conrms the accuracy and reliability of LBM model.
Figure 2. A typical coalescence process of initially stationary bubbles.
3.5.3. Eects of capillary coecient and
and are two governing parameters in this simu-lation; they control the interface thickness and surface tension as in Eqs. (16) and (18). Also, the density ratio is governed by as follows:
l
g =
1 +p
1 p: (20)
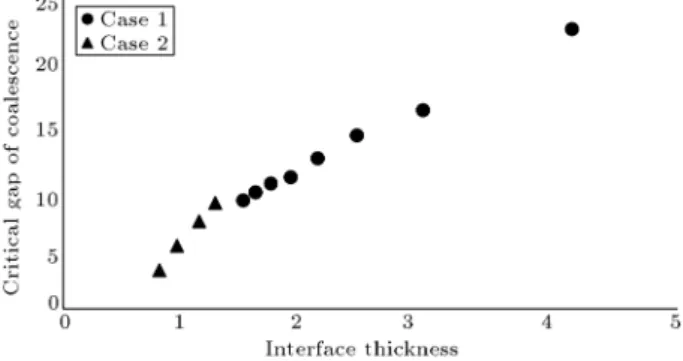
In the rst step, variations of critical gap with in the case of constant are obtained (Case 1). Then, is xed and is changed step by step (Case 2). In these two cases, critical gap of coalescence varies with surface tension and interface thickness. Figure 3 shows the eects of surface tension in Cases 1 and 2. Based on the results, surface tension has an opposite inuence on the critical gap of coalescence in the cases of and variations. Similarly, the eects of interface thickness on the critical gap are plotted in Figure 4.
Critical gap of coalescence increases almost lin-early with interface thickness in both cases of and variations. Here, one can conclude that interface thickness governs the parameter of critical gap of coalescence. To get a better understanding of the problem, interface thickness is xed by variations of and as in Table 6.
In the case of constant interface thickness, crit-ical gap of coalescence is found for dierent surface
Figure 3. Variations of critical gap of bubble coalescence against surface tension in Case 1 ( = 0:035), and Case 2 ( = 0:4).
Figure 4. Variations of critical gap of bubble coalescence against interface thickness in Case 1 ( = 0:035), and Case 2 ( = 0:4).
Table 6. Dierent choices of and with constant interface thickness (pc= 0:125, and c= 3:5).
l=g h
Averaged critical gap ( Wcr) 0.035 0.4 4.44 0.11043
1.4642 8.9 0.03 0.34 3.8 0.08113
0.025 0.29 3.33 0.05634 0.02 0.23 2.84 0.03606 0.015 0.17 2.4 0.02028
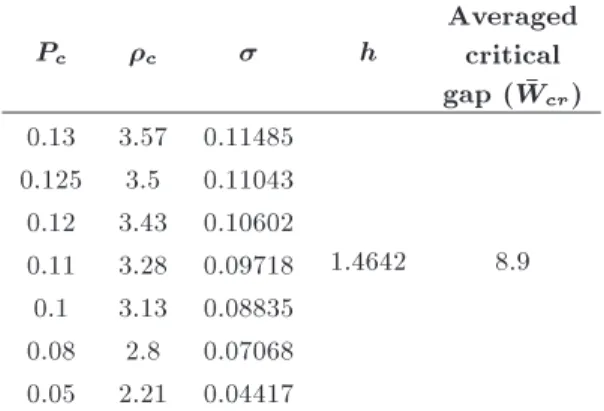
Table 7. Dierent choices of pcand cwith constant interface thickness ( = 0:035 and = 0:4).
Pc c h
Averaged critical gap ( Wcr) 0.13 3.57 0.11485
1.4642 8.9 0.125 3.5 0.11043
0.12 3.43 0.10602 0.11 3.28 0.09718 0.1 3.13 0.08835 0.08 2.8 0.07068 0.05 2.21 0.04417
tensions and standard deviation is calculated at 1.4%. Therefore, critical gap of coalescence is independent of surface tension while it is inuenced by interface thickness.
3.5.4. Eects of critical properties
It is shown that in the case of constant critical pressure and density, interface thickness is the only governing factor of critical gap of coalescence. But, interface thickness also varies with critical properties. Several cases of critical density and pressure are chosen as in Table 7 where the interface thickness is constant.
In this case, the standard deviation is 1.16% and constant interface thickness leads to constant critical gap of coalescence.
3.5.5. Eects of interface thickness
It is concluded that for dierent values of body size, surface tension, density ratio, and kinematic and dynamic viscosity as well as for dierent materials, the critical gap of coalescence is only a function of interface thickness. Therefore, regardless of the other parameters, critical gap of coalescence can be estimated by calculating interface thickness. Critical gap of coalescence has been found for many cases of interface thickness and the results are plotted in Figure 5. Based on the results, critical gap of coalescence has a linear relation with interface thickness.
Figure 5. Variations of critical gap of bubble coalescence against interface thickness.
4. Summary and conclusions
A gas-liquid system was modeled by a diuse-interface free energy LBM. To check the accuracy of the model, interface thickness and surface tension of a single bubble were found where the error was negligible (3Tables 1-3). After a grid resolution analysis, the coalescence stage of foaming process was simulated for 2 initially stationary bubbles and critical gap of coalescence was obtained for them. In the absence of any initial motion of bubbles or bulk liquid, when the bubbles were not in contact, but were very close, they coalesced. Actually, when the gap between their outer boundaries was less than a critical gap, their surfaces were attracted to each other to shape a bridge, which grew and caused coalescence as in Figure 2. The critical gap of coalescence was a useful parameter that helped us to determine the least distance between the bubbles to avoid coalescence. Sensibility of this critical gap was evaluated with respect to many parameters such as critical properties of the material, density ratio, kinematic viscosity of liquid and vapor, bubble radius, surface tension, temperature, and interface thickness. The results showed that critical gap of coalescence was only a function of interface thickness as shown in Figure 5. In fact, for dierent materials with various radii and thermophysical properties, if the interface thickness was calculated precisely, the critical gap of coalescence could be estimated.
References
1. Malekjafarian, M. and Sadrnezhaad, S.K. \Eect of SiC on microstructural features and compressive prop-erties of aluminum foam", Scientia Iranica, 21(4), pp. 1325-1329 (2014).
2. Latizadeh, H. \An analytical method to analysis of foam drainage problem", International Journal of Mathematical Sciences, 7(1), (2013).
3. Feng, J.J. and Bertelo, C.A. \Prediction of bubble growth and size distribution in polymer foaming based on a new heterogeneous nucleation model", J. Rheol., 48, pp. 439-462 (2004).
4. Hilgenfeldt, S., Koehler, S.A., and Stone, H.A. \Dy-namics of coarsening foams: Accelerated and self-limiting drainage", Phys. Rev. Lett., 86(20), pp. 4704-4707 (2001).
5. Sandler, J., Wollecke, F., Altstadt, V., Wettstein, E., and Rakutt, D. \Principal correlation of pvc melt elongational properties with foam cell morphology", Cellular Polym., 19, pp. 371-388 (2000).
6. Sha, M.A. and Flumerfelt, R.W. \Initial bubble growth in polymer foam processes", Chem. Eng. Sci., 52, pp. 627-633 (1997).
7. Ramesh, N.S., Rasmussen, D.H., and Campbell, G.A. \The heterogeneous nucleation of microcellular foams assisted by the survival of microvoids in polymers containing low glass transition particles. Part i: math-ematical modeling and numerical simulation", Polym. Eng. Sci., 34, pp. 1685-1696 (1994).
8. Arefmanesh, A., Advani, S.G., and Michaelides, E.E. \A numerical study of bubble growth during low pressure structural foam molding process", Polymer Eng. Sci., 30, pp. 1330-1337 (1990).
9. Paulsen, J.D., Carmigniani, R., Kannan, A., Burton, J.C., and Nagel, S.R. \Coalescence of bubbles and drops in an outer uid", Nat. Commun., 5(3182) (2014). Doi: 10.1038/ncomms4182.
10. Paulsen, J.D. \Approach and coalescence of liquid drops in air", Phys. Rev. E., 88, 063010 (2013).
11. Paulsen, J.D., Burton, J.C., Nagel, S.R., Appathurai, S., Harris, M.T., and Basaran, O.A. \The inexorable resistance of inertia determines the initial regime of drop coalescence", Proc. Natl. Acad. Sci. USA., 109, pp. 6857-6861 (2012).
12. Paulsen, J.D., Burton J.C., and Nagel, S.R. \Viscous to inertial crossover in liquid drop coalescence", Phys. Rev. Lett., 106, 114501 (2011).
13. Baroudi, L., Kawaji, M., and Lee T. \Eects of initial conditions on the simulation of inertial coalescence of two drops", Comp. Math. Appl., 67, pp. 282-289 (2013).
14. Sprittles, J.E. and Shikhmurzaev, Y.D. \Coalescence of liquid drops: Dierent models versus experiment", Phys. Fluids, 24, 122105 (2012).
15. Czerski, H. \A candidate mechanism for exciting sound during bubble coalescence", J. Acoust. Soc. Am., 129, EL83-EL88 (2011).
16. Case, S.C. \Coalescence of low-viscosity uids in air", Phys. Rev. E., 79, 026307 (2009).
17. Case, S.C. and Nagel, S.R. \Coalescence in low-viscosity liquids", Phys. Rev. Lett., 100, 084503 (2008).
18. Fezzaa, K., and Wang, Y. \Ultrafast x-ray phase-contrast imaging of the initial coalescence phase of two water droplets.", Phys. Rev. Lett., 100, 104501 (2008).
19. Giribabu, K. and Ghosh, P. \Binary coalescence of air bubbles in viscous liquids in presence of non-ionic surfactant", Can. J. Chem. Eng., 86, pp. 643-650 (2008).
20. Gilet, T., Mulleners, K., Lecomte, J.P., Vandewalle, N., and Dorbolo, S. \Critical parameters for the partial coalescence of a droplet", Phys. Rev. E., 75, 036303 (2007).
21. Aarts, D.G.A.L., Lekkerkerker, H.N.W., Guo, H., Wegdam, G.H., and Bonn, D. \Hydrodynamics of droplet coalescence", Phys. Rev. Lett., 95, 164503 (2005).
22. Thoroddsen, S.T., Takehara, K., and Etoh, T.G. \The coalescence speed of a pendent and a sessile drop", J. Fluid Mech., 527, pp. 85-114 (2005).
23. Wu, M., Cubaud T., and Ho, C.M. \Scaling law in liquid drop coalescence driven by surface tension", Phys. Fluids, 16, L51-L54 (2004).
24. Duchemin, L., Eggers, J., and Josserand, C. \Inviscid coalescence of drops", J. Fluid Mech., 487, pp. 167-178 (2003).
25. Ghosh, P. and Juve kar, V.A. \Analysis of the drop rest phenomenon", Chem. Eng. Res. Design, 80(7), pp. 715-728 (2002).
26. Eggers, J., Lister, J.R., and Stone, H.A. \Coalescence of liquid drops", J. Fluid Mech., 401, pp. 293-310 (1999).
27. Amaya-Bower, L. and Lee, T. \Single bubble rising dynamics for moderate Reynolds number using lattice Boltzmann method", Computers & Fluids, 39(7), pp. 1191-1207 (2010).
28. Stover, L.R., Tobias, C.W., and Denn, M.M. \Bubble coalescence dynamics", AIChE Journal, 43, pp. 2385-2392 (1997).
29. Egan, E.W. and Tobias, C.W. \Measurement of in-terfacial re-equilibration during hydrogen bubble co-alescence", J. Electrochem. Soc., 141, pp. 1118-1126 (1994).
30. Chaudhari, R.V. and Hofmann, H. \Coalescence of gas bubbles in liquids", Rev. Chem. Eng., 10, pp. 131-191 (1994).
31. Oolman, T.O. and Blanch, H.W. \Bubble coalescence in stagnant liquids", Chem. Eng. Commun., 43, pp. 237-261 (1986).
32. Hirt, C.W. and Nichols, B.D. \Volume of uid (VOF) method for the dynamics of free boundaries", J. Comp. Phys., 39, pp. 201-225 (1982).
33. Bhaga, D. and Weber, M.E. \In-line interaction of a pair of bubbles in a viscous liquid", Chem. Eng. Sci., 35, pp. 2467-2474 (1980).
34. Narayanan, S., Goossens, H.J. and Kossen, N.W.F. \Coalescence of two bubbles rising in line at low Reynolds numbers", Chem. Eng. Sci., 29, pp. 2071-2082 (1974).
35. Amiri Rad, E. \Evaluation the radius dependency of surface tension in nano-droplets by a diuse-interface lattice boltzmann", Progress in Computational Fluid Dynamics An International Journal, 17(4), pp. 232-238 (2017).
36. Amiri Rad, E. and Salimi, M. \Investigating the eects of shear rate on the collapse time in a gas-liquid system by lattice Boltzmann", Meccanica, 52(4-5), pp. 915-924 (2016)
37. Amiri Rad, E. \Control of droplet collapse during coarsening process by imposing shear ow: A lattice Boltzmann simulation", Meccanica, 50(4), pp. 995-1001 (2015).
38. Amiri Rad, E. \Investigation the eects of shear rate on stationary droplets coalescence by lattice Boltz-mann", Meccanica, 49(6), pp. 1457-1467 (2014).
39. Amiri Rad, E. \Coalescence of two at-rest equal-sized drops in static vapor of the same material: A lattice Boltzmann approach", J. Mech. Sci. Technol., 28(9), pp. 3597-3603 (2014).
40. Dupuis, A. and Yeomans, J.M. \Modeling droplets on superhydrophobic surfaces: equilibrium states and transitions", Langmuir., 21, pp. 2624-2629 (2005).
41. Briant, A.J., Wagner, A.J., and Yeomans, J.M. \Lat-tice Boltzmann simulations of contact line motion. I. Liquid-gas systems", Phys. Rev. E., 69, 031602 (2004).
42. Swift, M.R., Osborn, W.R., and Yeomans, J.M. \Lat-tice Boltzmann simulation of nonideal uids", Phys. Rev. Lett., 75, pp. 830-833 (1995).
43. Swift, M.R., Orlandini, E., Osborn, W.R., and Yeo-mans, J.M. \Lattice Boltzmann simulations of liquid-gas and binary uid systems.", Phys. Rev. E., 54, pp. 5041-5052 (1996).
44. Hou, S., Zou, Q., Chen, S., Doolen, G. and Cogley, A.C. \Simulation of cavity ow by the lattice Boltz-mann method", J. Comput. Phys., 118, pp. 329-347 (1995).
45. Shan, X. and Chen, H. \Simulation of nonideal gases and liquid-gas phase transitions by the lattice Boltz-mann equation", Phys. Rev. E., 49, pp. 2941-2948 (1994).
46. Succi, S. \The Lattice Boltzmann Equation for Fluid Dynamics and Beyond", Oxford University Press (2001).
47. Holdych, D.J., Rovas, D., Georgiadis, J.G. and Buck-ius, R.O. \An improved hydrodynamics formulation for multiphase ow lattice-Boltzmann models", Int. J. Mod. Phys., C9, pp. 1393-1404 (1998).
48. Evans, R. \The nature of the liquid-vapour interface and other topics in the statistical mechanics of non-uniform, classical uids", Adv. Phys., 28, pp. 143-200 (1979).
49. Landau, L.D. and Lifshitz, E.M. Statistical Physics, Pergamon Press (1958).
50. Jamet, D., Torres, D. and Brackbill, J.U. \On the theory and computation of surface tension: The elim-ination of parasitic currents through energy conser-vation in the second-gradient method", Journal of Computational Physics, 182, pp. 262-276 (2002).
Biography
Ehsan Amiri Rad received the BSc degree in Me-chanical Engineering from Iran University of Science and Technology in 2005. Then, he received MSc degree in 2007 and PhD degree in 2011, in Energy Conversion, from Ferdowsi University of Mashhad, Iran. Currently, he is an Assistant Professor at Hakim Sabzevari Univer-sity. He has published more than 30 papers in journals and international conference proceedings.