ANNUAL ENERGY OUTLOOK’S SOLAR PROJECTIONS TRUMPED: RESIDENTIAL PHOTOVOLTAIC PROJECTIONS TO 2040
By
Jocelyn H. Keung
Honors Thesis
Curriculum for the Environment and Ecology University of North Carolina at Chapel Hill
April 29, 2015
Approved:
ABSTRACT
Jocelyn H. Keung: Annual Energy Outlook’s Solar Projections Trumped: Residential Photovoltaic Projections to 2040
(Under the direction of Dr. David N. McNelis)
The most recent Annual Energy Outlook (AEO) published by the United States Energy Information Administration projects key parameters in the energy system, such as energy production and consumption, through 2040. In this study, solar energy projections for the AEO 2014 reference case are scrutinized and hypothesized to underestimate the expected growth in residential solar applications. The impacts of state-of-the-art
TABLE OF CONTENTS
LIST OF TABLES ... vi
LIST OF FIGURES ... vii
LIST OF ABBREVIATIONS ... viii
CHAPTER 1: INTRODUCTION ... 1
Introduction ... 1
Basics of Solar Energy ... 2
Financing Solar Energy ... 3
Solar Energy in North Carolina ... 7
Sustainability of Photovoltaic Cells ... 7
Annual Energy Outlook ... 8
Project Overview ... 10
CHAPTER 2: METHODOLOGY ... 11
Introduction ... 11
AEO 2014 Reference Case Baseline ... 11
Technology Selection ... 16
Assumptions ... 24
Conversion Efficiency Estimate Justifications ... 29
CHAPTER 3: RESULTS ... 31
Timeline of Anticipated Events ... 31
CHAPTER 4: CONCLUSIONS ... 35
Introduction ... 35
Discussion ... 35
Future Work ... 38
Technological Advances ... 39
LIST OF TABLES
LIST OF FIGURES
Figure 1 – U.S. electricity generation by fuel in the reference case in trillion
kWh 1990-2040 ... 10 Figure 2 – Total renewable electricity generation over all types in the reference
case, 2000-2040 ... 13 Figure 3 – Equipment cost in reference case, 2012-2040 ... 14 Figure 4 – Residential distributed generation capacity in three cases, 2009-2040 ... 14 Figure 5 – Projected growth in non-marketed residential solar PV in two cases,
2011-2040 ... 15 Figure 6 – NREL best research-cell efficiencies ... 23 Figure 7 – The falling price of utility-scale solar PV projects ... 26 Figure 8 – Production, laboratory, and theoretical maximum PV module efficiencies for
LIST OF ABBREVIATIONS
AC Alternating Current AEO Annual Energy Outlook
BAPV Building Applied Photovoltaics BIPV Building Integrated Photovoltaics c-Si Monocrystalline Silicon
CdTe Cadmium Telluride
CIGS Copper Indium Gallium Diselenide
DC Direct Current
DOE Department of Energy
EIA Energy Information Administration
HIT Heterostructures With Intrinsic Thin Layer kWh Kilowatt-hours
LEED Leadership in Energy and Environmental Design NREL National Renewable Energy Laboratory
PV Photovoltaic
CHAPTER 1: INTRODUCTION Introduction
Rising prices, diminishing resources, and pollution emissions from traditional fossil energy sources have spurred interest in renewable energy in recent years (Saadatian et al. 2013). Renewable energy generation is anticipated to increase significantly as these
technologies continue to improve and evolve rapidly. A recent study by the National Renewable Energy Laboratory (NREL) suggests that existing renewable energy
technologies are more than adequate to supply 80% of the nation’s electricity generation in 2050 (2012). Solar energy is particularly promising and boasts many advantages over both fossil-fuel based energy sources and other forms of renewable energy, such as wind, hydropower, and biomass (Wheeland 2014).
Solar energy has many benefits that make it a promising solution to global energy needs. Solar energy is abundant, renewable, versatile, and sustainable. The Earth receives 120,000 TW of solar insolation each day to its surface, which is about 20,000 times more power than the global energy demand (Maehlum 2014a). That is, the sun provides
as much insolation on an annual basis as Alaska, yet has the largest market for solar panels (NREL 2011; Wheeland 2014). Further, solar energy does not cause pollution beyond the manufacturing, transportation, and installation processes, which are minimal compared to traditional energy sources (Maehlum 2014a). Photovoltaics are silent and do not require substantial maintenance. In addition, solar energy is becoming increasingly cost-competitive with traditional energy sources, which further adds to its appeal to homeowners, businesses, and industry.
For these reasons, solar energy has the potential to supply a significant amount of the global energy demand. Indeed, solar energy leads the growth of renewable energy technologies, and photovoltaic technologies are projected to experience significant cost and performance improvements over the next thirty-five years (EIA 2014).
This chapter provides background information on solar energy technology and the U.S. Energy Information Administration’s (EIA) Annual Energy Outlook (AEO) 2014 report. In addition, the goals and scope of this study are introduced.
Basics of Solar Energy
Solar modules are typically made of monocrystalline or polycrystalline silicon, amorphous silicon, cadmium telluride (CdTe), or copper indium gallium deselenide (CIGS) (Pavlovic et al. 2011). Crystalline silicon cells are the most common solar technology and constituted about 85% of the PV market in 2011 (U.S. DOE 2012).
Solar cells produce direct current (DC) electricity, so this electricity is typically converted back to alternating current (AC) using an inverter for compatibility with electrical appliances in homes the United States. Peak conversion efficiencies between direct and alternating currents for solar cells are above 90% (Lalonde 2011).
PV system costs can generally be categorized into three components: PV modules, balance of system (BOS), and power electronics (U.S. DOE 2012). Power electronics, which include the inverter and the transformer, are necessary to convert the electricity from direct to alternating current (U.S. DOE 2012). BOS refers to the
remaining expenses, such as installation, land, fees, and other hardware (U.S. DOE 2012).
Financing Solar Energy
The costs of PV systems are steadily decreasing. Since 2010, the average price of a solar panel has decreased by 64% (SEIA 2014b). Residential PV installations dropped to $3.92/watt in the second quarter of 2014, which is a 41% price drop since 2010 (SEIA 2014b).
United States, the number of programs in each state ranges from 11 (West Virginia) to 202 (California) (DSIRE 2015). In North Carolina, there are currently 115 different solar incentive programs (DSIRE 2015). Some of these programs are discussed below.
The NC Renewable Energy Tax Credit is applicable to the commercial, industrial, agricultural, and residential sectors and applies to renewable energy property that is constructed/leased/purchased and placed into service in North Carolina. Eligible
expenditures include equipment, construction, and installation costs (DSIRE 2015). The tax credit covers 35% of the property up to $10,500 per non-business installation and lasts through December 31, 2015 (DSIRE 2015). This credit covers a maximum of $2.5 million per installation of solar systems for business uses and a maximum of $5 million for business systems installed at eco-industrial certified parks (DSIRE 2015). Renewable energy systems that sell generated energy or use it on-site for a purpose other than providing energy to a residence are classified as business systems.
In addition to these tax credits, there are many other local programs that provide financial incentives for both residential and commercial photovoltaic systems such as building permit fee waivers or special loan financing plans.
Net metering, or the process by which PV system owners can offset their utility bills by contributing electricity to the grid, is another incentive to install photovoltaic systems. Electricity utility customers pay for the net electricity used during a billing period, after factoring in any excess generation output to the grid (SEIA 2014d). Net metering is applicable to distributed generation customers such as homes and businesses (SEIA 2014d). These performance-based incentives are offered to solar energy systems that are connected to the grid and can make PV systems effective or even cost-beneficial. Individual PV systems can offset the peak demand during the middle of the day, which is when the systems generate the most electricity (SEIA 2014d). Further, because grid-connected PV systems deliver energy locally, they can reduce transmission costs and efficiency losses from the transport of electricity (SEIA 2014d). However, only a small fraction of distributed generation PV customers participate in net metering programs (SEIA 2014d). Net metering programs are specific to utility companies.
By the NC GreenPower Production Incentive, grid-tied solar energy systems 5 kW or smaller can benefit from power-purchase agreements with their utility providers and the GreenPower organization (DSIRE 2015). The current program awards
for small systems under 10 kW. This program is not applicable to customers who choose to net meter (DSIRE 2015).
Duke Energy Progress offers incentives to residential customers to install PV systems. Through the SunSense program, customers receive $500 for each kilowatt-AC that is installed and earn monthly credits on their utility bill for $4.50 per kW-AC up to a 10 kW-AC system (DSIRE 2015). Solar systems must be net metered and grid tied (DSIRE 2015). In return, customers surrender their Renewable Energy Credits (RECs) to Duke Energy Progress.
PV systems in North Carolina have an exemption from property tax (DSIRE 2015). Residential systems that are not used to generate income or in connection with a business may be entirely exempt while all other systems are 80% exempt (DSIRE 2015). Further, residential customers that meet Energy Star home standards can receive
discounts on their natural gas utility bill (DSIRE 2015). Customers that meet the stated building efficiency requirements are entitled to a $0.05/therm discount on their gas utility rates (DSIRE 2015). PV systems are one way to increase building efficiency and meet these standards.
contracts typically last for 15-20 years, and at the end of the lease homeowners can purchase the system at a reduced price or have the system removed (NREL 2014b).
System size 4 kW
System price bid $16,000
Federal tax credit return to solar lessor $4,800
Monthly solar lease payments by homeowner
$88 Homeowner’s historical monthly electric
bill
$147
Homeowner’s monthly savings $59
Lease term 15 years
What happens at end of lease? Homeowner can purchase PV system at a depreciated value or have it removed Table 1.1 An example of solar lease costs (NREL 2014b). Data is representative as of January 2014. This example assumes the 4 kW system produces all electric power used by the homeowner (NREL 2014b). This data in this table is taken from NREL.
Solar Energy in North Carolina
North Carolina solar installations have grown rapidly in recent years, with aid from the state’s renewable energy and energy efficiency portfolio standards (SEIA 2014c). In 2013, North Carolina installed 335 MW of solar electricity capacity—ranking it third in the United States behind California (2,621 MW) and Arizona (421 MW) (Four Peaks Technology, Inc. 2014; SEIA 2014c). Overall, North Carolina ranks fourth in the country for installed solar capacity with more than 627 MW installed (SEIA 2014c). Sustainability of Photovoltaic Cells
Manufacturing location influences energy input, pollution emissions, and
additional costs from transportation. For example, solar panels produced in Europe have a lower overall carbon footprint and require less energy to manufacture than those made in China (Yue et. al 2014; Lerner 2014). China has less stringent environmental standards for its factories, which currently rely predominantly on coal and other non-renewable sources for electricity (Yue et. al 2014). Outsourcing the production of solar panels introduces transport, emissions, and energy expenses (Lerner 2014). The most sustainable approach to increasing adoption of photovoltaics in the United States, despite cost
factors, is to domestically manufacture the solar panels.
Silicon is one of the primary materials used in solar panels. Silicon is the second most abundant element in the earth’s crust (Pavlovic et al. 2011). Silicon is non-toxic and is easily attained and processed. There are two native types of silicon—crystalline and amorphous. Amorphous silicon solar cells require just 1% of the silicon used in crystalline silicon cells, but have low electrical output. (Maehlum 2013c). Crystalline silicon supplies are virtually unconstrained, especially when alternatives to silver are considered for contact materials (U.S. DOE 2012). Thus, the majority of solar panels currently produced use crystalline silicon (Maehlum 2013c).
Annual Energy Outlook
The AEO 2014 published by the Energy Information Administration (EIA) of the U.S. Department of Energy provides projections of various forms of energy production and consumption to 2040. The AEO estimates encapsulate known technology,
oil prices, and policy decisions are considered. The AEO report considers five cases: a reference case, low and high economic growth cases, and low and high oil price cases.
Fig 1. U.S. electricity generation by fuel in the reference case in trillion kilowatt-hours, 1990-2040 (EIA 2014).Figure ES-5 in the AEO 2014 Report.
Renewable energy generation projections are sensitive to policies that affect financial incentives for the adoption of renewable energy technologies, the costs of competing energy sources, macroeconomic conditions that affect electricity demand, and the cost and performance of renewable technologies (EIA 2014). In the AEO 2014, federal, state, and local regulations in effect as of the end of October 2013 were used in the policy-neutral baseline model projections. In general, existing laws and regulations remain unchanged throughout the projection period, except in cases where policies have sunset dates or specified changes in the future.
Project Overview
The scope of this report is on residential photovoltaic solar technologies. This research seeks to address two questions:
(1) What sustainable technological improvements are reasonably anticipated and how will they influence long-term (through 2040) installation activity and price trends of photovoltaics in the residential sector of the United States? This analysis will consider conversion efficiency, price, energy storage capacity, aesthetics, and material criteria.
CHAPTER 2: METHODOLOGY Introduction
This analysis considers reasonable projections of disruptive changes in technology, materials science, laws, and macroeconomic growth, all of which will provide a more insightful look into the future of solar energy. The 'business-as-usual’ reference case of the AEO 2014 report will serve as the baseline. The hypothesis of this investigation is that the reference case is an overly conservative estimate and this analysis seeks to provide evidence that suggests more optimistic projections.
The AEO 2014 reference case projections for solar energy generation are
presented in this section. Solar technologies are evaluated on feasibility and potential for sustainable development on a large scale at high efficiency and low cost. After consulting literature and research to narrow this investigation’s technology selection, the growth and evolution of these solar technologies are reasonably anticipated over time. The influence of module price, BOS costs, system efficiencies, and system size is considered. This investigation’s solar electricity generation projections through 2040 are dependent on discrete events, such as the introduction of a new technology or the sunset of an incentive policy.
AEO 2014 Reference Case Baseline
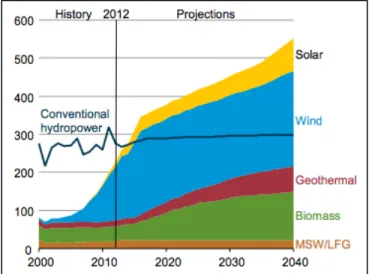
2012 (EIA 2014). Of renewable technologies, solar energy is the fastest-growing generation source and increases by approximately 7.5%/year (EIA 2014). This
corresponds to an increase from less than 8 GW of renewable capacity in 2012 to greater than 48 GW in 2040 (EIA 2014).
Fig 2. Total renewable electricity generation over all types in the reference case, 2000-2040 (EIA 2014). This graphic from the AEO 2014 publication shows the total renewable electricity generation in units of billion kWh. Solar is projected to be fastest-growing renewable source over this projection period.
The AEO 2014 reference case for residential PV systems assumptions from 2012 to 2040 are as follows:
(1) Average system capacity, in kilowatts-DC, start at 4kW in 2012, increases to 4.5kW in 2016, and increases once more to 5kW in 2020 where it remains for the rest of the projection period (EIA 2014).
(3) The 30% federal tax credit is present through 2016 and then goes away for the remainder of the period (EIA 2014).
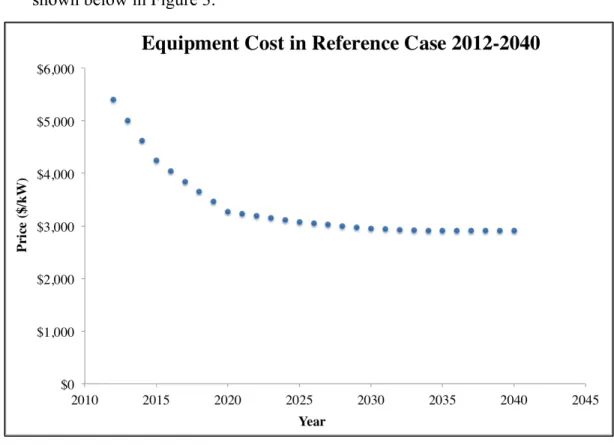
(4) Equipment cost, in dollars per kilowatt, falls significantly from $5,399 at the beginning of this period to $2907 in 2035 and beyond (EIA 2014). This trend is shown below in Figure 3.
Fig 3. Equipment cost in reference case, 2012-2040 (EIA 2014). PV system cost decreases rapidly in the first decade and remains relatively constant for the remainder of the projection period.
(5) Equipment life, excluding the inverter, is 30 years and is constant throughout the projection. Inverter life increases gradually from 10 years in 2012 to 15 years in 2020 (EIA 2014).
(7) Annual system maintenance cost decreases incrementally from $21 in 2012 to $17 in 2021 and beyond (EIA 2014). The inverter cost begins at $697 in 2012 and decreases by a few dollars each year until it reaches $681 in 2020, where it remains until the end of the period (EIA 2014).
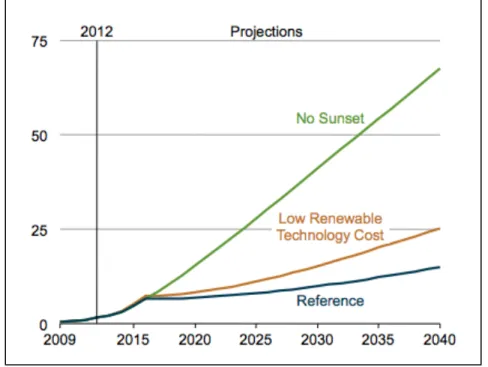
Fig 4. Residential distributed generation capacity in three cases, 2009-2040
(gigawatts) (EIA 2014). Electricity generation from distributed renewable energy systems is considered in the no sunset, low renewable technology cost, and reference scenarios of the AEO 2014 report.
Generation capacity from residential PV systems doubles from 2010 to 2012 and again in both 2014 and 2016 (EIA 2014). However, in both the low renewable technology cost and reference cases, growth slows drastically due to the planned expiration of the federal tax credit after 2016 (EIA 2014). The no sunset scenario demonstrates the
The low renewable technology cost scenario in the AEO 2014 considers an
additional 20% reduction in installed costs after 2013 from the reference case projections. Other factors, such as the maintenance and inverter costs, conversion efficiencies, loss factors, system size, and equipment life remain unchanged in this alternative scenario (EIA 2014). As expected, the low renewable technology cost scenario results in increased installed capacity of PV systems for electricity generation in the AEO 2014 (EIA). In 2040, the reference case estimates 0.22 quadrillion Btu of non-marketed residential PV consumption and the low renewable technology cost scenario estimates 0.37 quadrillion Btu (EIA 2014). The 20% reduction in installed costs in the low cost scenario
corresponded to about a 68% increase in distributed capacity.
Fig 5. Projected growth in non-marketed residential solar PV in two cases, 2011-2040 (EIA 2014). This graphic from the AEO 2014 report shows the growth of
data includes selected non-marketed residential consumption for which the energy is not bought or sold as an input to marketed energy (EIA 2014). Growth slows significantly beginning in 2016 due to the retirement of the federal investment tax credit. In 2040, generation is about 0.22 quadrillion Btu in the reference case and 0.37 quadrillion Btu in the alternative scenario. The average growth rates between 2012 and 2040 in the
reference and low cost scenarios were 8.3% and 10.3%, respectively (EIA 2014). Technology Selection
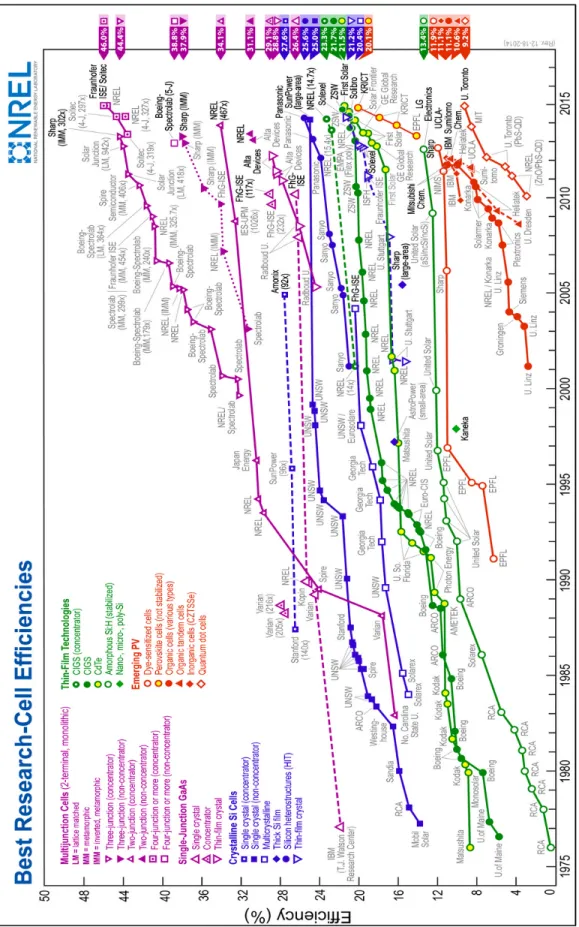
In this analysis, a few of the most promising photovoltaic technologies are selected on the basis of projected applicability to residential systems, sustainability, recent developments, and improvements in conversion efficiencies. Current conversion efficiency and development data are extracted from NREL’s most recent chart of best research-cell efficiencies (2015).
Multijunction cells yield the highest conversion efficiencies to date, but they are best suited for large-scale application and thus, have limited utility for residential applications (Maas 2012). Triple- and quadruple- junction based solar cells outperform all other technologies at 44.7% conversion efficiency of sunlight into electricity in the laboratory and about 30% industrial efficiencies (Bett et al. 2013). However, the cost per Watt and the cost of power per weight are both relatively high for multijunction cells, so they are usually only cost-effective within high-concentrating systems (Bett et al. 2013). Concentrating lenses, mirrors, and tracking systems add significant costs; multijunction solar cells have impressive conversion efficiencies but may never be cost-effective for residential use (Maas 2012). Rather, multijunction cells are optimal for large, sunny areas where many solar cells and concentrators can be installed (Maas 2012). For these
Crystalline Si cells have the next highest conversion efficiencies below
multijunction cells. More than 85% of currently installed photovoltaics are made from crystalline silicon (Bulkin 2014). There are many types of crystalline Si solar cells, which include single crystal (monocrystalline), multicrystalline (polycrystalline), thick Si film, silicon heterostructures with intrinsic thin layer (HIT), and thin-film crystal. Of these, thick Si film has the lowest conversion efficiency (~15%) and has not seen any recent developments so this technology is excluded from further analysis. Similarly,
polycrystalline Si cells are excluded due to relatively low conversion efficiency and lack of apparent development since 2004. The single crystal (non-concentrator), silicon HIT, and thin-film crystal have the highest current efficiencies in this category at 25.0%, 25.6%, and 21.2%, respectively. Monocrystalline solar cells have a long lifetime (typically about 25 years) and tend to have higher efficiencies than other common solar panels because of the high-grade silicon input, but also tend to be more expensive than polycrystalline and thin film solar cells (Maehlum 2013c). Silicon HIT solar cells have a lot of potential to be developed on an industrial scale at even higher efficiencies (De Wolf et al. 2012). Crystalline silicon solar cells are well established and are expected to contribute significantly to the future growth of photovoltaics. Global silicon-based photovoltaic sales are expected to reach 50 GW (roughly 50 large power plants) by 2020, compared to about 13 GW today (BASF 2014).
Thin film modules have unique properties that can make them more appealing than crystalline silicon solar cells under certain conditions. Thin film cells can withstand high temperatures, and the impact of shade on panel performance is relatively low
the backing can potentially be made with more malleable materials such as foil or plastic (Noorden 2014). This allows for a plethora of innovations and new applications
(Maehlum 2013c). In addition, thin film modules are easy to mass-produce, which can make them a cheaper option than crystalline silicon solar cells (Maehlum 2013c). Rather than building traditional modules from wafers of pure silicon, thin film technology can utilize impure materials in much smaller amounts (Noorden 2014).
There are three technologies that currently dominate the thin film market, which include amorphous silicon (a-Si), cadmium telluride (CdTe), and copper indium gallium selenide (CIGS) (Maehlum 2014b). CdTe modules have relatively low manufacturing costs but contain cadmium, which is a highly toxic heavy metal (Maehlum 2014b). Cadmium is a potential carcinogen, so disposal and recycling of CdTe cells can be costly and hazardous (Maehlum 2014b). CIGS modules have high efficiency but require
expensive processing; CIGS-based solar panels hold the record efficiency within thin film technologies at 21.7% (research-cell) and 14.5% (solar module) (NREL Chart 2014; Maehlum 2014b). One benefit of CIGS solar cells is that they contain less cadmium than CdTe cells (Maehlum 2014b). Amorphous silicon cells have low efficiency and the equipment is expensive; this technology is best suited for small devices such as calculators (Maehlum 2014b).
than crystalline-based solar panels (Maehlum 2013c). For these reasons, homeowners generally find crystalline-based photovoltaics to be a better option than thin film, although thin film solar cells can potentially be a cheaper alternative. There is currently low market availability of thin film solar cells for residential applications (Maehlum 2013b). However, thin film technologies are included in this analysis because there are potential building-integrated applications that can greatly increase PV installations.
Building efficiency standards are becoming more stringent, which can increase incentives to install more building integrated PV (BIPV) or PV in general. Some of the current barriers to adopting BIPV systems are legal planning restrictions, lack of BIPV-specific building standards, and higher costs relative to non-BIPV technology
which is anticipated to grow to a $23 billion market by 2021 (Allen 2014). Recent discoveries and improvements in the flexible and versatile properties of thin film solar materials enable innovation that has the potential to revolutionize photovoltaic
applications.
Conventional CIGS technology requires a large amount of heat input to extract silicon from rocks (Eischeid 2013). Indium, gallium, and selenium are rare minerals; indium will be depleted within a decade if current rates of production continue (Eischeid 2013). One alternative to these materials is copper, zinc, tin, and sulphur (CZTS) cells because copper, zinc, and sulphur are relatively abundant. An additional benefit is that these materials require less processing and thus are cheaper to manufacture although CZTS cells tend to have lower efficiencies (about 11%, compared to about 15% for conventional panels) (Eischeid 2013).
abundant, but have low conversion efficiencies below 10%. Thus, there is a lot of incentive to improve the efficiencies of organic PV cells.
Perovskite solar cells are a new, but promising, technology that has seen accelerated growth. Perovskite refers to a mineral crystal structure, which is usually a calcium trioxide mineral (Bulkin 2014). The first perovskite materials were used in solar cells in 2009, and have since undergone a series of improvements in efficiency and sustainability (Bulkin 2014). In April 2014, the efficiencies of perovskite solar cells were about 16% (NREL 2014a). This sharp increase in efficiency is particularly impressive given the short development period; in 2009 the efficiencies were less than 4% (NREL 2014a). Optimistic predictions suggest that these efficiencies could hit 50% and costs can be much lower than silicon cells in the future (Bulkin 2014). Perovskite minerals are unique because they can be manipulated to be compatible for multi-junction solar cells, which have exceptionally high efficiencies (NREL 2014a). Multi-junction cells currently have high material costs, so the introduction of cheaper perovskite minerals may enable a wider adoption of multi-junction solar cells (NREL 2014a).
Current research involves applying other technological improvements to
Quantum dots are semiconducting nanocrystals that utilize the laws of quantum mechanics (Borghino 2014). The current research cell efficiency is 9.2%, but research and development of this technology is moving at a fast pace (NREL Chart 2014).
Quantum dot technology is believed to have the potential to overtake silicon cells or even create high-efficiency spray-on solar cells (Borghino 2014). One major benefit of
quantum dots is the ability to manipulate the band gap such that the cell can absorb different parts of the solar spectrum that are currently underutilized (Borghino 2014). About half of the sun’s incoming energy is in the form of infrared radiation, so this spectrum manipulation can be a significant asset (Borghino 2014). Quantum dots have a proposed theoretical conversion efficiency limit of 45% and are relatively cheap to manufacture because they are less sensitive to temperature conditions than existing technologies (Johnson 2014).
We will consider non-concentrating monocrystalline, silicon heterostructure, thin film CIGS, thin film CdTe, perovskite, organic solar cells, and quantum dots in this analysis.
Assumptions
This analysis focuses on the growth of solar technologies largely as a result of innovation and research. Although there are many other political, economic, and social factors that influence the adoption and generating capacity of these renewable
technologies, they are beyond the scope of this particular investigation. Many of these factors, such as the growth in electricity demand or the fluctuation in natural gas prices, are considered within the AEO 2014 reference case projections (EIA 2014). Indeed, projected generation of renewable systems in the AEO 2014 report is sensitive to the existence of financial incentive policies, the prices of competing energy sources, and macroeconomic conditions (EIA 2014). Thus, these influences are reflected in this investigation’s estimations through the utilization of the reference case as the baseline case; this analysis’ predictions will fall at or above this line. The cost and performance assumptions used in the AEO 2014 are isolated, and the impact of recent innovation and development on these factors are reasonably approximated. The economic
competitiveness of photovoltaic technologies is a key driver of increasing solar electricity generation.
The assumptions held in this analysis’ projections are as follows:
(1) Climate change and greenhouse gas emissions are not anticipated to improve significantly under current policies, so the national (and global) degradation of the environment will continue. This may lead to heightened interest in these issues, which will be reflected in future laws and policies.
investigation’s projections are the federal tax credit (set to expire in 2016), and state renewable portfolio standards (RPS). Generally, these standards stop increasing by 2025; however, most states are currently meeting or exceeding their requirements (EIA 2014). Thus, RPS are assumed to become more stringent in the later years of the projection, which will potentially increase long-term energy generation and create additional incentives for adopting renewable energy technologies.
five-year grace period is proposed to allow for the fulfillment of this initiative in 2025.
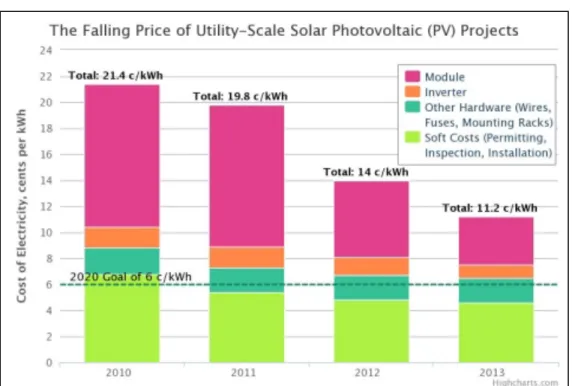
Fig 7. The falling price of utility-scale solar PV projects (EIA 2014). Price reductions over time for utility-scale PV projects and a breakdown of system costs are depicted. The dashed green line denotes the price goal under the SunShot initiative for utility-scale solar PV.
concentrated and energy is converted to heat from “photons greater than the band gap” (Four Peaks Technologies, Inc. 2012). Different types of PV modules have varying theoretical limits, which are discussed in detail below. (5) The cost of solar energy generation will continue to decline. The per-watt
price is proportional to the aggregate installed system cost and inversely proportional to the system efficiency (U.S. DOE 2012). In this analysis it is assumed that system size and system cost are negatively correlated; as the system cost decreases the average system size will increase.
(6) Solar technologies that have undergone significant research and present a new or improved alternative to existing technologies will surface and increase in adoption over time.
In the reference case, conversion efficiency starts at 15% in 2014 and reaches 20% in 2030, where it is projected to remain until at least 2050 (EIA 2014). This
Fig 8. Production, laboratory, and theoretical maximum PV module efficiencies for selected technologies (U.S. DOE 2012). c-Si refers to non-concentrating monocrystalline silicon modules and mc-Si refers to non-concentrating polycrystalline silicon modules.
Technology Best Research-Cell (2015)
Theoretical Max1
20143 2020 2030 2040
Non-concentrating Monocrystalline
Silicon
25.0% 29% 15% 17% 20% 23%
Silicon HIT4 25.6% - 19% 22% 24% 27%
Thin Film CIGS 21.7% 29% 13% 14% 18% 21%
Thin Film CdTe 21.5% 29% 12% 14% 18% 21%
Perovskite 20.1% - 8% 11% 15% 20%
Organic PV 11.1% 14% 2% 5% 8% 10%
Quantum dots 9.2% 45%2 5% 16% 19% 22%
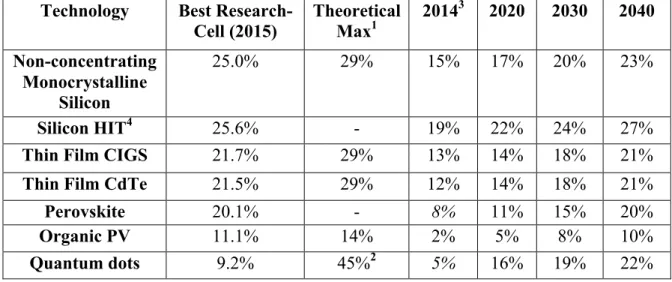
Table 2.1Conversion efficiency assumptions for selected technologies. Expected typical module productivity is displayed rather than best research-cell efficiency.
1Theoretical maximum efficiencies are given by the Shockley-Quiesser calculations as presented by
3Italicized efficiencies for 2014 were estimated and the others are taken from the 2012 SunShot Vision
Study.
4Panasonic Sanyo HIT solar panels currently on market have cell efficiencies of 20.2% (Wholesale
Solar 2015).
Conversion Efficiency Estimate Justifications:
(1) Non-concentrating monocrystalline silicon (c-Si): These conventional solar panels are anticipated to gradually increase in efficiency over time. Because this technology has been around for many years, sudden improvements in conversion efficiency are not expected.
(2) Silicon HIT: There is considerable interest in the commercialization of this technology because silicon HIT cells have a similarly simple fabrication process to c-Si cells, and allow for efficiencies in excess of 20% (De Wolf et al. 2012).
(3) Thin Film CIGS & CdTe: Thin film CIGS and CdTe cells will likely develop similarly. Both technologies have similar current best research-cell
efficiencies and theoretical max efficiencies. Because thin film solar cells have a broad range of uses and applications, this analysis anticipates that there will be a lot of incentive to continue research in the future and conversion efficiencies will increase significantly.
(4) Perovskite: This technology has been developing quickly. Since its main introduction in 2013, perovskite cells’ conversion efficiencies have increased by about 7% (NREL 2015). The range of estimates in literature for the
(5) Organic PV: Although current efficiencies for organic PV are low, the rate of development of this technology has been relatively high in recent years. Because many solar technologies utilize some rare and/or toxic materials, organic PV will play an important role in the future for sustainable energy generation. The theoretical max efficiency for this category of solar cell is relatively low, but this analysis concludes that by 2040, it is feasible that organic cells will achieve about 10% conversion efficiency.
CHAPTER 3: RESULTS Introduction
This section provides the residential PV generation projections of this
investigation through 2040. Inputs into this investigation’s projection curve include PV system cost, timely introduction and market penetration of state-of-the-art technologies, conversion efficiency, and system size.
Fig 9. Projected residential PV generation 2013-2040. The reference and low RE technology cost projections are from the AEO 2014 report. The green curve represents anticipated generation under the assumptions of this investigation. Generation in 2040 is anticipated to be 0.495 quadrillion Btu.
2015-2016: This analysis does not anticipate departure from the reference case or low cost renewable scenarios while the federal tax credit is present. In these years, growth in generation is exponential.
2017: Rate of increase will slow significantly due to scheduled sunset of the 30% federal tax credit.
2020: Introduction of thin-film CdTe, CIGS and building-integrated solar.
2025: Introduction of perovskite and organic PV cells. Average residential system size increases to 7.5 kW and total installed cost of monocrystalline silicon residential solar systems reaches $1.50/W under the SunShot initiative. By comparison, the
reference case projects that in 2025 the average residential system size will be 5 kW and will cost about $3.07/W (EIA 2014). The SunShot initiative goals correspond to a 50% increase in system size and a 51% decrease in system cost from the reference case
projections. System size and system cost are correlated variables, so generation in 2025 is not anticipated to be more than 55% greater than the reference case projection as a result of these two factors.
Meeting the SunShot Initiative goals by 2025 will significantly alter the generation projections. From 2025 and beyond, the residential systems will be at least 50% larger than in the reference case projections and average system cost will be about 50% less. If the total installed cost of residential solar systems reaches $1,500 per kW DC, this corresponds to a cost of $11,250 for a 7.5 kW system. Under the reference case, a 7.5kW system would cost about $23,000. A 50% increase in system size will add 0.0578 quadrillion Btu of generation in 2025. A further increase in average system size to 8.0kW would add 0.1347 quadrillion Btu of generation in 2040 to the reference case projection for this same year.
The AEO Report reference case considered a 5kW system with approximately 20% conversion efficiency (EIA 2014). This investigation suggests an increase in conversion efficiency of the standard monocrystalline silicon panel to 23%, which will expand generation by about 15% and corresponds to an extra 0.0345 quad Btu of generation in 2040.
Table 3.1 Summary of significant inputs into generation estimates. Additional generation is estimated based on the AEO reference case estimate of 0.23 quadrillion Btu in 2040. The relationship between each factor and generation is reasonably estimated. For example, an increase in the average residential PV system size to 8.0 kW is a 60%
increase from the estimated system size in the AEO report. Thus, a 60% increase in generation (0.60*0.2246 quad Btu = 0.1347 quad Btu) is reported.
1Increase in average system size is heavily correlated with decrease in system cost. Thus, to avoid
“double counting” the influence of these two factors, system cost was assumed to singularly cause only an additional 5% increase in generation over the reference case in 2040, which corresponds to 0.0112 quadrillion Btu.
This investigation estimates 0.2704 quadrillion Btu of renewable generation in 2040 that is unaccounted for in the reference case due to the factors listed in Table 3.1. In the AEO 2014 Report, the low renewable technology cost scenario estimates 0.37
quadrillion Btu and the reference case predicts 0.22 quadrillion Btu in 2040 (EIA 2014). Thus, the aggregate anticipated generation in 2040 is 0.4950 quadrillion Btu.
Factor Additional Generation in
2040 (quad Btu) Increase in average system size to 8.0 kW 0.1347 Decrease in system cost by >50% under SunShot
Initiative1
0.0112 Increase in conversion efficiency of c-Si modules 0.0345 Increase in RPS stringency in 2030 0.0050 Development of building-integrated solar applications 0.0550
New solar technologies: quantum dots, perovskite, organic PV
0.0300
CHAPTER 4: CONCLUSIONS Introduction
The AEO 2014 reference case projections for renewable energy generation from residential solar systems through 2040 are likely a significant underestimate. This analysis concludes that by 2040, energy generation from these systems will be approximately 0.495 quadrillion Btu, which is more than double the reference case estimation from the AEO 2014 report. The large discrepancy between the two projections is primarily explained by the consideration of many up-and-coming technologies and innovations.
Discussion
Photovoltaic capital costs have seen a sharp decline in the past decade, but there is a lot of uncertainty in the future of both the extent and pace of continued price drops (EIA 2014). The overall cost associated with solar power decreased by about 99% between 1977 and 2013 (Glenn 2014). Photovoltaic projects vary significantly by geographic region, type, and regulatory framework, and thus the costs are difficult to predict accurately (EIA 2014). Indeed, even estimating the current cost of a project can be challenging for these reasons. Solar costs willcontinue to decrease, driven largely by streamlined buying and installation processes (Glenn 2014). According to a report by the NREL, non-hardware costs, such as installation labor, customer acquisition, permit and inspection fees, interconnection fees, and indirect corporate costs now make up the majority of residential rooftop PV expenses (Clover 2013). Distributed PV installers encounter a variety of obstacles and fees such as complex codes, permits, and zoning ordinances (U.S. DOE 2012). Streamlining regulatory requirements for distributed solar projects can enable rapid solar system deployment.
The SunShot Vision study conducted in 2012 concludes that there is an
abundance of suitable land for solar deployment; to supply all end-use electricity in the United States is about 0.6% of the country’s total land area (U.S. DOE 2012). There is great potential for CSP. About 17,500 TWh of annual CSP electricity generation, or more than four times the 2010 annual demand in the United States, could be placed on land in seven southwestern states (U.S. DOE 2012). These regions have already been deemed suitable from a technical standpoint in terms of insolation and slope (U.S. DOE 2012). Further, many of the sites with the greatest solar-resource potential are in arid
Approximately 900,000–2,700,000 acres are required for utility-scale solar projects in 2030 under the SunShot scenario, and approximately 2,100,000–6,300,000 acres are required in 2050 (U.S. DOE 2012). This land area is equivalent to about 0.05%–0.14% of the contiguous U.S. in 2030 and 0.11%–0.33% in 2050 (U.S. DOE 2012).
The future of solar energy in the United States is favorable. In 2014, solar deployment rose almost 40% from the previous year, and the U.S. has become the third largest solar market in the world (Sekaric 2015). In addition, domestic manufacturing is quickly developing, which is key to sustainable growth and deployment of solar
electricity systems (Sekaric 2015). In recognition of this, SunShot has launched its Technology-to-Market program, which offers financial support to entrepreneurs and companies for the development of solar technologies with up to $45 million in available funding (Sekaric 2015).
Future Work
aggregation of solar energy technologies will be considerably greater than the residential PV system contribution estimates of this investigation.
Because non-hardware costs, or soft costs, currently account for the majority of expenses of rooftop PV systems, efforts to streamline the installation process can result in significant cost reduction and boost installations through increased convenience to
customers. An expansion of this investigation would consider non-technical factors, such as the anticipated policy and subsidy changes in the long term or ease of installation, which will significantly influence solar system installations.
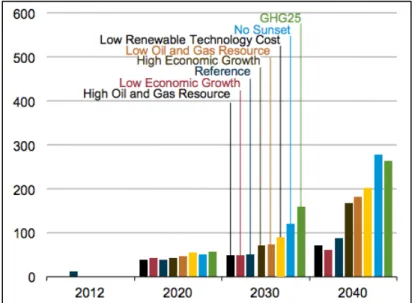
There are many different economic and political scenarios to consider in future analyses. Some of these possible situations are considered in the AEO 2014 report but are beyond the scope of this investigation. Considerations include the influence of high or low economic growth, availability of oil and gas resources, existence of fees for greenhouse gas emissions, and extension of subsidies and incentives.
remain indefinitely) and GHG25 (greenhouse emission fees starting at $25/ton) scenarios resulted in the greatest growth in generation (EIA 2014).
Technological Advances
There is a wide variety of solar research being conducted to improve the overall
system efficiency, sustainability of materials, system lifetime, toxicity, and price of solar
energy. Many of these research projects seek to find novel ways to incorporate PV into
building materials, vehicles, and other objects. Some recent technological developments
are discussed below.
Researchers from North Carolina State University have proposed a design for thin
film solar cells that can drastically boost absorption efficiencies and decrease
manufacturing costs (Shipman 2014). The revolutionary design is based off of achieving
the maximal solar absorption for semiconductor materials; current approaches assume
weak absorption for common materials such as amorphous silicon, CdTe, and CIGS that
are well below their theoretical limits (Yu et al. 2014). The proposed a-Si deign can
achieve 91% absorption efficiency at a mere thickness of 10nm (Yu et al. 2014). By
comparison, current state-of-the-art a-Si thin-film technologies are about 100nm thick
(Shipman 2014). Decreasing the thickness lowers manufacturing costs because it utilizes
less material and decreases the deposition time (Shipman 2014). In addition to the
design’s outstanding efficiency, other advantages include the convenience of fabrication
and the abundance of required materials (Yu et al. 2014). The materials utilized in this
design are both inexpensive and abundant on earth, and the fabrication techniques already
exist for current solar cells (Yu et al. 2014). In addition, this design can potentially be
that 50nm-thick CdTe and 30nm-thick CIGS cells can achieve 90% absorption
efficiencies (2014).
Cadmium telluride is the current “basis for the market-leading thin-film solar-cell technology” (Major et al. 2014). In 2013, CdTe laboratory efficiencies were at 19.6% (Green et al. 2013). In the conventional manufacturing process, polycrystalline thin-film CdTe is doped with cadmium chloride (Major et al. 2014). However, cadmium chloride has two significant drawbacks; it is expensive (about 30 cents per gram) and its solubility in water makes it an environmental threat. Cadmium chloride costs about $0.30 USD per gram and toxic cadmium ions can be harmful to operators during the manufacturing process as well as the environment (Major et al. 2014). Major et al.’s study replaced cadmium chloride with magnesium chloride (MgCl2), which is non-toxic, costs about
$0.01 USD per gram, and has equivalent efficiencies to cadmium chloride-processed cells (2014). However, the implications of this discovery are uncertain; some solar firms say that this discovery will not have a significant influence on the costs of manufacturing CdTe PV modules because the CdCl2 treatment step is a minor cost (Noorden 2014).
REFERENCES
Allen, G. “New NanoMarkets Report Projects Building Integrated Photovoltaics (BIPV) Markets to Top $6 billion in 2017.” 16 July 2014. Nasgaq GlobeNewswire. Web. 10 November 2014.
<http://globenewswire.com/news- release/2014/07/16/651210/10089685/en/New-NanoMarkets-Report-Projects- Building-Integrated-Photovoltaics-BIPV-Markets-To-Top-6-billion-in-2017.html>.
BASF. “Photovoltaic: Organic Solar Cells.” 2014. Web. 3 Nov 2014.
<http://www.basf.com/group/corporate/chemistryworldtour/en/innovationen/orga nic-solar-cells>.
BCC Research. “Quantum Dots: Global Market Growth and Future Commercial Prospects.” April 2014. Web. 10 Nov 2014.
<http://www.bccresearch.com/market-research/nanotechnology/quantum-dots-nanomaterials-nan027d.html>.
Bett, A.W., S.P. Philipps, S. Essig, S. Heckelmann, R. Kellenbanz, V. Klinger, M. Niemeyer, D. Lackner, F. Dimroth. “Overview About Technology Perspectives for High Efficiency Solar Cells for Space and Terrestrial Applications.”
Fraunhofer Institute for Solar Energy Systems, 2013. Web. 10 Nov 2014.
<http://www.ise.fraunhofer.de/de/veroeffentlichungen/konferenzbeitraege/konfere nzbeitraege-2013/28th-eupvsec/bett.pdf>.
Borghino, D. “Quantum dot breakthrough could lead to cheap spray-on solar cells.” 10 June 2014. Gizmag. Web. 11 November 2014.
<http://www.gizmag.com/quantum-dot-solar-cells/32478/>.
Bossong, K. “Renewable Energy Could Provide 16% of U.S. Electricity Within Five Years: Some Modest Projections For Near-Term Growth.” Nuclear Information and Resource Service: Sun Day Campaign, 15 Apr 2014. Web. 15 Feb 2015. <http://www.nirs.org/alternatives/sundayforecast414.pdf>.
Bulkin, B. “Perovskites: the future of solar power?” The Guardian, 7 March 2014. Web. 11 November 2014.
<http://www.theguardian.com/sustainable-business/perovskites-future-solar-power>.
Clover, I. “Soft costs account for most of PV residential installation costs.” PV
Magazine: Photovoltaic Markets & Technology, 3 Dec 2013. Web. 14 Apr 2015. <http://www.pv-magazine.com/news/details/beitrag/soft-costs-account-for-most-of-pv-residential-installation-costs_100013637/#axzz3Q7nicuLH>.
Commonwealth Scientific and Industrial Research Organisation (CSIRO). “Photovoltaics.” 18 Feb 2015. Web. 13 Apr 2015.
Database of State Incentives for Renewables & Efficiency (DSIRE). “Programs: North Carolina.” NC Clean Energy Technology Center, 2015. 13 Apr 2015.
<http://programs.dsireusa.org/system/program?state=NC>.
De Wolf, S., A. Descoeudres, Z.C. Holman, C. Ballif. “High-efficiency Silicon Heterojunction Solar Cells: A Review.” Green 2012; 2:7-24
Durkay, J. “State Renewable Portfolio Standards and Goals.” National Conference of State Legislatures, 2 Feb 2015. Web. 14 Apr 2015.
<http://www.ncsl.org/research/energy/renewable-portfolio-standards.aspx>. Ecoseed. “New thin-film solar cell design increases solar absorption while decreasing
cost.” 10 March 2014. Web. 10 Apr 2015.
<http://www.ecoseed.org/technology/17415-new-thin-film-solar-cell-design-increases-solar-absorption-while-decreasing-cost>.
Energy Information Administration. “Annual Energy Outlook 2014.” 7 May 2014. Web. 10 Oct 2014. <http://www.eia.gov/forecasts/aeo/>.
Eischeid, J. “Producing Sustainable Solar Panels Without Rare Materials.” This Big City, 7 May 2013. Web. 14 October 2014.
<http://thisbigcity.net/producing-sustainable-solar-panels-without-rare-materials/>.
EERE. “Photovoltaic Cell Basics.” Office of Energy Efficiency and Renewable Energy, 16 August 2013. Web. 14 October 2014.
<http://energy.gov/eere/energybasics/articles/photovoltaic-cell-basics>.
Four Peaks Technologies, Inc. “Solar Efficiency Limits.” Solar Cell Central, 2012. Web. 16 March 2015. <http://solarcellcentral.com/limits_page.html>.
Four Peaks Technologies, Inc. “Solar Markets.” Solar Cell Central, July 2014. Web. 10 November 2014. <http://solarcellcentral.com/markets_page.html>.
Glenn, D. “The Future of Solar: Solar Power to Surge in 2014?” CleanTechnica, 5 April 2014. Web. 6 March 2015. <http://cleantechnica.com/2014/04/05/future-solar-solar-power-surge-2014/>.
Green, M.A., K. Emery, Y. Hishikawa, W. Warta, and E.D. Dunlop. “Solar cell efficiency tables (version 43).” Prog. Photovolt: Res. Appl. 2014; 22:1-9 Jacques, C. “Niche Solar Markets Grow to 1.2 GW in 2024.” Lux Research, 24 June
Johnson, D. “Quantum Dot Solar Cells Break Conversion Efficiency Record.” IEEE Spectrum, 30 May 2014. Web. 25 November 2014.
<http://spectrum.ieee.org/nanoclast/green-tech/solar/quantum-dot-solar-cells-break-conversion-efficiency-record>.
Lalonde, L. “Don’t Judge a Solar PV System’s Efficacy By Inverter Efficiency Alone.” Electronic Design Europe News Brand, 25 October 2011. Web. 25 November 2014. <http://electronicdesign.com/energy/don-t-judge-solar-pv-system-s-efficacy-inverter-efficiency-alone>.
Lerner, L. “Solar Panel Manufacturing is Greener in Europe than China: Study highlights environmental cost of outsourcing manufacturing to save money.” Northwestern University, 29 May 2014. Web. 14 October 2014.
Maehlum, M.A. “What is the Potential of Solar Energy?” Energy Informative, 7 June 2013a. Web. 13 October 2014. <http://energyinformative.org/potential-of-solar-energy/>.
Maehlum, M.A. “Solar Cell Comparison Chart –Mono-, Polycrstalline and Thin Film.” Energy Informative, 27 September 2013b. Web. 13 October 2014.
<http://energyinformative.org/solar-cell-comparison-chart-mono-polycrystalline-thin-film/>.
Maehlum, M.A. “Which Solar Panel Type is Best? Mono- vs. Polycrystalline vs. Thin Film.” Energy Informative, 6 December 2013c. Web. 13 October 2014.
<http://energyinformative.org/best-solar-panel-monocrystalline-polycrystalline-thin-film/>.
Maehlum, M.A. “Solar Energy Pros and Cons.” Energy Informative, 12 May 2014a. Web. 10 November 2014. <http://energyinformative.org/solar-energy-pros-and-cons/>.
Maehlum, M.A. “Best Thin Film Solar Panels – Amorphous, Cadmium Telluride or CIGS?” Energy Informative, 24 September 2014b. Web. 13 October 2014. <http://energyinformative.org/best-thin-film-solar-panels-amorphous-cadmium-telluride-cigs/>.
Maas, M. “Multi-Junction Solar Cells with Concentrators.” Stanford University PH240 Coursework. Stanford U, 13 Dec 2012. Web. 3 Nov 2014.
<http://large.stanford.edu/courses/2012/ph240/maas2/>.
Major, J.D., R.E. Treharne, L.J. Phillips, and K. Durose. “A low-cost non-toxic post-growth activation step for CdTe solar cells.” Nature 2014; 511:334-337
2011. Web. 24 November 2014.
<http://energy.gov/sites/prod/files/2014/01/f7/47927_chapter2.pdf>.
National Renewable Energy Laboratory (NREL). “Renewable Electricity Futures Study.” Golden, CO: NREL, 2012. Web. 10 March 2015.
<http://www.nrel.gov/analysis/re_futures/>.
National Renewable Energy Laboratory (NREL). “NREL Unlocking Secrets of New Solar Material.” 15 April 2014a. Web. 11 November 2014.
<http://www.nrel.gov/news/features/feature_detail.cfm/feature_id=10333>. National Renewable Energy Laboratory (NREL). “Homeowners Guide to Leasing a Solar
Electric System.” July 2014b. Web. 17 November 2014. <http://www.nrel.gov/docs/fy14osti/60972.pdf>.
National Renewable Energy Laboratory (NREL). “Best Research-Cell Efficiencies.” 2015. Web. 17 March 2015.
<http://www.nrel.gov/ncpv/images/efficiency_chart.jpg>.
North Carolina State University. “North Carolina Incentives/Policies for Renewables & Efficiency.” Database of State Incentives for Renewables & Efficiency, 2014. Web. 22 July 2014.
<http://www.dsireusa.org/incentives/index.cfm?re=0&ee=0&spv=0&st=0&srp=1 &state=NC>.
Noorden, R.V. “Bath-salt chemical promises safer solar cells.” Nature News, 2014. Web. 25 June 2014. <http://www.nature.com/news/bath-salt-chemical-promises-safer-solar-cells-1.15464>.
Ross, P. “Solar Cells Made of Tin are ‘Very Promising’ as a Low-Cost Alternative Energy Source.” International Business Times, 5 May 2014. Web. 11 November 2014. <http://www.ibtimes.com/solar-cells-made-tin-are-very-promising-low-cost-alternative-energy-source-1580105>.
Saadatian, O., C.H. Lim, K. Sopian, and E. Salleh. “A state of the art review of solar walls: Concepts and applications.” Journal of Building Physics 2013; 37(1):55-79 <http://jen.sagepub.com/content/37/1/55.full.pdf+html>.
Sekaric, L. “U.S. Solar Manufacturing Rising on the Horizon.” Breaking Energy. 6 February 2015. <http://breakingenergy.com/2015/02/06/u-s-solar-manufacturing-rising-on-the-horizon/>.
Solar Energy Industries Association (SEIA). “Building-Integrated Photovoltaics.” 2014a. Web. 1 Apr 2015. <http://www.seia.org/policy/solar-technology/photovoltaic-solar-electric/building-integrated-photovoltaics>.
Solar Energy Industries Association (SEIA). “Solar Industry Data.” 2014b. Web. 1 Feb 2015. <http://www.seia.org/research-resources/solar-industry-data>.
Solar Energy Industries Association (SEIA). “North Carolina Solar.” 2014c. Web. 1 Feb 2015. <http://www.seia.org/state-solar-policy/north-carolina>.
Solar Energy Industries Association (SEIA). “Net Metering by State.” 2014d. Web. 12 Mar 2015. <http://www.seia.org/research-resources/net-metering-state>.
SolarServer. “Building Integrated Photovoltaics: An emerging market.” August 2010. Web. 10 Apr 2015.
<http://www.solarserver.com/solar-magazine/solar-report/solar-report/building-integrated-photovoltaics-an-emerging-market.html>.
Thomson Reuters. 2014. “The World in 2025: 10 Predictions of Innovation.” Web. 8 Apr 2015.
<http://sciencewatch.com/sites/sw/files/m/pdf/World-2025.pdf>.
U.S. Department of Energy (DOE). “SunShot Vision Study.” February 2012. Web. 17 March 2015. <http://energy.gov/sites/prod/files/2014/01/f7/47927_chapter4.pdf>. Wheeland, M. “The Advantages of Solar Energy vs Other Renewable Energy Sources.”
Pure Energies, 8 June 2014. Web. 24 November 2014.
<http://pureenergies.com/us/blog/the-advantages-of-solar-power-vs-other-renewable-energy-sources/>.
Wholesale Solar. “Panasonic Sanyo HIT-225A01 225-Watt Monocrystalline Solar Panel.” Wholesale Solar, 2015. Web. 21 Apr 2015.
<http://www.wholesalesolar.com/products.folder/module-folder/Sanyo/hit-n225a01.html>
Yu, Y., L. Huang, and L. Cao. “Semiconductor Solar Superabsorbers.” Scientific Reports. 2014; 4: 4107
<http://www.nature.com/srep/2014/140217/srep04107/full/srep04107.html>. Yue, D., F. You, and S.B. Darling. “Domestic and overseas manufacturing scenarios of