255
A real-time framework for performance optimization of safety
culture in the oil and gas industry under deep uncertainty
(Case study: a petrochemical plant)
Mohammad Rahmanidoust
1, Jianguo Zheng
1, Reza Yazdanparast
2*, Iman Nematollahi
3,
Elahe Akbari
21
Glorious Sun School of Business and Management, Donghua University, Shanghai 200051, China
2 School of Industrial Engineering, College of Engineering, University of Tehran, Tehran, Iran
3 Department of Industrial Engineering, Sciences and Researches Branch, Islamic Azad University,
Tehran, Iran
[email protected], [email protected], [email protected], [email protected], [email protected]
Abstract
This study proposes a real-time framework for performance optimization of proactive safety culture in the oil and gas industry. Safety culture indicators were extracted from the literature using a comprehensive literature review. The proposed framework is based on fuzzy data envelopment analysis (FDEA), artificial neural networks (ANN), and statistical methods. It is able to evaluate the real-time performance of any safety-critical plant in the oil and gas industry and determines the current status of each indicator. The required data were collected using a questionnaire which was distributed as a self-administered survey to 210 employees in Shiraz Petrochemical Company and 174 surveys were returned with a high response rate. The application of fuzzy logic along with stochastic efficiency frontier analysis has empowered the proposed hybrid framework to deal with deep uncertainty, and result in more reliable findings. The obtained results can help safety managers to improve the proactive safety culture of the organization. They also can use the presented framework for periodic safety evaluations and determine the effectiveness of the implemented correction plans. To the best of our knowledge, this is the first study that presents a real-time framework for performance optimization of safety culture under deep uncertainty in the oil and gas industry.
Keywords: Proactive safety culture, efficiency frontier analysis, performance optimization, safety-critical industry, fuzzy data envelopment analysis, artificial neural networks.
1- Introduction
Safety is one of the most important aspects of any safety-critical industrial unit. Besides the human injuries and loss, any accident in critical industrial units can result in a catastrophic scope. Oil, gas and petrochemical industry is the main pillar of the economy in Iran.
*Corresponding author
ISSN: 1735-8272, Copyright c 2019 JISE. All rights reserved
Journal of Industrial and Systems Engineering
Vol. 12, No. 2, pp. 255- 282
256
Not only most of the oil, gas and petrochemical infrastructures in Iran are old and worn-out (Azadeh et al., 2017), but also the safety management practices are not adequate. Currently, more than seventeen million employees are working in oil, gas and petrochemical industry in Iran which highlights the need for health and safety practices. Although the Ministry of Labor and Social Affairs along with Ministry of Health and Medical Education are responsible for employees’ safety and have proposed much legislation, the reports do not reflect any accident reduction in this industry. Due to the presence of flammable and explosive materials in the oil, gas and petrochemical plants, safety planning becomes much more significant. According to safety managers, proactive and preventive safety planning is the best solution to this problem.
Occupational injuries and illnesses can change the lives of too many people, including families, coworkers, and communities. Besides human loss and suffering which is immeasurable, financial burdens are other consequences of occupational accidents. The occupational safety is much more highlighted in critical industrial units such as petrochemical plants, refineries, and nuclear plants where the consequences are far more extensive. The traditional safety management was primarily investigating the system for repetitious accidents and near-misses. In other words, it was reactively concentrated on preventing accidents (Booth and Lee, 1995). As the industrial growth and revolution happened, the insufficiency of traditional safety management and the need for proactive safety management emerged. Therefore, safety management evolved in industrial units and became more important. In the past decades, various practitioners and researchers have investigated the accidents and indicated that human error is the main contributing factor to accidents. It is important to understand that this doesn’t indicate the incompetency of the workers, and that’s why changing people doesn’t prevent accidents. As a matter of fact, human error is the last link of the chain that leads to an accident (Antonsen, 2017). As a result, terms such as Organizational Accident and Organizational Culture was introduced in the 1990s. The concept of safety culture emerged based on the stated ideas and safety climate which was introduced by Zohar (1980), as an effective proactive safety management approach. It is been stated that safety culture affects all parts of a system consistently. Therefore, it’s much more effective than increased supervision (Parker et al., 2006). This concept was first introduced by the International Automatic Energy Agency (IAEA) during the analysis of the Chernobyl disaster. Safety culture can be described as the product of beliefs, values, attitudes, and norms which determine the effectiveness of health and safety management in an organization. Safety climate refers to a shared perception of safety management in an organization among employees, while safety culture is much deeper and defines the basic and fundamental assumptions about safety (Casey et al., 2017). It should be noted that although creating a safety culture is not easy, it is proven that it can be investigated based on employees’ patterns of attitude (Glendon and Stanton, 2000). In other words, the lack of safety culture in an organization is mirrored by negative patterns of beliefs, values, attitudes, and motivations among human resources.
According to Mearns and Flin (1999), measuring safety culture in organizations requires a thorough investigation. In this regard, safety culture dimensions for the considered organization should be determined. Safety studies in the United States nuclear industry after the disaster of Chernobyl in 1995 resulted in the primary safety culture indicators, including effective communication, organizational learning, organizational focus, and external factors (Glendon and Stanton, 2000). Later, Reason in 1997 proposed the indicators of safety culture which includes safety information system, reporting culture, trust culture, flexibility, and willingness to reform (Reason, 2016). Westrum (1996) presented a safety culture evaluation framework based on three levels of safety culture sophistication, including Pathological, Bureaucratic and Generative. Fleming (2001) developed a safety culture framework based on five maturity levels, including emerging, managing, involving, cooperating, and continually. In order to measure safety culture in each level, he proposed ten safety culture indicators, including training, job satisfaction, trust, shared perceptions about safety, participation, safety resources, learning organization, communication, management commitment, and productivity versus safety. Hudson (2001) presented a safety culture framework based on the maturity model of Westrum (1993). He considered information sharing and trust as the most important factors in safety culture evolution through five stages, namely Pathological, Reactive, Calculative, Proactive, and Generative. Later, Parker et al. (2006) developed a
257
framework for performance evaluation of safety culture based on the proposed frameworks by Westrum (1996) and Reason (2016). The authors stated that if an organization is on the Generative level of safety culture, it can plan for improvement of safety culture indicators using the framework of Reason (2016). Goncalves Filho et al. (2010) proposed a safety culture framework based on the maturity model of Hudson (2001) for proactive safety improvement in petrochemical plants. They considered information, organizational learning, involvement, communication, and commitment as safety culture indicators. The required data were collected using questionnaires and interview with safety managers and experts in three petrochemical plants around Brazil. Grote (2008) proposed a safety culture improvement framework for petrochemical plants based on four sets of indicators, including reflected radically of change, support for constructive redevelopment, and esteem for employees, and employee involvement. Hajmohammad and Vachon (2014) evaluated the interrelationships between safety culture and organizational, indicators including environmental practices, environmental performance, safety practices, safety performance, and financial performance. They have measured the safety culture based on management commitment and employee participation indicators. Hsu et al. (2008) developed a comprehensive framework for safety culture assessment in oil refinery plants. The proposed framework is composed of safety self-efficacy, supervision, safety awareness, and safety behavior along with their related prerequisites. Kao et al. (2008) proposed a safety culture assessment framework for petrochemical plants. They introduced eight safety culture dimensions, including safety commitment and support, safety attitude and behavior, safety communication and involvement, safety training and competence, safety supervision and audit, safety management system, organization accidents investigation and emergency planning. Martínez-Córcoles et al. (2011) investigated the interrelationship among safety culture, safety climate, leadership, and safety behaviors in nuclear plants using structural equation modeling. Håvold et al. (2017) proposed a safety culture framework for the shipping industry. They considered eleven safety culture dimensions, including satisfaction with safety activities, fatalism, communication, knowledge and competence, management attitude, job satisfaction, safety rules, and learning culture. Goncalves Filho and Waterson (2018) proposed a review of safety culture and maturity models. Jiang et al. (2019) conducted a survey to investigate the role of safety culture and climate in industrial units toward improving proactive safety. Zhang et al. (2019) proposed a safety assessment model for performance optimization of proactive safety in production management. It should be noted that there is also a vast literature on safety culture assessment in healthcare which is out of the scope of the present study. For more information on safety culture in healthcare, readers can refer to (Nieva and Sorra, 2003; Pronovost and Sexton, 2005; Flin, 2007; Hellings et al., 2007; Sammer et al., 2010; Halligan and Zecevic, 2011; Schwartz et al., 2019).
Although safety culture is one of the most effective proactive safety management approaches, various researchers have proposed methods and approaches for improving proactive safety in safety-critical industries in the past decade. Burns (2006) proposed a proactive deviation detection approach for improving safety in petrochemical plants. Chen and Yang (2004) developed a predictive safety index for improving proactive safety in petrochemical plants which was based on observed near-miss events and unsafe conditions. Curcuruto et al. (2015) proposed a proactive safety behavior-based approach for evaluating the safety performance in chemical plants. Although proactive safety can improve the safety significantly, reactive safety and investigation of deviations are necessary for building a resilient and safe workplace (Verma et al., 2018).
This study aims to present a real-time proactive safety framework for performance optimization of safety culture in safety-critical industries. The proposed framework is composed of a comprehensive set of safety culture indicators alongside a hybrid performance evaluation algorithm. The developed unique hybrid performance evaluation algorithm is composed of artificial neural networks (ANN), fuzzy data envelopment analysis (FDEA), and statistical methods. It is capable of dealing with severe uncertainty and determines the real-time performance of each safety culture indicator in the considered case study. The obtained results can help safety-critical industries managers in planning for proactive safety improvement. They can also evaluate the performance of safety indicators in multiple periods using the developed framework, in order to determine the effectiveness of implemented corrective plans. To the
258
best of our knowledge, this is the first study that presents a real-time performance optimization framework for improving safety culture considering severe uncertainty in safety-critical industries. The rest of this paper is organized as follows: The methodology of this study is presented in Section 2. Section 3 demonstrates the application of the proposed approach in a real case study. The obtained results and discussions are presented in Section 4. Lastly, Section 5 is dedicated to concluding remarks and directions for future research.
2- Methodology
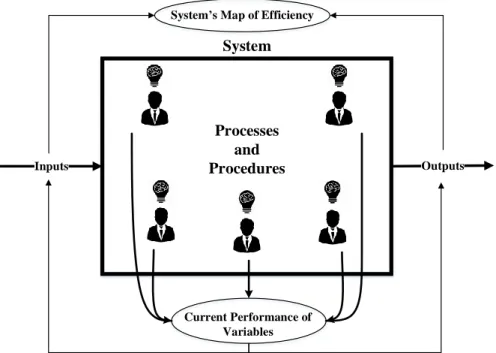
Effective proactive safety management in the oil and gas industry is of great significance. One of the most important stages of developing such a safety management system is a real-time performance evaluation of proactive safety dimensions in the considered environment. Performance evaluation results in the determination of weaknesses and strengths of safety dimensions, and paves the way toward proactive safety improvement. In this regard, this study proposes a real-time performance optimization of safety culture indicators based on efficiency frontier analysis. Although the primary use of efficiency frontier analysis is investigating the productivity and efficiency of decision-making units (DMUs), and finally ranking them, it is a popular tool for investigating the relationship between multiple inputs and output variables in conceptual systems where the relationships among variables are complex and vague (Zhalechian et al., 2017). In other words, efficiency frontier analysis methods such as data envelopment analysis (DEA) usually evaluates the performance of a system by considering multiple inputs and output variables, however, in order to evaluate the role of input and output variables, it is possible to reverse this process. In this regard, a set of experts from the system who are aware of the system processes, express their knowledge about the role of the input and output variables which form the overall performance of the system. Therefore, the obtained efficiency score for each expert determines the overall performance of the system based on the related input and output variables from the correspondent point of view. The obtained set of efficiency scores from all participated experts depict the efficiency map of the system which demonstrates the real-time performance of the system (Azadeh et al., 2017)
. The schematic view
of the stated approach is presented in figure 1.
Inputs Outputs
System
Current Performance of Variables Processes
and Procedures System s Map of Efficiency
259
In order to calculate the efficiency scores in efficiency frontier analysis, various methods and models are developed which are primarily based on the traditional DEA models. DEA is a non-parametric method for evaluating the efficiency of DMUs based on multiple inputs and output variables. However, it is unable to deal with severe uncertainty and it only considers the linear relationships between variables (Heidari et al., 2017). Since the nature and relationships of safety culture indicators are complex, we need an efficiency frontier analysis tool which deals with severe uncertainty and complex relationships. In order to address the stated disadvantages of traditional DEA models, this study proposes a hybrid performance evaluation algorithm based on FDEA and ANN. FDEA is capable of handling severe uncertainty and considering the linear relationships among variables, while ANN considers non-linear relationships among variables alongside dealing with severe uncertainty. The main steps of the proposed framework are presented as follows.
Step 1. Identification of safety culture indicators
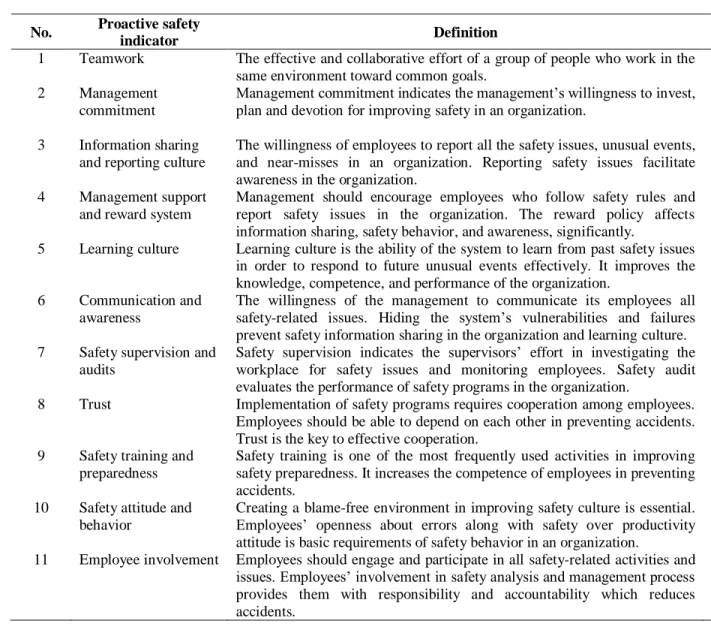
In order to evaluate and optimize safety culture, first, safety culture indicators should be identified. Each safety culture indicator covers a safety culture dimension in safety-critical industries. This study develops a comprehensive set of safety culture indicators based on the previous studies in the literature. Table 1 presents the considered safety culture indicators along with their supporting references.
Step 2. Data collection
In order to collect the required data, a standard questionnaire is designed based on the considered safety culture indicators (which is presented in Appendix A). Jam Petrochemical Company in Iran is considered as a real-life case study. Various managers and experts from different departments of the considered case study answered the questions of the questionnaire related to each safety culture dimension by assigning a number between 1 to 10 (1 is very low and 10 is very high). The developed questionnaire also collected the demographic features of the respondents. The reliability and validity of the collected data from the questionnaires are evaluated via Cronbach’s alpha and statistical tests, respectively (Azadeh et al., 2017). The reliability and validity tests are performed in the SPSS® statistical package.
In order to deal with the uncertainty and variability of the collected deterministic data, this study implements a triangular fuzzification approach. Although various types of fuzzy membership functions are introduced in the literature, triangular fuzzy functions are offering the most efficient trade-off between simplicity and accuracy.
260
Table 1. The comprehensive set of proactive safety indicators extracted using literature survey
No. Proactive safety
indicator Definition Supporting references
1 Teamwork The effective and collaborative effort of a group of people who work in the same environment toward common goals.
(Salaheldin and Zain, 2007; Hsu et al., 2008; Jones et al., 2013; Azadeh et al., 2017) 2 Management
commitment
Management commitment indicates the management’s willingness to invest, plan and devotion for improving safety in an organization.
(Fleming, 2001; Kao et al., 2008; Goncalves Filho et al., 2010; Hajmohammad and Vachon, 2014)
3 Information sharing and reporting culture
The willingness of employees to report all the safety issues, unusual events, and near-misses in an organization. Reporting safety issues facilitate awareness in the organization.
(Hudson, 2001; Hsu et al., 2008; Goncalves Filho et al., 2010; Azadeh et al., 2017) 4 Management support
and reward system
Management should encourage employees who follow safety rules and report safety issues in the organization. The reward policy affects information sharing, safety behavior, and awareness, significantly.
(Hsu et al., 2008; Resnick, 2009; Lally, 2015; Probst, 2015; Saracino et al., 2015; Friend and Kohn, 2018)
5 Learning culture Learning culture is the ability of the system to learn from past safety issues in order to respond to future unusual events effectively. It improves the knowledge, competence, and performance of the organization.
(Hsu et al., 2008; Goncalves Filho et al., 2010; Gotcheva et al., 2016; Antonsen, 2017; Azadeh et al., 2017; Håvold et al., 2017) 6 Communication and
awareness
The willingness of the management to communicate its employees all safety-related issues. Hiding the system’s vulnerabilities and failures prevent safety information sharing in the organization and learning culture.
(Kao et al., 2008; Goncalves Filho et al., 2010; Azadeh et al., 2017; Håvold et al., 2017)
7 Safety supervision and audits
Safety supervision indicates the supervisors’ effort in investigating the workplace for safety issues and monitoring employees. Safety audit evaluates the performance of safety programs in the organization.
(Hsu et al., 2008; Kao et al., 2008; Kazaras et al., 2014; Lutchman et al., 2016; Karanikas, 2017)
8 Trust Implementation of safety programs requires cooperation among employees. Employees should be able to depend on each other in preventing accidents. Trust is the key to effective cooperation.
(Goncalves Filho et al., 2010; Curcuruto et al., 2015; Mauriño, 2017)
9 Safety training and preparedness
Safety training is one of the most frequently used activities in improving safety preparedness. It increases the competence of employees in preventing accidents.
(Goncalves Filho et al., 2010; Namian et al., 2016; Mohammadfam et al., 2017; Tapp and Bravo, 2017; Rabbani et al., 2018)
10 Safety attitude and behavior
Creating a blame-free environment in improving safety culture is essential. Employees’ openness about errors along with safety over productivity attitude is basic requirements of safety behavior in an organization.
(Burt et al., 2008; Monazzam and Soltanzadeh, 2009; Nasab et al., 2009; Tam and Fung, 2011)
11 Employee involvement Employees should engage and participate in all safety-related activities and issues. Employees’ involvement in safety analysis and management process provides them with responsibility and accountability which reduces accidents.
(Vredenburgh, 2002; Ariss, 2003; Hsu et al., 2008; Carmeli et al., 2010; Hajmohammad and Vachon, 2014)
261 Step 3. Fuzzy data envelopment analysis (FDEA)
The traditional DEA models were applicable for efficiency analysis of deterministic input and output variables, while in most cases data sets are not deterministic. Considering the vague and subjective nature of safety culture and related collected data, fuzzy programming can be an appropriate choice. This study employs a fuzzy logic based DEA model proposed by Azadeh and Alem (2010). Since all considered safety culture indicators are the larger-the-better type, they are all considered as output variables of the model. As for inputs of the model, a single dummy variable is been considered. The utilized FDEA model for R output variables J input variables , and I DMUs is presented in model (1).
R r ri r 1
Max
u y
(1) J j ji j 1v x
1
R J
r ri j ji
r 1 j 1
u y
v x
0
, ; , ,..., ; , ,..., j r
v u 0 j 1 2 J r 1 2 R
Where
x
jt represents the standardized value of input variable j from DMUi
andy
ri is the standardizedvalue of output variable r from DMU i. Also,
x
jiand
y
ri are the fuzzy variables. Although various typesof fuzzy membership functions are introduced in the literature, triangular fuzzy functions are the most efficient ones due to simplicity and accuracy. In order to transform the model (2) into the triangular fuzzified model, the 𝛼-cut method proposed by Chang and Lee (2012) is used. Lastly, the transformed 𝛼 -cut based FDEA model is presented in model (2).
l,
m,
u
,
l,
m,
u
ji ji ji ji ri ri ri ri
x
x
x
x
y
y
y
y
(2)
,
R
m l m u
r ri ri ri ri
r 1
Max
u
y
1
y
y
1
y
,
J
m l m u
j ji ji ji ji
j 1
v
x
1
x
x
1
x
1
,
,
R Jm l m u m l m u
r ri ri ri ri j ji ji ji ji
r 1 j 1
u
y
1
y
y
1
y
v
x
1
x
x
1
x
0
, ; , ,..., ; , ,..., j r
v u 0 j 1 2 J r 1 2 R
r 1 2, ,...,R
j 1 2, ,...,J
262
Where
u
r represents the weight of output variables, whilev
j is the weight of inputs. The optimum 𝛼-cut is selected based on the highest average efficiency scores from the set of 0.1, 0.25, 0.5, 0.75, and 0.9. Step 4. ANN-based performance optimization algorithm
Many efficiency frontier analysis based approaches are introduced for performance evaluation and optimization of industrial and service-oriented systems in the past decades which were mostly based on DEA models. One of the main restrictive assumptions in DEA based approaches is considering the efficiency frontier deterministic which is sensitive to outliers (Yazdanparast et al., 2018). Azadeh et al. (2007) proposed an artificial neural network based algorithm. It was a non-parametric approach which considered the efficiency frontier stochastic. The authors indicated that such an approach is able to deal with heavy uncertainty and present more reliable results. This study utilized artificial neural networks multi-layer perceptron (ANN-MLP) model for calculating efficiency scores. The steps of the ANN-based performance optimization algorithm are as follows:
1. Data preparation
The collected data for safety culture indicators should be divided into two sets, including a training data set and test data set. The conventional ratio in the literature is 70% for training data set, however, we examine other ratios including 60% and 80% in order to find the optimum ANN-MLP structure.
2. Parameter tuning
The optimum ANN structure is determined based on the mean absolute percentage error (MAPE). In this regard, various ANN-MLP structures are evaluated using the different data set ratios (60%, 70%, and 80%). This procedure is called random search method. The search for optimum ANN structure continues until the MAPE reaches the acceptable error which is considered equal to 5%. In order to prevent overtraining in determining the optimum ANN structure and predicting the efficiency scores, repeated random sub-sampling validation method is used. In this method, the selected data for each data set is randomly changed and each structure is tested with 100 different data sets. The reported MAPE of each structure is actually the mean of 100 runs. This method is a known cross-validation method for problems with small available observations (Nasiri et al., 2017).
3. Efficiency calculation
In order to calculate efficiency scores and obtain stochastic efficiency frontier the following calculation should be done:
𝐸
𝑖𝑟= 𝑂
𝑟𝑒𝑎𝑙(𝑖𝑟)− 𝑂
𝐴𝑁𝑁(𝑖𝑟)(𝑟 = 1, … , 𝑅 𝑎𝑛𝑑 𝑖 = 1, … , 𝐼)
(3)
𝐸
𝑖𝑟′= (𝐸
𝑖𝑟
/𝑂
𝐴𝑁𝑁(𝑖𝑟)) (𝑟 = 1, … , 𝑅 𝑎𝑛𝑑 𝑖 = 1, … , 𝐼)
(4)
𝐸
𝑘= max(𝐸
𝑟′)
(5)
𝑆ℎ
𝑖𝑟= 𝐸
𝑘∗
𝑂
𝐴𝑁𝑁(𝑖𝑟)𝑂
𝐴𝑁𝑁(𝑖𝑘)(𝑟 = 1, … , 𝑅 𝑎𝑛𝑑 𝑖 = 1, … , 𝐼)
(6)
𝐹
𝑖𝑟= 𝑃
𝑖𝑟/(𝑂
𝐴𝑁𝑁(𝑖𝑟)+ 𝑆ℎ
𝑖𝑟)
(7)
𝐹̅
𝑖=
∑
𝐹
𝑖𝑟𝑅 𝑟=1
𝐽
(8)
Where 𝑂𝑟𝑒𝑎𝑙(𝑖𝑟) is the real value of rth output variable from ith respondent, while 𝑂𝐴𝑁𝐹𝐼𝑆(𝑖𝑟)
263
the error between the real and predicted values. Equation (4) calculates the relative error while 𝐸𝑘′
represents the maximum relative error. Equation (5) calculates the shift frontier function for output variable r. The calculated efficiency scores for each output variable r are calculated in equation (7). Lastly, equation (8) presents the final efficiency scores of each DMU i. MATLAB V.2014 is used for running ANN-MLP different structures in this study. Appendix A presents the related MATLAB codes.
Step 5. Hybrid efficiency frontier
Obtaining a system’s map of efficiency plays an important role in the accuracy of its performance optimization. Considering the subjective nature of safety culture indicators and its related uncertainty, in order to obtain an accurate map of efficiency, a reliable efficiency frontier approach is needed. This study proposed a unique efficiency frontier approach which utilizes the advantages of both DEA based models in the fuzzy environment with deterministic efficiency frontier and ANN-based models with stochastic efficiency frontier. In this regard, in order to calculate the hybrid map of the efficiency of safety culture in the considered case study, the mean efficiencies of the obtained results in Steps 4 and 5 are calculated. Step 6. Sensitivity analysis
In order to perform the real-time performance evaluation of proactive safety indicators in the proposed framework using efficiency frontier analysis, first, the efficiency scores of the DMUs considering all input and output variables are calculated. The obtained efficiency scores depict the efficiency map of the considered system. Then, each variable is eliminated from the model once, and the efficiency scores are recalculated. The non-existence of the eliminated variable causes changes in the obtained efficiency scores and the efficiency map of the system. Comparing the obtained efficiency scores before and after the elimination of each variable from the model using statistical methods determines the real-time performance of the eliminated variable. The obtained results indicate the real-time status of each variable which can be Normal, Negative, or Positive. The safety managers can design improvement plans based on the obtained results in order to optimize the proactive safety through implementing safety culture.
3- Case study: a real-life petrochemical plant
Oil, gas, and petrochemical industries play an important role in the economy of Iran. National Iranian Oil Company (NIOC) is been in charge of all oil, gas and petrochemical policies in Iran, since 1951. Accessibility to the vast amount of oil and gas resources has made NIOC one of the largest oil companies in the world. Although Iran has a unique position in terms of oil and gas reserves in the world, its infrastructures are old. Besides, safety management practices are not adequate. These factors resulted in many safety issues and accidents which are threatening sixteen million workers in Iran. The Ministry of Health and Medical Education is responsible for the occupational health and safety (OHS) services and legislation, while the Ministry of Labour and Social Affair enacts and enforces the legal issues. According to this procedure, inspectorates from various ministries monitor health and safety regulations in industries (Vigeh et al., 2011). Although many efforts have been made, annual reports don’t reflect accidents reduction especially in safety-critical industries in the past decade. Proactive safety practices are the missing key to create a safety culture and to reduce accidents in safety-critical industries in Iran. This study proposes a real-time framework for performance optimization of safety culture indicators in safety-critical industries.
3-1- Data collection
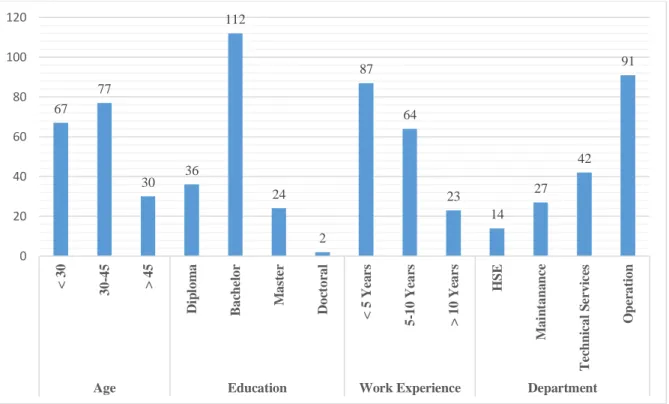
In order to demonstrate the application of the proposed framework, a real-life petrochemical plant in Iran is considered in this section. Shiraz Petrochemical Company was founded in 1959. It produces around 1,850,000 tons of various chemical and petrochemical products per year and is one of the major petrochemical plants in Iran. In order to collect the required data, the designed questionnaire based on the identified safety culture indicators is distributed among 210 employees of four different departments,
264
including Health, Safety, and Environment (HSE), Technical Services, Maintenance, and Operation departments. After distributing the questionnaires, 174 completed questionnaires are collected. Figure 2 demonstrates the demographic features of the respondents. The reliability and validity of the collected data are evaluated in table 2.
Fig 2. The demographic features of questionnaires respondents in the considered case study
Table 2. The obtained results for the reliability and validity of the collected data
Indicators Cronbach’s alpha 2 Sample t-test P-value
Teamwork 0.842 0.135
Management commitment 0.742 0.097
Information sharing and reporting culture 0.647 0.218
Management support and reward system 0.842 0.188
Learning culture 0.727 0.370
Communication and awareness 0.694 0.239
Safety supervision and audits 0.801 0.113
Trust 0.783 0.146
Safety training and preparedness 0.728 0.286
Safety attitude and behavior 0.786 0.312
Employee involvement 0.942 0.255
Note; In order to demonstrate the validity of the collected data two random samples are extracted from collected data for each indicator. 2 sample t-test is employed for comparing the mean of the collected samples. If the means of both random samples are equal, there is no significant difference between means. Therefore, the validity of the collected data for the considered indicator is acceptable (Confidence level is 95%).
67 77 30 36 112 24 2 87 64 23 14 27 42 91 0 20 40 60 80 100 120 < 30 30-45 > 45 D ip lom a B ac h el or M as te r D oc tor al < 5 Y ea rs 5-10 Y ear s > 10 Y ear s H S E M ai n tana nc e T ec h n ic al S er vi ce s O p er at ion
265
Fuzzification of the collected data is performed based on equations (9-14).
l , m, u
,
l , m, u
ji ji ji ji ri ri ri ri
x x x x y y y y
; , ,..., lji ji
x Min x i 1 2 I (9)
; , ,..., m
ji ji
x x i 1 2 I (10)
; , ,..., uji ji
x Max x i 1 2 I (11)
; , ,..., lri ri
y Min y i 1 2 I (12)
;
, ,...,
mri ri
y
y
i
1 2
I
(13)
; , ,...,u u
ri ri
y Max y i 1 2 I (14)
Where xuji is the maximum value of input j for all DMUs
i 1 2, ,...,I
, while l jix is the minimum value of input j for all DMUs
i 1 2, ,...,I
. Also,y
uri is the maximum value of output r for all DMUs
i 1 2, ,...,I
, whiley
ril is the minimum value of output r for all DMUs
i 1 2, ,...,I
.3-2- FDEA results
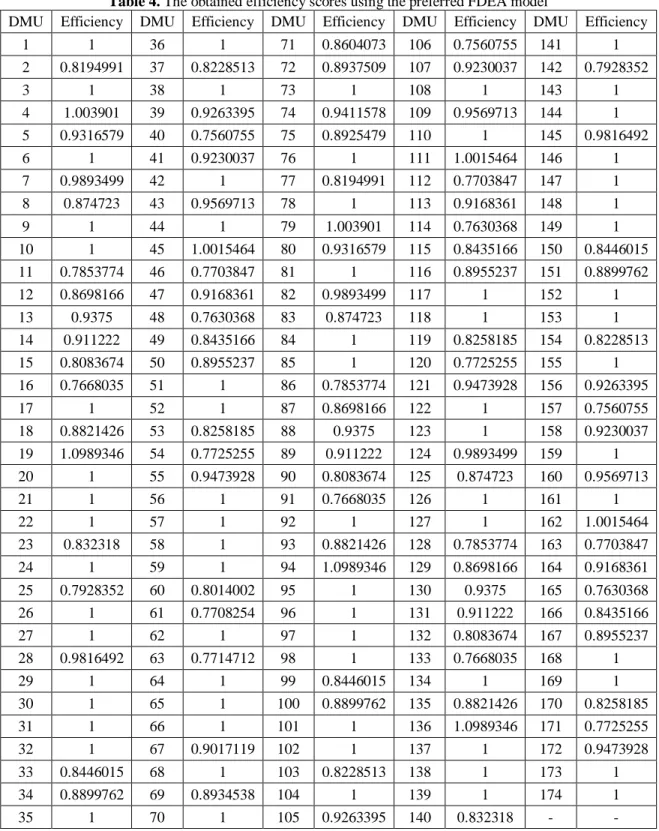
In order to use the presented FDEA model (model (1)), first, the optimum α-cut should be determined. The optimum α-cut for the FDEA model is determined based on the highest average efficiency of DMUs and normality of the obtained results (Heidari et al., 2017). Therefore, the efficiency scores are calculated with candidate α-cuts, including 0.1, 0.25, 0.5, 0.75, and 0.9. All FDEA calculations in this study are performed using AutoAssess package (Azadeh, 2007). According to the obtained results presented in table 3, the optimum α-cut is 0.1. The calculated efficiency scores using the optimum α-cut is presented in table 4.
Table 3. The obtained results for determination of FDEA optimum 𝛼-cut
Model FDEA (α=0.1) FDEA (α=0.25) FDEA (α=0.5) FDEA (α=0.75) FDEA (α=0.9) Distribution Companies’ trust model Mean efficiency: 0.929841 P-value of normality test: <0.005 Mean efficiency: 0.890472 P-value of normality test: <0.005 Mean efficiency: 0.875643 P-value of normality test: <0.005 Mean efficiency: 0.843109 P-value of normality test: <0.005 Mean efficiency: 0.804241 P-value of normality test: <0.005
266
Table 4. The obtained efficiency scores using the preferred FDEA model
DMU Efficiency DMU Efficiency DMU Efficiency DMU Efficiency DMU Efficiency
1 1 36 1 71 0.8604073 106 0.7560755 141 1
2 0.8194991 37 0.8228513 72 0.8937509 107 0.9230037 142 0.7928352
3 1 38 1 73 1 108 1 143 1
4 1.003901 39 0.9263395 74 0.9411578 109 0.9569713 144 1 5 0.9316579 40 0.7560755 75 0.8925479 110 1 145 0.9816492
6 1 41 0.9230037 76 1 111 1.0015464 146 1
7 0.9893499 42 1 77 0.8194991 112 0.7703847 147 1
8 0.874723 43 0.9569713 78 1 113 0.9168361 148 1
9 1 44 1 79 1.003901 114 0.7630368 149 1
10 1 45 1.0015464 80 0.9316579 115 0.8435166 150 0.8446015 11 0.7853774 46 0.7703847 81 1 116 0.8955237 151 0.8899762
12 0.8698166 47 0.9168361 82 0.9893499 117 1 152 1
13 0.9375 48 0.7630368 83 0.874723 118 1 153 1
14 0.911222 49 0.8435166 84 1 119 0.8258185 154 0.8228513
15 0.8083674 50 0.8955237 85 1 120 0.7725255 155 1
16 0.7668035 51 1 86 0.7853774 121 0.9473928 156 0.9263395
17 1 52 1 87 0.8698166 122 1 157 0.7560755
18 0.8821426 53 0.8258185 88 0.9375 123 1 158 0.9230037
19 1.0989346 54 0.7725255 89 0.911222 124 0.9893499 159 1 20 1 55 0.9473928 90 0.8083674 125 0.874723 160 0.9569713
21 1 56 1 91 0.7668035 126 1 161 1
22 1 57 1 92 1 127 1 162 1.0015464
23 0.832318 58 1 93 0.8821426 128 0.7853774 163 0.7703847
24 1 59 1 94 1.0989346 129 0.8698166 164 0.9168361
25 0.7928352 60 0.8014002 95 1 130 0.9375 165 0.7630368
26 1 61 0.7708254 96 1 131 0.911222 166 0.8435166
27 1 62 1 97 1 132 0.8083674 167 0.8955237
28 0.9816492 63 0.7714712 98 1 133 0.7668035 168 1
29 1 64 1 99 0.8446015 134 1 169 1
30 1 65 1 100 0.8899762 135 0.8821426 170 0.8258185
31 1 66 1 101 1 136 1.0989346 171 0.7725255
32 1 67 0.9017119 102 1 137 1 172 0.9473928
33 0.8446015 68 1 103 0.8228513 138 1 173 1
34 0.8899762 69 0.8934538 104 1 139 1 174 1
35 1 70 1 105 0.9263395 140 0.832318 - -
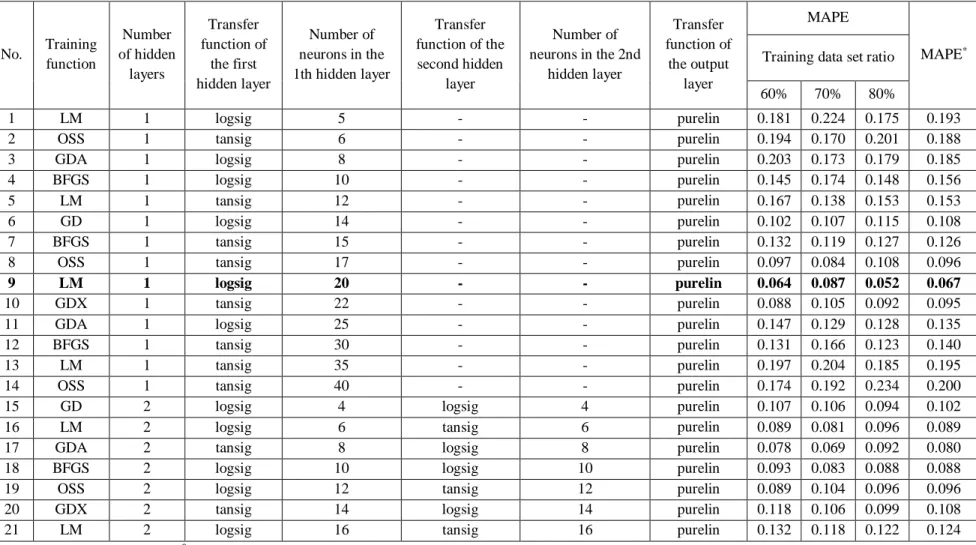
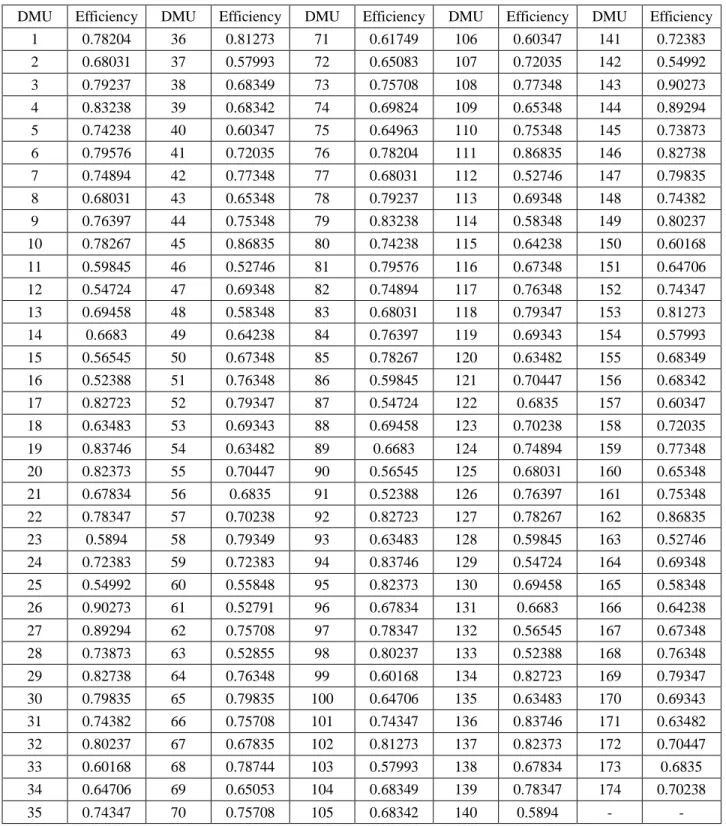
3-3- ANN results
In order to determine the optimum ANN-MLP structure, various structures are identified and investigated in Table 5. The obtained results indicate structure number 9 presents the least MAPE. The steps of ANN-based algorithm using the determined optimum ANN-MLP structure is used to calculate
267
the efficiency scores. The calculated efficiency scores using the optimum ANN-MLP structure is presented in table 6.
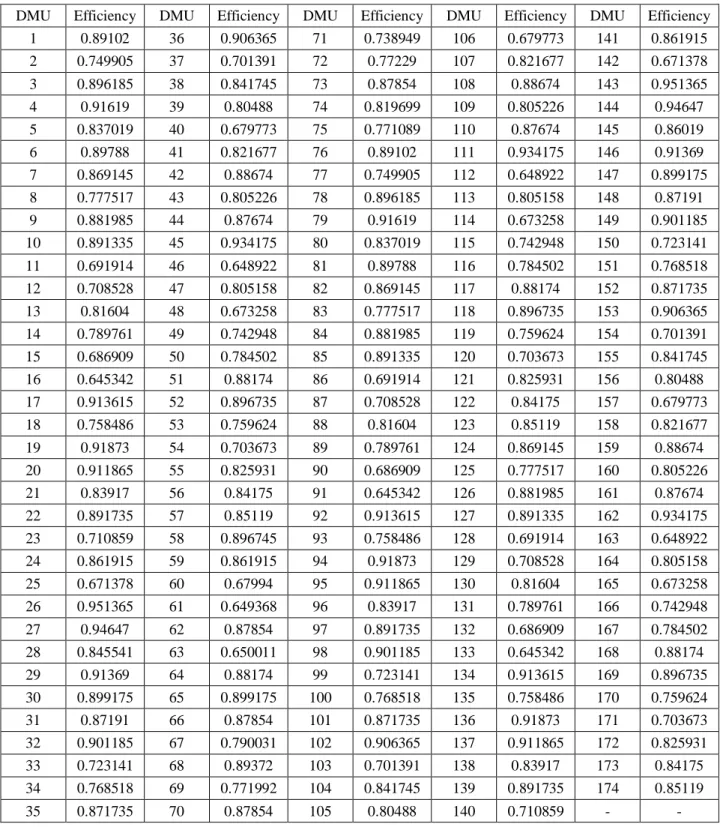
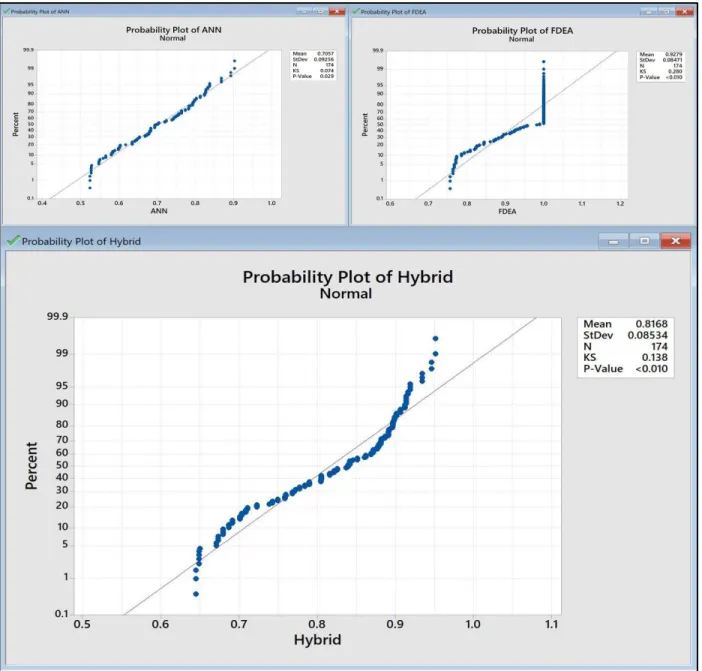
3-4- Hybrid efficiency scores
The final hybrid efficiency scores are calculated based on both obtained sets of efficiency scores using FDEA and ANN. The hybrid efficiency scores are profited by the advantages of both FDEA and ANN models. According to the statistical tests in Figure 3, the obtained hybrid scores are less biased than FDEA scores. On the other hand, the obtained hybrid scores present higher efficiency scores than ANN scores. Therefore, the calculated hybrid scores depict a more reliable map of efficiency for the considered problem.
268
Table 5. The performance of different structures of ANN-MLP
No. Training function
Number of hidden
layers
Transfer function of
the first hidden layer
Number of neurons in the 1th hidden layer
Transfer function of the second hidden
layer
Number of neurons in the 2nd
hidden layer
Transfer function of
the output layer
MAPE
MAPE*
Training data set ratio
60% 70% 80%
1 LM 1 logsig 5 - - purelin 0.181 0.224 0.175 0.193
2 OSS 1 tansig 6 - - purelin 0.194 0.170 0.201 0.188
3 GDA 1 logsig 8 - - purelin 0.203 0.173 0.179 0.185
4 BFGS 1 logsig 10 - - purelin 0.145 0.174 0.148 0.156
5 LM 1 tansig 12 - - purelin 0.167 0.138 0.153 0.153
6 GD 1 logsig 14 - - purelin 0.102 0.107 0.115 0.108
7 BFGS 1 tansig 15 - - purelin 0.132 0.119 0.127 0.126
8 OSS 1 tansig 17 - - purelin 0.097 0.084 0.108 0.096
9 LM 1 logsig 20 - - purelin 0.064 0.087 0.052 0.067
10 GDX 1 tansig 22 - - purelin 0.088 0.105 0.092 0.095
11 GDA 1 logsig 25 - - purelin 0.147 0.129 0.128 0.135
12 BFGS 1 tansig 30 - - purelin 0.131 0.166 0.123 0.140
13 LM 1 tansig 35 - - purelin 0.197 0.204 0.185 0.195
14 OSS 1 tansig 40 - - purelin 0.174 0.192 0.234 0.200
15 GD 2 logsig 4 logsig 4 purelin 0.107 0.106 0.094 0.102
16 LM 2 logsig 6 tansig 6 purelin 0.089 0.081 0.096 0.089
17 GDA 2 tansig 8 logsig 8 purelin 0.078 0.069 0.092 0.080
18 BFGS 2 logsig 10 logsig 10 purelin 0.093 0.083 0.088 0.088
19 OSS 2 logsig 12 tansig 12 purelin 0.089 0.104 0.096 0.096
20 GDX 2 tansig 14 logsig 14 purelin 0.118 0.106 0.099 0.108
21 LM 2 logsig 16 tansig 16 purelin 0.132 0.118 0.122 0.124
Note; The last column, MAPE*, is equal to the mean of MAPE for considered training data set ratios.
LM: Levenberg-Marquardt back propagation; BFG: quasi-Newton back propagation; GD: Gradient descent back-propagation; GDA: Gradient descent with adaptive learning rule back propagation; OSS: One step secant back propagation; GDX: Gradient descent with momentum and adaptive learning rule back-propagation.
269
Table 6. The obtained efficiency scores using the optimum ANN-MLP structure
DMU Efficiency DMU Efficiency DMU Efficiency DMU Efficiency DMU Efficiency
1 0.78204 36 0.81273 71 0.61749 106 0.60347 141 0.72383
2 0.68031 37 0.57993 72 0.65083 107 0.72035 142 0.54992
3 0.79237 38 0.68349 73 0.75708 108 0.77348 143 0.90273
4 0.83238 39 0.68342 74 0.69824 109 0.65348 144 0.89294
5 0.74238 40 0.60347 75 0.64963 110 0.75348 145 0.73873
6 0.79576 41 0.72035 76 0.78204 111 0.86835 146 0.82738
7 0.74894 42 0.77348 77 0.68031 112 0.52746 147 0.79835
8 0.68031 43 0.65348 78 0.79237 113 0.69348 148 0.74382
9 0.76397 44 0.75348 79 0.83238 114 0.58348 149 0.80237
10 0.78267 45 0.86835 80 0.74238 115 0.64238 150 0.60168
11 0.59845 46 0.52746 81 0.79576 116 0.67348 151 0.64706
12 0.54724 47 0.69348 82 0.74894 117 0.76348 152 0.74347
13 0.69458 48 0.58348 83 0.68031 118 0.79347 153 0.81273
14 0.6683 49 0.64238 84 0.76397 119 0.69343 154 0.57993
15 0.56545 50 0.67348 85 0.78267 120 0.63482 155 0.68349
16 0.52388 51 0.76348 86 0.59845 121 0.70447 156 0.68342
17 0.82723 52 0.79347 87 0.54724 122 0.6835 157 0.60347
18 0.63483 53 0.69343 88 0.69458 123 0.70238 158 0.72035
19 0.83746 54 0.63482 89 0.6683 124 0.74894 159 0.77348
20 0.82373 55 0.70447 90 0.56545 125 0.68031 160 0.65348
21 0.67834 56 0.6835 91 0.52388 126 0.76397 161 0.75348
22 0.78347 57 0.70238 92 0.82723 127 0.78267 162 0.86835
23 0.5894 58 0.79349 93 0.63483 128 0.59845 163 0.52746
24 0.72383 59 0.72383 94 0.83746 129 0.54724 164 0.69348
25 0.54992 60 0.55848 95 0.82373 130 0.69458 165 0.58348
26 0.90273 61 0.52791 96 0.67834 131 0.6683 166 0.64238
27 0.89294 62 0.75708 97 0.78347 132 0.56545 167 0.67348
28 0.73873 63 0.52855 98 0.80237 133 0.52388 168 0.76348
29 0.82738 64 0.76348 99 0.60168 134 0.82723 169 0.79347
30 0.79835 65 0.79835 100 0.64706 135 0.63483 170 0.69343
31 0.74382 66 0.75708 101 0.74347 136 0.83746 171 0.63482
32 0.80237 67 0.67835 102 0.81273 137 0.82373 172 0.70447
33 0.60168 68 0.78744 103 0.57993 138 0.67834 173 0.6835
34 0.64706 69 0.65053 104 0.68349 139 0.78347 174 0.70238
270
Table 7. The calculated hybrid efficiency scores
DMU Efficiency DMU Efficiency DMU Efficiency DMU Efficiency DMU Efficiency
1 0.89102 36 0.906365 71 0.738949 106 0.679773 141 0.861915
2 0.749905 37 0.701391 72 0.77229 107 0.821677 142 0.671378
3 0.896185 38 0.841745 73 0.87854 108 0.88674 143 0.951365
4 0.91619 39 0.80488 74 0.819699 109 0.805226 144 0.94647
5 0.837019 40 0.679773 75 0.771089 110 0.87674 145 0.86019
6 0.89788 41 0.821677 76 0.89102 111 0.934175 146 0.91369
7 0.869145 42 0.88674 77 0.749905 112 0.648922 147 0.899175
8 0.777517 43 0.805226 78 0.896185 113 0.805158 148 0.87191
9 0.881985 44 0.87674 79 0.91619 114 0.673258 149 0.901185
10 0.891335 45 0.934175 80 0.837019 115 0.742948 150 0.723141
11 0.691914 46 0.648922 81 0.89788 116 0.784502 151 0.768518
12 0.708528 47 0.805158 82 0.869145 117 0.88174 152 0.871735
13 0.81604 48 0.673258 83 0.777517 118 0.896735 153 0.906365
14 0.789761 49 0.742948 84 0.881985 119 0.759624 154 0.701391 15 0.686909 50 0.784502 85 0.891335 120 0.703673 155 0.841745
16 0.645342 51 0.88174 86 0.691914 121 0.825931 156 0.80488
17 0.913615 52 0.896735 87 0.708528 122 0.84175 157 0.679773
18 0.758486 53 0.759624 88 0.81604 123 0.85119 158 0.821677
19 0.91873 54 0.703673 89 0.789761 124 0.869145 159 0.88674
20 0.911865 55 0.825931 90 0.686909 125 0.777517 160 0.805226
21 0.83917 56 0.84175 91 0.645342 126 0.881985 161 0.87674
22 0.891735 57 0.85119 92 0.913615 127 0.891335 162 0.934175
23 0.710859 58 0.896745 93 0.758486 128 0.691914 163 0.648922
24 0.861915 59 0.861915 94 0.91873 129 0.708528 164 0.805158
25 0.671378 60 0.67994 95 0.911865 130 0.81604 165 0.673258
26 0.951365 61 0.649368 96 0.83917 131 0.789761 166 0.742948
27 0.94647 62 0.87854 97 0.891735 132 0.686909 167 0.784502
28 0.845541 63 0.650011 98 0.901185 133 0.645342 168 0.88174
29 0.91369 64 0.88174 99 0.723141 134 0.913615 169 0.896735
30 0.899175 65 0.899175 100 0.768518 135 0.758486 170 0.759624
31 0.87191 66 0.87854 101 0.871735 136 0.91873 171 0.703673
32 0.901185 67 0.790031 102 0.906365 137 0.911865 172 0.825931
33 0.723141 68 0.89372 103 0.701391 138 0.83917 173 0.84175
34 0.768518 69 0.771992 104 0.841745 139 0.891735 174 0.85119
271
Fig 3. The superiority of the proposed hybrid framework
3-5- Sensitivity analysis
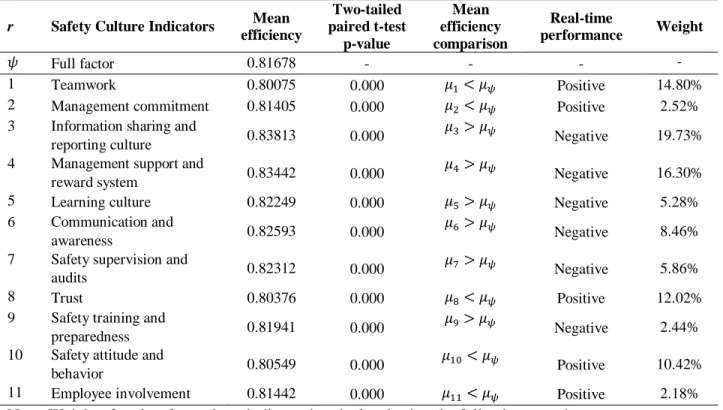
In this step, the real-time performance of each safety culture indicator in the considered case study is demonstrated. In this regard, sensitivity analysis is applied. The obtained results can help safety managers to improve proactive safety through the safety culture. The obtained results also indicate the weight of each safety culture indicator which can help decision makers in determining the priorities. The obtained sensitivity analysis results are presented in table 8.
272
Table 8. The obtained sensitivity analysis results
r Safety Culture Indicators Mean efficiency Two-tailed paired t-test p-value Mean efficiency comparison Real-time
performance Weight
𝜓 Full factor 0.81678 - - - -
1 Teamwork 0.80075 0.000 𝜇1< 𝜇𝜓 Positive 14.80%
2 Management commitment 0.81405 0.000 𝜇2< 𝜇𝜓 Positive 2.52%
3 Information sharing and
reporting culture 0.83813 0.000
𝜇3> 𝜇𝜓
Negative 19.73% 4 Management support and
reward system 0.83442 0.000
𝜇4> 𝜇𝜓
Negative 16.30%
5 Learning culture 0.82249 0.000 𝜇5> 𝜇𝜓 Negative 5.28%
6 Communication and
awareness 0.82593 0.000
𝜇6> 𝜇𝜓
Negative 8.46% 7 Safety supervision and
audits 0.82312 0.000
𝜇7> 𝜇𝜓
Negative 5.86%
8 Trust 0.80376 0.000 𝜇8< 𝜇𝜓 Positive 12.02%
9 Safety training and
preparedness 0.81941 0.000
𝜇9> 𝜇𝜓
Negative 2.44% 10 Safety attitude and
behavior 0.80549 0.000
𝜇10< 𝜇𝜓
Positive 10.42%
11 Employee involvement 0.81442 0.000 𝜇11< 𝜇𝜓 Positive 2.18%
Note; Weight of each safety culture indicator is calculated using the following equation: Weight𝑟=
|𝜇𝑟− 𝜇𝜓|
𝜇𝜓
∗ 100 (15)
4- Managerial discussions and insights
The proposed real-time performance evaluation framework investigated the current status of the safety culture indicators in Shiraz Petrochemical Company. In this section, managerial insights and management decisions are described based on the obtained results in the previous section. First, it should be noted that all of the presented discussions in this section are limited to the considered case study. The obtained results indicate that the real-time impact of “Teamwork”, “Management commitment”, “Trust”, “Safety attitude and behavior”, and “Employee involvement” is positive. However, the other considered safety culture indicators including “Information sharing and reporting culture”, “Management support and reward system”, “Learning culture”, “Communication and awareness”, “Safety supervision and audits”, and “Safety training and preparedness” have a negative impact. The calculated weights for negative and positive safety culture indicators can help managers in prioritizing the correction plants to improve proactive safety. In this regard, Figure 4 demonstrates the weight of safety culture indicators.
As depicted in figure 4, “Teamwork”, “Trust”, and “Safety attitude and behavior” are the most significant safety culture indicators with positive impact. In other words, employees’ interpersonal relationships with each other are quite great. They also mind about safety issues and follow safety procedures. On the other hand, “Information sharing and reporting culture” and “Management support and reward system” have the highest negative impacts in the considered case study. The obtained results suggest that managers should facilitate information sharing and design a reward system for reporting safety issues. It should be noted, the low level of reporting culture and information sharing results in a low level of learning culture in the long run. Therefore, it is extremely important to encourage employees to report safety issues. According to figure 5, the obtained results also indicate that the Operation Department has the lowest mean of efficiency which results in lowest proactive safety performance. On
273
the other hand, HSE has the best real-time performance among departments. Therefore, planning correction plans in the Operation Department has the highest priority.
274
Fig 5. The real-time performance of safety culture in the considered departments
5- Conclusion
Safety is of paramount importance in oil and gas industry plants such as petrochemical plants where the consequences of failure may be catastrophic. In such systems, building a proactive safety culture is crucial. The current study proposed a real-time framework for performance evaluation of proactive safety culture in safety-critical industries. Proactive safety culture indicators were extracted from the literature using a comprehensive literature review. The proposed framework is able to evaluate the real-time performance of any safety-critical industry and determines the current status of each indicator. The obtained results can help safety managers to improve the proactive safety culture of the organization. They also can use the presented framework for periodic safety evaluations and determine the effectiveness of the implemented correction plans. The application of fuzzy logic along with stochastic efficiency frontier analysis has empowered the proposed hybrid framework to deal with deep uncertainty, and result in more reliable findings.
Acknowledgements
This research was supported by the Natural Science Foundation of Shanghai (15ZR1401600). The authors have no competing interests to declare.
References
Antonsen, Stian. (2017). Safety culture: theory, method and improvement: CRC Press.
Ariss, Sonny S, (2003). 'Employee involvement to improve safety in the workplace: An ethical imperative'. American journal of business, 18(2), 9-16.
Azadeh, A, (2007). 'Auto Assess Software and Manual'. Departement of Industrial Engineering, University of Tehran, Iran.
Azadeh, A, Ghaderi, SF, Anvari, M, & Saberi, M, (2007). 'Performance assessment of electric power generations using an adaptive neural network algorithm'. Energy Policy, 35(6), 3155-3166.
0.88410
0.87446 0.86946
0.76499
0.70000 0.72000 0.74000 0.76000 0.78000 0.80000 0.82000 0.84000 0.86000 0.88000 0.90000
HSE Technical Services Maintanance Operation
M
ea
n
E
ff
ic
ie
n
cy
Department
275
Azadeh, Ali, & Alem, Seyed Mostafa, (2010). 'A flexible deterministic, stochastic and fuzzy Data Envelopment Analysis approach for supply chain risk and vendor selection problem: Simulation analysis'.
Expert Systems with Applications, 37(12), 7438-7448.
Azadeh, Ali, Shafiee, Farideh, Yazdanparast, Reza, Heydari, Jafar, & Keshvarparast, Ali, (2017). 'Optimum Integrated Design of Crude Oil Supply Chain by a Unique Mixed Integer Nonlinear Programming Model'. Industrial & Engineering Chemistry Research, 56(19), 5734-5746.
Booth, RT, & Lee, TR, (1995). 'The role of human factors and safety culture in safety management'.
Proceedings of the Institution of Mechanical Engineers, part B: Journal of Engineering manufacture, 209(5), 393-400.
Burns, Catherine M, (2006). 'Towards proactive monitoring in the petrochemical industry'. Safety science, 44(1), 27-36.
Burt, Christopher DB, Sepie, Bridgit, & McFadden, Gretchen, (2008). 'The development of a considerate and responsible safety attitude in work teams'. Safety science, 46(1), 79-91.
Carmeli, Abraham, Reiter-Palmon, Roni, & Ziv, Enbal, (2010). 'Inclusive leadership and employee involvement in creative tasks in the workplace: The mediating role of psychological safety'. Creativity
Research Journal, 22(3), 250-260.
Casey, Tristan, Griffin, Mark A, Flatau Harrison, Huw, & Neal, Andrew, (2017). 'Safety climate and culture: Integrating psychological and systems perspectives'. Journal of occupational health psychology, 22(3), 341.
Chang, Ping-Teng, & Lee, Jung-Hua, (2012). 'A fuzzy DEA and knapsack formulation integrated model for project selection'. Computers & Operations Research, 39(1), 112-125.
Chen, Jenq-Renn, & Yang, Yao-Tai, (2004). 'A predictive risk index for safety performance in process industries'. Journal of Loss Prevention in the Process Industries, 17(3), 233-242.
Curcuruto, Matteo, Conchie, Stacey M, Mariani, MG, & Violante, FS, (2015). 'The role of prosocial and proactive safety behaviors in predicting safety performance'. Safety science, 80, 317-323.
Fleming, M. (2001). Safety Culture Maturity Model. Report 2000/049. Health and Safety Executive. Colegate, Norwich.
Flin, Rhona, (2007). 'Measuring safety culture in healthcare: A case for accurate diagnosis'. Safety
science, 45(6), 653-667.
Friend, Mark A, & Kohn, James P. (2018). Fundamentals of occupational safety and health: Rowman & Littlefield.
Glendon, Aleck Ian, & Stanton, Neville A, (2000). 'Perspectives on safety culture'. Safety science, 34(1), 193-214.
Goncalves Filho, Anastacio Pinto, Andrade, Jose Celio Silveira, & de Oliveira Marinho, Marcia Mara, (2010). 'A safety culture maturity model for petrochemical companies in Brazil'. Safety science, 48(5), 615-624.
276
Goncalves Filho, Anastacio Pinto, & Waterson, Patrick, (2018). 'Maturity models and safety culture: A critical review'. Safety science, 105, 192-211.
Gotcheva, Nadezhda, Oedewald, Pia, Wahlström, Mikael, Macchi, Luigi, Osvalder, Anna-Lisa, & Alm, Håkan, (2016). 'Cultural features of design and shared learning for safety: A Nordic nuclear industry perspective'. Safety science, 81, 90-98.
Grote, Gudela, (2008). 'Diagnosis of safety culture: A replication and extension towards assessing “safe” organizational change processes'. Safety science, 46(3), 450-460.
Hajmohammad, Sara, & Vachon, Stephan, (2014). 'Safety culture: A catalyst for sustainable development'. Journal of business ethics, 123(2), 263-281.
Halligan, Michelle, & Zecevic, Aleksandra, (2011). 'Safety culture in healthcare: a review of concepts, dimensions, measures and progress'. BMJ quality & safety, bmjqs. 2010.040964.
Håvold, Jon Ivar, Ghulam, Mustafa, & Ashraf, Nadia. (2017). Safety culture in a shipping company.
Evidence from two surveys 13 years apart. Paper presented at the Prevention of Accidents at Work:
Proceedings of the 9th International Conference on the Prevention of Accidents at Work (WOS 2017). Heidari, Razieh, Tavakkoli-Moghaddam, Reza, Yazdanparast, Reza, & Aliabadi, Leyla, (2017). 'A fuzzy data envelopment analysis for the supply chain resilience assessment: An Iranian car manufacturer'.
Recent Applications of Data Envelopment Analysis, 978(1), 122.
Hellings, Johan, Schrooten, Ward, Klazinga, Niek, & Vleugels, Arthur, (2007). 'Challenging patient safety culture: survey results'. International journal of health care quality assurance, 20(7), 620-632. Hsu, Shang Hwa, Lee, Chun-Chia, Wu, Muh-Cherng, & Takano, Kenichi, (2008). 'A cross-cultural study of organizational factors on safety: Japanese vs. Taiwanese oil refinery plants'. Accident Analysis &
Prevention, 40(1), 24-34.
Hudson, Patrick, (2001). 'Aviation safety culture'. Safeskies, 1, 23.
Jiang, Lixin, Lavaysse, Lindsey M, & Probst, Tahira M, (2019). 'Safety climate and safety outcomes: A meta-analytic comparison of universal vs. industry-specific safety climate predictive validity'. Work & Stress, 33(1), 41-57.
Jones, Florence, Podila, Pradeep, & Powers, Cynthia, (2013). 'Creating a culture of safety in the emergency department: the value of teamwork training'. Journal of Nursing Administration, 43(4), 194-200.
Kao, Chen‐Shan, Lai, Wei Hung, Chuang, Tien Fu, & Lee, Jin‐Chuan, (2008). 'Safety culture factors, group differences, and risk perception in five petrochemical plants'. Process Safety Progress, 27(2), 145-152.
Karanikas, Nektarios, (2017). 'Evaluating the horizontal alignment of safety management activities through cross-reference of data from safety audits, meetings and investigations'. Safety science, 98, 37-49. Kazaras, Konstantinos, Kontogiannis, Tom, & Kirytopoulos, Konstantinos, (2014). 'Proactive assessment of breaches of safety constraints and causal organizational breakdowns in complex systems: A joint STAMP–VSM framework for safety assessment'. Safety science, 62, 233-247.
277
Lally, Siobhan, (2015). 'Designing Safety Incentive Programs That Work'. Professional Safety, 60(12), 20.
Lutchman, Chitram, Ghanem, Waddah, & Maharaj, Rohanie. (2016). Safety management: A
comprehensive approach to developing a sustainable system: CRC Press.
Martínez-Córcoles, Mario, Gracia, Francisco, Tomás, Inés, & Peiró, José M, (2011). 'Leadership and employees’ perceived safety behaviours in a nuclear power plant: A structural equation model'. Safety
science, 49(8-9), 1118-1129.
Mauriño, Daniel E. (2017). Proactive safety culture: Do we need human factors? Paper presented at the Aviation Resource Management: Proceedings of the Fourth Australian Aviation Psychology Symposium: v. 1.
Mearns, Kathryn J, & Flin, Rhona, (1999). 'Assessing the state of organizational safety—culture or climate?'. Current Psychology, 18(1), 5-17.
Mohammadfam, Iraj, Kamalinia, Mojtaba, Momeni, Mansour, Golmohammadi, Rostam, Hamidi, Yadollah, & Soltanian, Alireza, (2017). 'Evaluation of the quality of occupational health and safety management systems based on key performance indicators in certified organizations'. Safety and health at
work, 8(2), 156-161.
Monazzam, MR, & Soltanzadeh, A, (2009). 'The relationship between the worker's safety attitude and the registered accidents'. Journal of research in health sciences, 9(1), 17-20.
Namian, Mostafa, Albert, Alex, Zuluaga, Carlos M, & Jaselskis, Edward J, (2016). 'Improving hazard-recognition performance and safety training outcomes: Integrating strategies for training transfer'. Journal
of Construction Engineering and Management, 142(10), 04016048.
Nasab, H Sanaei, Tavakoli, R, Ghofranipour, F, Kazemnejad, A, & Khavanin, A, (2009). 'Evaluation of knowledge, attitude and behavior of workers towards occupational health and safety'. Iranian Journal of
Public Health, 38(2), 125-129.
Nasiri, Mohammad Mahdi, Yazdanparast, Reza, & Jolai, Fariborz, (2017). 'A simulation optimisation approach for real-time scheduling in an open shop environment using a composite dispatching rule'.
International Journal of Computer Integrated Manufacturing, 30(12), 1239-1252.
doi:10.1080/0951192X.2017.1307452
Nieva, VF, & Sorra, J, (2003). 'Safety culture assessment: a tool for improving patient safety in healthcare organizations'. BMJ quality & safety, 12(suppl 2), ii17-ii23.
Parker, Dianne, Lawrie, Matthew, & Hudson, Patrick, (2006). 'A framework for understanding the development of organisational safety culture'. Safety science, 44(6), 551-562.
Probst, Tahira M, (2015). 'Organizational safety climate and supervisor safety enforcement: Multilevel explorations of the causes of accident underreporting'. Journal of applied psychology, 100(6), 1899. Pronovost, P, & Sexton, B. (2005). Assessing safety culture: guidelines and recommendations: BMJ Publishing Group Ltd.
278
Rabbani, Masoud, Zhalechian, Mohammad, & Farshbaf‐Geranmayeh, Amir, (2018). 'A robust possibilistic programming approach to multiperiod hospital evacuation planning problem under uncertainty'. International Transactions in Operational Research, 25(1), 157-189.
Reason, James. (2016). Managing the risks of organizational accidents: Routledge. Resnick, Marc, (2009). 'Safety Incentive Programs'. Professional Safety, 54(7), 46.
Salaheldin, Salaheldin I, & Zain, Mohamed, (2007). 'How quality control circles enhance work safety: a case study'. The TQM magazine, 19(3), 229-244.
Sammer, Christine E, Lykens, Kristine, Singh, Karan P, Mains, Douglas A, & Lackan, Nuha A, (2010). 'What is patient safety culture? A review of the literature'. Journal of Nursing Scholarship, 42(2), 156-165.
Saracino, Ada, Curcuruto, Matteo, Antonioni, Giacomo, Mariani, Marco Giovanni, Guglielmi, Dina, & Spadoni, Gigliola, (2015). 'Proactivity-and-consequence-based safety incentive (PCBSI) developed with a fuzzy approach to reduce occupational accidents'. Safety science, 79, 175-183.
Schwartz, Stephanie P, Adair, Kathryn C, Bae, Jonathan, Rehder, Kyle J, Shanafelt, Tait D, Profit, Jochen, & Sexton, J Bryan, (2019). 'Work-life balance behaviours cluster in work settings and relate to burnout and safety culture: a cross-sectional survey analysis'. BMJ Qual Saf, 28(2), 142-150.
Tam, Vivian WY, & Fung, Ivan WH, (2011). 'Behavior, attitude, and perception toward safety culture from mandatory safety training course'. Journal of Professional Issues in Engineering Education and
Practice, 138(3), 207-213.
Tapp, Linda M, & Bravo, Isabel. (2017). Safety Training Activities for the Ten Most Violated OSHA
Violations. Paper presented at the ASSE Professional Development Conference and Exposition.
Verma, Abhishek, Chatterjee, Subit, Sarkar, Sobhan, & Maiti, J. (2018). Data-driven Mapping Between Proactive and Reactive Measures of Occupational Safety Performance Industrial Safety Management (pp. 53-63): Springer.
Vigeh, Mohsen, Mazaheri, Maria, & Seyedaghamiri, Zahrabigom, (2011). 'Status of occupational health and safety in Iran'. Journal of UOEH, 33(4), 283-291.
Vredenburgh, Alison G, (2002). 'Organizational safety: which management practices are most effective in reducing employee injury rates?'. Journal of safety research, 33(2), 259-276.
Westrum, Ron. (1993). Cultures with requisite imagination Verification and validation of complex
systems: Human factors issues (pp. 401-416): Springer.
Westrum, Ron, (1996). 'Human factors experts beginning to focus on organizational factors in safety'.
ICAO journal, 51(8), 6-8, 26.
Yazdanparast, R, Zadeh, S Abdolhossein, Dadras, D, & Azadeh, A, (2018). 'An intelligent algorithm for identification of optimum mix of demographic features for trust in medical centers in Iran'. Artificial intelligence in medicine, 88, 25-36.