Development and Validation of a Novel Data
Analysis Procedure for Spherical Nanoindentation
A Thesis
Submitted to the Faculty
of
Drexel University
by
Siddhartha Pathak
in partial fulfillment of the
requirements for the degree
of
Doctor of Philosophy
June 2009
© Copyright 2009
Acknowledgements
The long and successful journey of my PhD doctoral dissertation would not be possible without the continuous support of a lot of people. Indeed, a complete list of everyone who has assisted me in my 5 years (two as Masters student and three as PhD) at Drexel University is too long to be included here. My first and foremost gratitude is towards my advisor, Prof. Surya R. Kalidindi, for his guidance and support during my PhD work. He is by far one of the smartest people I have seen in my brief career till date, and working with him has been a highly humbling experience. I would specially like to thank him for the support he provided during the days of my soccer injury and the subsequent knee surgery, without which my education might have come to an untimely halt. As I embark on my future career path of post-doctoral research I will be definitely looking for any opportunity to collaborate further with him, and specially learn from him.
I would like to acknowledge the support from my PhD co-adviser, Prof. Haviva Goldman, without whom the work on the mouse bone samples can not be even imagined. I would also like to thank the rest of my committee members – Prof. Roger D. Doherty, Prof. Yury Gogotsi, Prof. Greg Swadener and Prof. Ulrike Wegst – for their useful suggestions and criticisms during my dissertation which helped make this work a success.
Special thanks are due to Prof. Michel Barsoum, with whom I had had many invigorating discussions on nanoindentation over the years. As a part of my thesis proposal committee, it was he who showed me the potential pitfalls, and how to avoid them, as I embarked on my PhD dissertation work.
I am also grateful to Prof. Nina Orlovskaya for her support during my Masters research work (2003-2005).
The work on the metal samples was the result of a very successful collaboration with Prof. Roger D. Doherty and Dr. Dejan Stojakovic, whose expertise in metallurgy enabled the validation of my methods.
I would like to thank Mr. Brendan Donohue, for his help with the finite element simulations, and Mr. Joshua Shaffer for his help with the numerical calculations.
I would like to acknowledge the help and support I received from Prof. Yury Gogotsi’s group on the carbon nanotube (CNT) project, especially Dr. Goknur Cambaz, who prepared
these novel material system of dense CNT brushes, and Dr. Vadym Mochalin, who helped me with the initial nanoindentation experiments on these materials.
The work on the mouse bone samples was conducted in collaboration with Prof. Karl Jepsen’s group at the Department of Orthopedics, Mount Sinai School of Medicine (MSSM), New York, NY. In particular I would like to thank Dr. Hayden-William Courtland (MSSM) for his help in nurturing the animals at MSSM and during the harvesting of the mouse femurs, and Ms. Melanie Patel (Drexel University), for her help in validating the Raman analysis methods. Special thanks are also due to Prof. Greg Swadener from the Center for Integrated Nanotechnologies (CINT) facility at Los Alamos National Lab, NM for his help with the visco-elastic testing of the ‘wet’ mouse bone samples.
I would like to acknowledge the students with whom I have shared and learned the nanoindentation techniques from – namely Dr. Anand Murugaiah, Dr. Sandip Basu and Ms. Shraddha Vachhani, as well as the other members of the Mechanics of Microstructures Group (MMG) at Drexel University.
I would also like to thank all the faculty and staff of the Department of Materials Science and Engineering at Drexel University, especially Ms. Dorilona Rose and Ms. Judith Trachtman, for their help on various departmental issues over the years, and for providing the wonderful supportive environment in this department.
Last, and perhaps the most important, I would like to thank my family for their support during all these years and for keeping me motivated during the difficult times.
This work was made possible by the support from various funding agencies namely National Science Foundation (grant numbers DMR-0303395 and CMMI-0654179), National Institute of Health (grant number NIH AR044927), US Department of Energy, Office of Basic Energy Sciences (grant number DE-FGOI-05ER05-01), the 2006 and 2007 Sigma Xi Grants-in-Aid of Research (GIAR) program, the 2007 Center for Integrated Nanotechnologies (CINT) user proposal grant at Los Alamos National Lab, Los Alamos, NM which provided access to the Hysitron TriboScope® used for the viscoelastic testing, and the 2005 SURA-ORNL (Southeastern Universities Research Association, Oak Ridge National Lab) Summer Cooperative Research Program scholarship. The MTS XP® System and the TSL-OIM System (integrated with the ESEM Philips XL 30) used in this study is maintained and operated by the Centralized Research Facilities in the College of Engineering at Drexel University.
Contents
Acknowledgements ... iii Abstract ... ix Preface ... xi Executive Summary ... 1 1. Introduction ... 12. Spherical Nanoindentation Background ... 1
3. Aims and main tasks of the dissertation ... 5
Task 1. Development of an accurate data analysis procedure for spherical nanoindentation (Publication A) ... 5
Task 2. Extending the above data analysis procedure for nanoindentation machines that do not offer the CSM option (Publication B)... 11
Task 3. Analyzing the role of surface preparation in spherical nanoindentation data analysis (Publication C) ... 14
Task 4. Establishing local structure-property relationships at lower length scales in polycrystalline materials (Publication D) ... 18
Task 5. Analyzing the buckling behavior of thin films of dense carbon nanotube brushes (Publication E) ... 24
Task 6. Analyzing structure-property linkages in dry mouse bone (Publication F) ... 29
Task 7. Measuring the dynamic mechanical response of hydrated mouse bone by indentation (Publication G) ... 34
4. Conclusions ... 38
5. Potential for Future Work ... 40
References ... 43
Publication A. Determination of the effective zero-point and the extraction of spherical nanoindentation stress-strain curves... 50
Abstract ... 50
1. Introduction ... 51
2. Indentation Stress and Strain ... 55
4. Contact Radius ... 62
5. Indentation Stress-Strain Curves... 63
6. Conclusions ... 65
Acknowledgments... 66
References ... 66
Publication B. Determination of an Effective Zero-pint and Extraction of Indentation Stress-Strain Curves without the Continuous Stiffness Measurement Signal ... 71
Abstract ... 71
Acknowledgements ... 79
References ... 79
Publication C. Importance of Surface Preparation on the Nano-Indentation Stress-Strain Curves Measured in Metals ... 81
Abstract ... 81
1. Introduction ... 82
2. Zero-Point Determination and Indentation Stress-Strain Curves ... 83
3. Surface Preparation ... 86
4. Effect of Surface Oxide Film on Indentation Stress-Strain Curves ... 89
5. Pop-ins in Nanoindentation... 91
6. Conclusions ... 101
Acknowledgements ... 101
References ... 102
Publication D. Measurement of the Local Mechanical Properties in Polycrystalline Samples Using Spherical Nano-Indentation and Orientation Imaging Microscopy ... 106
Abstract ... 106
1. Introduction ... 107
2. Materials and Methods ... 108
3. Data Analyses Methods for Spherical Indentation ... 110
4. Results and Discussion ... 116
5. Conclusions ... 121
Acknowledgements ... 121
Publication E. Viscoelasticity and High Buckling Stress of Dense Carbon Nanotube Brushes ... 125 Abstract ... 125 1. Introduction ... 126 2. Experimental ... 129 2.1. Sample preparation ... 129
2.2. Indentation Stress-Strain Curves... 130
2.3. Visco-elastic Nanoindentation ... 132
3. Results and discussion ... 133
3.1. Buckling of CNTs ... 133
3.2 Visco-elastic behavior of CNTs ... 137
4. Conclusion ... 139
Acknowledgements ... 140
References ... 140
Publication F. Improved analysis of bone nano-mechanical properties using a novel nanoindentation analysis technique ... 143
Abstract ... 143 1. Introduction ... 144 2. Experimental ... 146 a. Sample preparation ... 146 b. Areas of interest ... 147 c. Raman micro-spectroscopy ... 149 d. Spherical nanoindentation ... 151
3. Results and Discussion ... 154
a. Modulus values from loading vs. unloading ... 154
b. Raman mapping ... 157
c. Relating bone’s local composition to its local properties ... 160
4. Conclusions ... 162
References ... 163
Publication G. Measuring the dynamic mechanical response of hydrated mouse bone by indentation ... 167
Abstract ... 167
1. Introduction ... 168
2. Materials and Methods ... 170
2.1. Sample preparation. ... 170 2.2. Areas of interest ... 173 2.3. Dynamic Nanoindentation. ... 174 3. Results ... 176 4. Discussion ... 179 5. Conclusions ... 181 References ... 182 Vita ... 189
Abstract
This dissertation presents a novel approach for converting the raw load-displacement data measured in spherical nanoindentation, from indentation depths as small as a few nanometers, into much more meaningful indentation stress-strain curves. This new method entails a new definition of the indentation strain, a new procedure for establishing the effective zero-load and zero-displacement point in the raw dataset, and the use of the continuous stiffness measurement (CSM) data. The concepts presented here have been validated by finite element models as well as by the analyses of experimental measurements obtained on isotropic metallic samples of aluminum and tungsten. It is demonstrated that these new methods produce indentation stress-strain curves that accurately capture the loading and unloading elastic moduli, the indentation yield points, as well as the post-yield characteristics in the tested samples. A further development of this approach, without the need for the CSM – an option available only on a limited number of machines – is also outlined.
Subsequent validation of this approach on a wide range of material samples including metals, carbon nanotubes (CNTs), ceramics and bone – confirms the ongoing success and versatility of this technique. In particular, the success of these data analysis techniques has been demonstrated in correlating the elastic moduli measured in loading and unloading segments, and explaining several of the surface preparation artifacts typically encountered in nanoindentation measurements in metals. In an extension of this technique to anisotropic polycrystalline samples, a judicious combination of the results from Orientation Imaging Microscopy (OIM) and nanoindentation were used to estimate, for the first time, the changes in slip resistance in deformed grains of anisotropic metallic samples of Fe-3%Si steel at a micron length scale. These results also represent the experimental validation of Vlassak and Nix’s theory1 for nanoindentation in anisotropic solids and the first report of experimentally measured nanoindentation yield strengths in anisotropic crystallographic solids as a function of crystal lattice orientation.
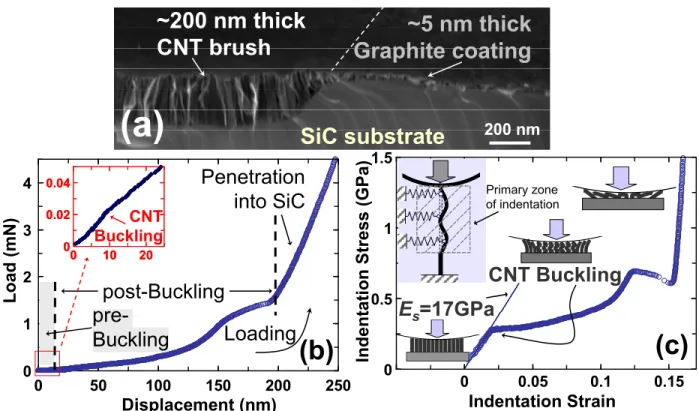
Similar studies on dense CNT brushes, with ~10 times higher density than CNT brushes produced by other methods, demonstrate the higher modulus (~17-20 GPa) and orders of magnitude higher resistance to buckling in these dense CNT brushes than vapor phase deposited
CNT brushes or carbon walls. This work also demonstrates the viscoelastic behavior, caused by the increased influence of the van der Waals’ forces in these highly dense CNT brushes, showing their promise for energy-absorbing coatings. Even in a complex hierarchical materials system like bone, this indentation analyses technique has been able to elucidate trends in elastic, yield and post-yield indentation behavior at the lamellar level in the femora (thigh bone) of two different inbred mouse strains, A/J and B6, to the corresponding structural information measured using Raman Spectroscopy at similar micron (lamellar) length scales. Thus bone with a higher mineral-to-matrix ratio is shown to demonstrate a trend towards a higher local modulus and yield strength and the B6 mouse strain exhibits a trend towards lower modulus and yield values than the more mineralized A/J strain. An extension of the above study to indentation testing of bone in the ‘wet’ or hydrated conditions (which represents more closely bone’s naturally hydrated in-vivo environment), demonstrates a novel approach to characterize bone’s dynamic mechanical behavior under contact loading. Bone having a higher collagen content or a lower mineral-to-matrix ratio was found to demonstrate a trend towards a higher viscoelastic response – confirming the trends shown in the dry bone results. In summary, the success of the analyses techniques demonstrated in this dissertation constitute a crucial first step in the formulation of a rigorous framework for establishing structure-property linkages in various materials models at the submicron length scale.
Preface
Writing the PhD dissertation summarizing the novelty of one’s arduous doctoral research is both a difficult and satisfying task. The difficulty generally stems from the writing effort involved in organizing the evidence and associated discussions collected over 4-5 years of the student’s doctoral research timeline into one coherent document arguing in defense of a particular thesis. Maintaining the reader’s attention throughout the course of such a lengthy narrative often proves to be a difficult and challenging task. However, one significant advantage in writing of this particular dissertation was that almost all the results and ideas attempted during the course of my PhD work have already been published (or are under review at this time) in various peer-reviewed archival journals. Indeed each of these publications can be viewed as stand-alone theses that defend the original work published in those manuscripts. As such, instead of rewriting and rearranging this collection of manuscripts into one drawn-out storyline, it was felt that the reader would be much better served with an executive summary of the entire body of work – a summary that contains enough information for the readers to become acquainted with the full scope of the research work without reading through all of its intricacies. Keeping this in mind, the first section of this dissertation – the executive summary – has been constructed as a statement of the problem attempted in this PhD work, with relevant background information, a description of any alternatives, and the major conclusions. Although this occasionally does necessitate some repetition of essential parts of the published manuscripts, it is done so with the expectation that someone reading this executive summary would get a good idea of main points of the document without becoming bogged down with all the details. The more inquisitive reader is guided to the copies of published manuscripts (see list below), provided after the executive summary, which go over each of the tasks outlined in the summary in significant detail.
List of manuscripts summarized in the executive summary: 1) Publication A
Surya R. Kalidindi, Siddhartha Pathak. “Determination of the effective zero-point and the extraction of spherical nanoindentation stress-strain curves”; Acta Materialia, 56 (2008) 3533-3542.
2) Publication B
effective zero-point and extraction of indentation stress-strain curves without the Continuous Stiffness Measurement signal”; Scripta Materialia, 60 (2009) 439-442. 3) Publication C
Siddhartha Pathak, Dejan Stojakovic, Roger Doherty, and Surya R. Kalidindi. “Importance of Surface Preparation on the Nano-Indentation Stress-Strain Curves
Measured in Metals”; Journal of Materials Research, Focus Issue on Nanoindentation, v 24, n 3, p 1142-1155, March 2009.
4) Publication D
Siddhartha Pathak, Dejan Stojakovic, and Surya R. Kalidindi. “Measurement of the Local Mechanical Properties in Polycrystalline Samples Using Spherical Nano-Indentation and Orientation Imaging Microscopy”; Acta Materialia. v 57, n 10, June 2009, pg 3020-3028.
5) Publication E
Siddhartha Pathak, Z. Goknur Cambaz, Surya R. Kalidindi, J. Gregory Swadener, Yury Gogotsi. “Analyzing the buckling of carbon nanotube (CNT) arrays under contact loading using spherical nanoindentation”; Carbon, 47 (2009), pg 1969-76.
6) Publication F
Siddhartha Pathak, Melanie Patel, Surya R. Kalidindi, Haviva M. Goldman. “Improved analysis of bone nano-mechanical properties using a novel nanoindentation analysis technique” – in preparation
7) Publication G
Siddhartha Pathak, J. Gregory Swadener, Surya R. Kalidindi, Haviva M. Goldman. “Characterization of local dynamic properties of wet cortical bone using
nanoindentation” – in preparation
- Siddhartha Pathak Philadelphia, PA, 2009
Executive Summary
1. Introduction
Successful development of physics-based multi-scale materials models with excellent predictive capabilities is largely hampered by lack of methods for characterizing reliably the local (anisotropic) properties of constituents in a composite material system at the appropriate length scales of interest. Much of the current effort in this field is centered on micro-pillar tests [1, 2] that require intricate fabrication and handling as well as highly specialized testing equipment [3, 4]. Here, a novel approach is presented that can provide the desired information at significantly lower effort and cost by combining the mechanical information obtained from spherical nanoindentation with the complementary structure information measured locally at the indentation site. In order to achieve this goal new data analyses procedures for obtaining reliable indentation stress-strain curves from spherical nanoindentation tests has been developed and validated, which are able to capture the loading and unloading elastic moduli, the indentation yield points, as well as the post-yield characteristics in the tested samples.
In particular, it is demonstrated that the analysis techniques developed in this work can be used to extract a detailed range of mechanical information from indentation on a wide variety of very different material systems, starting from isotropic and anisotropic metallic materials, to thin films of dense carbon nanotube (CNT) brushes and extending to complex biological systems (bone). This thesis also demonstrates the correlations of the mechanical information obtained from the nanoindentation stress-strain curves to the corresponding structure information (using complementary surface characterization techniques such as orientation imaging microscopy (OIM), which images the microstructure using electron backscattered diffraction (EBSD) for crystalline samples, and Raman spectroscopy, which is highly sensitive to both mineral and collagen components of biological tissues such as bone) at the same length scale in the samples.
2. Spherical Nanoindentation Background
For more than a century, the indentation test has been one of the most common techniques for characterization of the mechanical properties of a vast range of materials [5]. In a typical test, an indenter of known geometry is driven into a softer sample by applying a preset load or displacement. The dimensions of the resultant imprint is then measured and correlated to
a hardness index number. With the advent of higher resolution testing equipment it has now become possible to continuously control and monitor the loads and displacements of the indenter as it is driven into and withdrawn from a material. Known as nanoindentation (or instrumented indentation testing IIT, or depth sensing indentation DSI), this significantly expands the capabilities of the traditional hardness testing method [6]. IIT has significant advantages over conventional indentation testing, since the material properties of interest can now be obtained from indentation depths as small as a few nanometers, using proper analysis techniques.
The earlier designs for indentation systems were developed for measuring the hardness properties of materials at large effective strains, often using sharp indenters such as Berkovich and Knoop diamond indenters. Although the sharp indenters [7] are useful in calculating the hardness [8] and fracture toughness [9] of a material, the higher stress concentrations inherent in the sharp indenters are a major drawback in studying the elastic behavior of a material. On the other hand, the elastic deformation under a spherical indenter is well defined and more easily identified in the experiments. This makes the spherical indenters an attractive option in that they enable one to estimate the contact geometry more accurately, and consequently allow us to follow the evolution of stress-strain response in the sample from initial elasticity, through the initiation of plasticity at a critical load (yield behavior in the form of elastic limit) to large plastic strains [10]. Using certain idealizations [11, 12], it is also possible to generate indentation stress-strain curves from the load-displacement data acquired in spherical indentation [13].
Because of the severe heterogeneity of the stress and strain fields under the indenter, the analyses of the measured load-displacement curves in nanoindentation requires considerable attention if one is to reliably extract material properties from these measurements [5]. One starts by considering the penetration of a rigid spherical indenter into a flat specimen assuming a linear elastic, isotropic, material response. For frictionless contact, the solution is provided by Hertz’s model [14] and is usually expressed as
2 3 2 1 3 4 e eff eff R h E P ,
a
R
effh
e (1)where a is the radius of the contact boundary (see Figure 1a) at the indentation load P, and he is
the elastic penetration depth. Reff and Eeff denote the effective radius and the Young’s modulus of
i i s s eff E E E 2 2 1 1 1 , s i eff R R R 1 1 1 . (2)
Here, and E denote the Poisson’s ratio and the Young’s modulus, while subscripts s and i refer to the specimen and the indenter, respectively. For elastic loading of a flat sample, Rsapproaches infinity, and therefore, Reff Ri.
R
ia
ch
th
eh
rh
Max load Complete unload Load , P Displacement, h Rind hr ht he Loadi ng U nloa dingInitial Contact Geometry
Final Geometry Rind Rsample Sample surface at unload e dh dP S Post-Elastic Elastic Indentation Strain, In de nt at io n S tress, Loadi ng Unl oadi ng a ht 4 . 2 Post-Elastic Elastic Slope = Eeff Yind
(c)
(b)
(a)
Figure 1. (a) Schematic of the contact loading of a spherical indenter into a sample. (b) Schematic of a typical measured spherical indentation load-displacement curve with the initial and final contact geometries. (c) Using the analyses techniques described in this thesis, a corresponding indentation stress-strain curve can be extracted 2 that clearly shows both the loading and unloading elastic moduli, the
indentation yield point (Yind), as well as the post-yield characteristics of the indented material. Figure
adapted from Kalidindi and Pathak [15].
However, the sample seldom behaves in a purely elastic manner especially under the influence of the highly localized stress field under the indenter (see the schematics presented in Figure 1). In the loading segment, the sample typically experiences significant levels of inelastic strains in addition to the elastic strains. Moreover, the very small initial elastic loading segment is often not clearly identifiable in the measured load-displacement curves obtained on majority of the samples. However, in the unloading segment, the sample is likely to experience essentially
2 Note that the extraction of indentation stress-strain curves from the corresponding load-displacement dataset requires a series of data analysis steps, as described in Task 1 [15] of this Executive Summary.
elastic unloading, at least in the initial part of the unloading segment. It has been a common practice in the literature to apply the Hertz’s model to the unloading segment of the measured load-displacement curves [16-18], where it is typically noted that reloading at the same spot often produces the exact same load-displacement curve as that measured in the unloading segment. Note however that this reloading is no longer from a flat surface. Rigorous methods have been proposed in the literature to account for the shape of the residual indentation on the reloading curve [19, 20], by establishing an equivalent indenter shape, mostly using results from simulation in conjunction with nanoindentation experiments.
Applying Hertz’s model to the unloading segment of the measured load-displacement curve in nanoindentation permits an estimation of the Young’s modulus. For this purpose, it is convenient to recast Equation (1) as [17]
A S E
2
*
, (3)where S is the slope of the unloading curve (i.e. dP/dhe, see Figure 1; also referred to as the
Continuous Stiffness Mode (CSM) mode in the MTS XP® nanoindentation machine) at or close to the peak indentation load, and A is the projected contact area defined as
2
a
A
, a 2hcRi hc2 (4)where hc is the distance from the circle of contact to the maximum penetration depth (Figure 1).
In order to employ the above set of equations and extract Young’s modulus of the sample, one needs the value of hc. The Oliver and Pharr method proposes the following
expression for the computation of hc [21]:
S P h h h hc t e t 4 3 2 1 (5)
Although the above equation can be applied to any point in the unloading load-displacement curve, it is customary to apply it at or close to the peak indentation load, because this is where the sample is likely to be exhibiting a purely elastic response.
In order to produce the indentation stress-strain plots, it has been a common practice to define indentation stress and indentation strain such that Equation (1) transforms into a linear relationship as [12, 22]
eff ind ind ind ind R a a P E
, , 3 4 2 * (6)Note that the Equation (6) is completely equivalent to Equation (1) in the regime of small indentation depths (i.e. hc << Reff) typical of elastic behavior. The expected linear relationship
between ind and a Reff in elastic indentation has prompted many researchers to adopt a Reff [9, 12, 22-24] as a measure of the indentation strain. In some recent reports [25], tan θ (where sin θ
= a Reff ) has also been adopted as a measure of the indentation strain. It should be noted here that a majority of the studies in the literature [9, 12, 22-24, 26, 27] simply extend the definition of the indentation strain as a Ri for situations where there are both elastic and plastic strains under the indenter. Since Reff Ri in the initial elastic loading of a spherical indenter on a flat sample, this definition of a Ri as the indentation strain is certainly consistent with Hertz’s
theory. However, as the sample experiences plastic strain, there is no justification for the use of this ratio as a measure of the indentation strain. Moreover, an accurate estimation of a using Equation (1) also requires a precise knowledge of Reff.
As shown in Figure 1, the spherical indentation stress-strain curves are of significant assistance in identifying the elastic moduli, the indentation yield points (denoting the end of elasticity and beginning of plasticity), as well as the post-yield characteristics in the tested samples. Note also that the elastic moduli can be calculated both for the elastic loading and the unloading segments when using the spherical indentation stress-strain curves.
3. Aims and main tasks of the dissertation
Task 1. Development of an accurate data analysis procedure for spherical nanoindentation (Publication A [15])
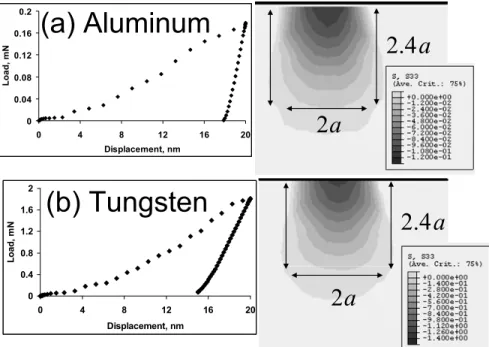
Figure 2 highlights some of the main problems faced when the commonly used Equation 6 is engaged to construct indentation stress strain curves – which also help define the main focus of this thesis. In this figure, the indentation stress strain curves are plotted using two different definitions of indentation strain – indentation strain defined as a/2.4Ri (Equation (6)) and as
ht/2.4a (the definition developed in this work)3 – for polycrystalline samples of tungsten and
aluminum using a 13.5 µm radius spherical indenter. The low degree of elastic anisotropy in these two materials (note that Hertz theory is valid only for isotropic elastic materials) as well as the strong variation in their respective mechanical properties (aluminum exhibits a low modulus and a low yield strength while tungsten exhibits a high modulus and a high yield strength) makes them an ideal choice for comparing these two data analysis procedures. Note that in Equation (6), the indentation strain is actually defined as a/Ri and not a/2.4Ri as shown in Figure 2. The
inclusion of a multiplicative factor (4 312.4) in this definition conveniently modifies the slope during elastic loading and unloading to be equal to the effective modulus, Eeff and makes it
consistent with the definitions followed in this work.
0 0.05 0.1 0.15 0.2 0.25 0.3 0.35 0 0.02 0.04 0.06 0.08 0.1 0.12 Indentation Strain In d e n tat io n S tr e ss, G P a Aluminum
Strain as ht /2.4a(Eq. 8)
Strain as a/2.4Ri (Eq. 6) Line representing
Hertz’s theory (Eq. 1) for Es=66 GPa Incorrect modulus value
(b)
Es= 66 GPa 0 1 2 3 4 5 0 0.01 0.02 0.03 0.04 0.05 0.06 Indentation Strain In d e n ta tio n S tr e s s , G P a Strain as ht /2.4a(Eq. 8) Strain as a/2.4Ri (Eq. 6)Hertz’s theory (Eq. 1) for Es=409 GPa Tungsten Incorrect modulus value Es= 409 GPa
(a)
Figure 2. A comparison of the extracted indentation stress-strain curves for isotropic metals such as (a) Tungsten and (b) Aluminum using the two different definitions of indentation strain. The definition of the indentation strain (= ht/2.4a) (Equation (8)) produces significantly better indentation stress-strain curves
with correct values of modulus during both loading and unloading. Figure adapted from Kalidindi and Pathak [15].
Two major problems are easily apparent when indentation stress-strain curves are plotted using indentation strain defined as a/2.4Ri (Equation (6)): First, there is a substantial amount of
noise, especially in the initial elastic and yield sections of this curve, and second, indentation strain defined as a/2.4Ri does a very poor job of capturing the elastic unloading curves. For
example, in case of aluminum, the slope of the unloading stress-strain curve, and hence the unloading modulus, calculated using a/2.4Ri as the indentation strain is actually negative (Figure
2b). This problem of highly unrealistic unloading slopes in the analyses of spherical indentation data was noted in numerous other materials, including tungsten, aluminum, silver, gold, steel etc.
3 The motivation for the new definition used in Figure 2 is presented in the next section; here we use it primarily for comparative purposes against the commonly used expression for indentation strain as a/2.4Ri.
(see Publication A). Note that both these problems are rectified when the new definition of indentation strain as ht/2.4a is used. The indentation stress-strain curves produced using the new
methods also reflect more accurately the underlying physical processes. As expected, the indentation stress-strain curve for tungsten shows more strain hardening compared to the aluminum sample [28].
Whereas the first problem (of substantial scatter in data in the initial loading portion of the curve) stems from an incorrect determination of the zero-point or the point of effective initial contact during nanoindentation, the second error is more related to the incorrect use of a/Ri as an
effective measure of indentation strain. The conventional definition of strain involves the ratio of change in length over its initial length in a selected region of the sample. In this respect a Reff , or the more commonly used a Ri , lacks any reasonable physical interpretation as a strain measure, because this cannot be interpreted as change in length over its initial length in any part of the sample. Furthermore Ri is not an appropriate length scale characterizing the deformation
caused by the indentation (a already carries that information). As described before, the main reason for using a Reff is its convenient appearance in Equation (6). A third major problem, not easily apparent in the figure, stems also from the use of Equation 4 to determine a (which is motivated by the geometry and radius of the indenter Ri and not the effective radius Reff), which
generates significant approximations in the calculated values of indentation stress as well.
These above concerns have contributed to the large variance in the reported values of the properties measured using nanoindentation and as such are the primary motivation for this work. Thus the key aim of this PhD thesis is to develop a rigorous data analysis approach for spherical nanoindentation that covers both the elastic and inelastic regimes and is free from the ad-hoc assumptions of the above approaches. The methodology developed for this task over the course of this work is detailed below.
The extraction procedure of reliable indentation stress-strain curves from the measured load displacement data can be summarized as a two-step process (see Ref [15] for details). The first step in this process is an accurate estimation of the point of effective initial contact in the given data set, i.e. a clear identification of a zero-point that makes the measurements in the initial elastic loading segment consistent with the predictions of Hertz’s theory [14, 29]. For spherical nanoindentation this relationship can be expressed as
*
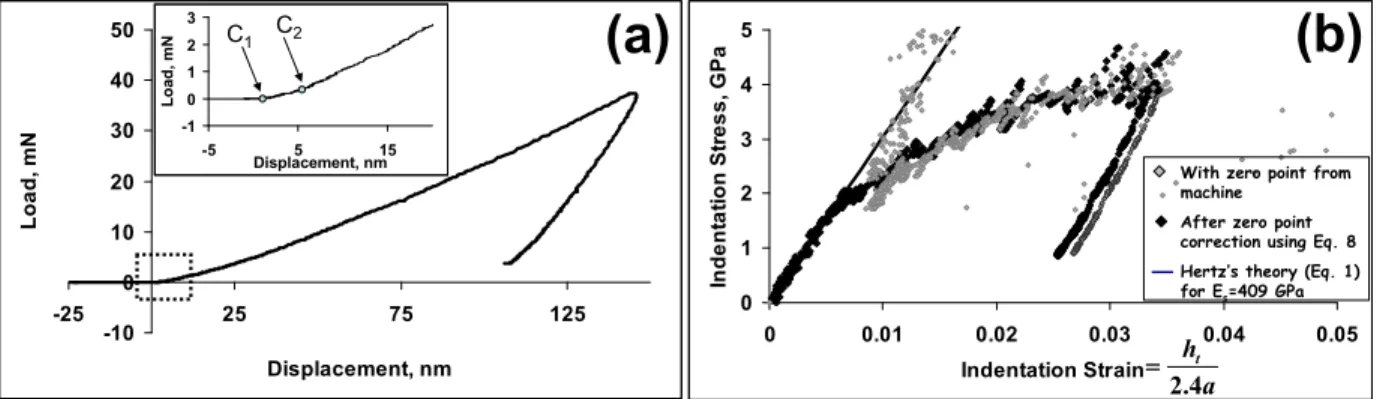
* ~ 2 ~ 3 2 3 h h P P h P S e e , (7)where P~, h~e, and S are the measured load signal, the measured displacement signal, and the continuous stiffness measurement (CSM) signal in the initial elastic loading segment from the machine, respectively, and P* and h* denote the values of the load and displacement signals at the point of effective initial contact. A linear regression analysis can then be used to establish the point of effective initial contact (P* and h*) in the indentation experiment. This procedure is illustrated in Figure 3(a) for a sample of Fe-3%Si steel indented with a 13.5 μm radius spherical indenter. Figure 3(b) shows the point of initial contact as identified by the default procedure in the MTS software (C1) and by the procedure described above (C2). In the default procedure, C1 is generally determined as the point at which the S signal first reaches or exceeds 200 N/m. Note that the value for S is generally negative before indenter is in contact with the specimen. For hard materials such as metals and ceramics, this option almost always underestimates the zero-point. Thus, to arrive at C2, the load signal in Figure 3(b) needed to be moved by about 0.12 mN and the displacement signal by about 6.8 nm with respect to C1. A major advantage of the suggested approach is the fact that this method identifies an “effective” or virtual point of initial contact, and not necessarily the actual point of initial contact. The concept of an effective point of initial contact allows us to de-emphasize any artifacts created at the actual initial contact by the unavoidable surface conditions (e.g. surface roughness or presence of an oxide layer).
Figure 3(c) shows the indentation stress-strain curve derived from the load-displacement data in Figure 3(b) using the protocol outlined above and compares it to the plot using the machine generated zero point (C1). Note that the initial elastic and yield sections are much better resolved when the zero point is determined using the procedure described above (instead of using the default procedure in the MTS software).
In the second step of the data analysis method, a new definition of the indentation strain was adopted. For this purpose Hertz’s theory [14, 29] is recast for frictionless, elastic, spherical indentation as: a h a h a P E e e ind ind ind eff ind 4 . 2 3 4 , , 2
,eff E S a 2 , i i s s eff E E E 2 2 1 1 1 , s i eff R R R 1 1 1 , (8)
where ind and ind are the indentation stress and the indentation strain, and the rest of the terms are as defined earlier.
0 0.5 1 1.5 2 2.5 3 3.5 0 0.02 0.04 Indentation Strain In den tatio n S tr ess , G P a P -2/ 3S he (mN) ~ ~ P -2/ 3S he (mN) ~ ~ -5 0 5 10 15 20 -25 25 75 125 175 Displacement, nm Lo ad , mN hr he ht
With zero point from machine After zero point correction
Hertz theory for Eeff=194GPa
-0.2 0.2 0.6 -2 2 6 10 14 C1 C2 -0.6 -0.5 -0.4 -0.3 -0.2 -0.1 0 0.1 0.2 0 0.04 0.08 0.12 S, CSM signal (mN/nm)
(a)
(b)
(c)
(d)
Complete unload Complete unloadR
ia
th
Idealized primary
zone of indentation
Idealized primary
zone of indentation
a
a
2
.
4
4
3
h
eh
ch
r Max load Max loadFigure 3. (a) The identification of the effective zero-point in the dataset measured on a vibro-polished Fe-3%Si steel sample indented with a 13.5 μm radius spherical indenter. The measured (b) load-displacement curve and the extracted (c) indentation stress-strain curves for Fe-3%Si steel using two different estimates of the zero-point. The inset in (b) shows the two different estimates of the zero-point: C1 - zero point
given by the machine and C2 - effective zero point determined using Eq. 7. (d) Schematic of a spherical
indentation showing the primary zone of indentation. Figure adapted from Pathak et al. [30]. This form of Hertz’s equation suggests the use of
a h a ht t 4 . 2 3 4 as the definition of
indentation strain. Note that the indentation strain is defined using the total indentation depth, ht, instead of the elastic indentation depth, he, to generalize it for elastic-plastic indentations. For the case of purely elastic indentation, these two indentation depths are identical to each other and
therefore the proposed measure of indentation strain is completely consistent with Hertz’s theory. The new definition of indentation strain presented here is tantamount to idealizing the primary zone of indentation deformation as shown in Figure 3(d). The indentation is idealized here as being equivalent (in an average sense) to compressing by ht (the indentation depth) a
cylindrical region of radius a and height 2.4a. The cylinder might expand laterally to accommodate this contraction in height. The lateral expansion is, however, not relevant to the definition of the indentation strain. This interpretation is much more physical than the definition of indentation strain as a/Reff(orthe more commonly used a/Ri). The main reason for using a/Reff
is its convenient appearance in Equation 6. However, as discussed next, the two definitions (in Equations (6) and (8)) are completely equivalent in the analysis of the initial elastic loading segment (where ht he).
In the limit of small spherical indentation depths that are typical of a purely elastic indentation of the sample, it can be seen that
eff t R a a h
. This implies that the definition of the indentation strain adopted here is equivalent to the definition used in the literature except for a multiplicative factor. The inclusion of this factor in the definition of the indentation strain conveniently modifies the slope of the elastic indentation stress-strain curve to be equal to the effective modulus, Eeff. Note that both the definitions in Equations (6) and (8) are mathematically
equivalent to each other for use in Hertz’s model for purely elastic indentation, except that the terms are grouped differently. However, as seen from Figure 2, when applied to data sets collected from samples exhibiting elastic and inelastic deformations, the two approaches result in very different indentation stress-strain curves.
In summary, the main concepts presented so far can be reviewed as follows:
(i) A new procedure has been formulated for establishing the effective point of initial contact that makes the measurements highly consistent with the Hertz’s theory. This new procedure utilizes the CSM signal provided by modern nano-indentation machines, and has been successfully used to generate reliable and meaningful indentation stress-strain curves. More specifically, the indentation stress-strain curves generated by this new method did not exhibit the substantial noise and spikes prevalent in the initial loading segments of the indentation stress-strain curves obtained using the zero-point given by the default procedures currently used in the equipment manufacturer’s software.
(ii)A new rational definition of the indentation strain has been formulated. This new definition is highly consistent with Hertz’s theory for purely elastic contact. For elastic-plastic contact, it was also found to be consistent with the geometry of the primary indentation zone (this was validated using finite element models). It was also noted that that the new definition of indentation strain produces more reasonable looking unloading segments of the indentation stress-strain curves.
Task 2. Extending the above data analysis procedure for nanoindentation machines that do not offer the CSM option (Publication B [31])
Both the estimation of the zero point (Equation (7)) and the extraction of the indentation stress strain curves (Equation (8)) described in Task 1 require the use of the continuous stiffness measurement signal (S=dP dhe; also referred to as the CSM mode in the MTS XP® nanoindentation machine). The CSM is accomplished by imposing a small, sinusoidally varying signal on top of a DC signal that drives the motion of the indenter. The data obtained, by analyzing the response of the system by means of a frequency specific amplifier, is then used to measure of contact stiffness at any point along the loading curve [32].
However the CSM module is an optional accessory on the MTS nanoindenter machine, and hence is available only on some machines. Moreover, other nanoindentation machines (manufactured by companies other than MTS) do not presently offer the CSM as an option. Thus, there is a critical need to develop data analysis methods for extracting indentation stress-strain curves without the CSM. In this section a novel approach is presented for converting the spherical nanoindentation load-displacement data into indentation stress-strain curves, without the need for the CSM.
Extraction of the indentation stress-strain curves without using CSM is achieved in a two-step process: (i) establishing the effective zero-point and (ii) estimating the contact radius, a, which is required for the computation of indentation stress and strain. In this work, the zero-load and the zero-displacement has been established by fitting the recorded initial elastic load (P~)
and displacement (h~e) signals to the predictions of Hertz theory. According to Hertz’s theory [14, 29], the load and displacement during elastic loading in a spherical nanoindentation experiment should be related by
2/3 * ~ * ~ P P k h he eff eff R E k 1 1 4 3 . (9)Note that k in Eq. (9) is a constant for the entire initial elastic loading segment. The values of P*
and h* that yield the lowest residual error in the least-squares fit of the initial elastic loading segment to Eq. (9) were chosen to correspond to the effective zero point. This approach ensures that the corrected data set would be highly consistent with Hertz’s theory.
h*, nm P*, mN lo g (r esidu al er ro r) W
Zero point without using CSM, Eq. (III-3) Zero point using the CSM (Ref. [III_1])
Figure 4. Comparison between the effective zero-points identified by the CSM technique (Eq. (7)) and the non-CSM technique (Eq. (9)) for tungsten using a 1.4 µm spherical indenter. The residual error in this plot is obtained from regression analyses as measure of the degree of fit to (Eq. (9). Figure adapted from Pathak et al. [31].
Figure 4 shows an example of a comparison between the zero-points for tungsten as determined by the two methods: (i) Eq. (7) using the CSM, and (ii) Eq. (9) without using the CSM signal. As seen from Figure 4, both the CSM and the non-CSM data analysis methods for tungsten yield nearly identical values of P* and h* - a fact validated over a number of datasets for a range of metallic samples (see Publication B).
It is worth reiterating here that it is possible to analyze the relatively small initial elastic loading segments with remarkable accuracy because the use of Eq. (7) or Eq. (9) to establish the effective zero-point does not require prior knowledge of the values of Reff and Eeff. This is
especially beneficial in establishing a reliable value of Ri (note that in the initial elastic loading
segment Reff = Ri ). Using measurements on samples of known Young’s moduli (e.g. Si
20 µm respectively, even though the manufacturer had claimed otherwise. Both these estimates were subsequently confirmed by scanning electron microscopy.
The second step in the extraction of indentation stress-strain curves is an accurate estimation of the contact radius a, which evolves continuously during the indentation experiment. The majority of the methods used for estimation of a in the literature [12, 21, 22] are motivated by the spherical geometry of the indenter, where a is calculated directly from the indentation depth and the radius of the indenter, Ri. However as noted before, although the
relationship Reff Ri holds in the initial elastic loading segment, Reff can no longer be assumed
to be equal to Ri after any imposed plastic deformation in the loading segment.
In this work, the value of Reff has been established by imposing unloading segments at
several selected locations on the measured load-displacement data, and analyzing them carefully using Hertz’s theory. Each unloading segment is fit to the expected Hertz’s relationship between the total indentation depth, ht, and indentation load, P, which may be conveniently expressed as
3 2 kP h h he t r (10)
Once the value of Eeff is established from the initial loading curve (or if the Young’s modulus of
the sample material is already known), a regression analysis on the unloading segment can determine both hr and Reff. The value of the contact radius, a, at any point in the unloading
segment can then be determined from
t r
. eff e effh R h h R a (11)It should be noted that this relationship between Reff and a is implicit in Hertz’s theory for the
quadratic contacting surfaces. Applying this equation to the data point just before the initiation of the unloading segment provides the value of the contact radius at that point in the original loading segment. This method does however necessitate a large number of loading-unloading segments in order to be able to get a complete description of the indentation stress-strain curve for a given sample, since each unloading curve will produce only one point on the indentation stress-strain curve.
Figure 5(A) and (B) show comparisons between the indentation stress-strain curves obtained using both the CSM method described in our earlier task (Task 1) and the non-CSM method described in this task on aluminum and tungsten samples for both 1.4 and 20 μm radii indenter sizes. It is seen that the indentation stress-strain curves from the CSM and the non-CSM
methods agree well with each other for both indenters. The indentation stress-strain curve produced using the non-CSM method is able to capture all the major features of the stress-strain curves including the linear elastic regime, the plastic yield point, and the post-yield strain-hardening. As expected, the indentation stress-strain curve for tungsten shows more strain hardening compared to the aluminum sample. These results also demonstrate the feasibility of capturing the details of the pop-in 4 phenomenon occurring in the smaller 1.4 µm indenter with the non-CSM method. These findings indicate that in spite of the non-continuous nature of the non-CSM calculations, this method can be successfully used to characterize the mechanical response of the material during spherical nanoindentation.
0 0.5 1 1.5 2 2.5 3 0 0.1 0.2 0.3 0.4 0.5 Indentation Strain Inde nta ti on S tr es s, GP a
ISS for 1.4 µm indenter with CSM [1] ISS for 1.4 µm without CSM ISS for 20 µm indenter with CSM [1] ISS for 20 µm without CSM
Es=70 GPa 0 0.05 0.1 0.15 0.2 20 µm indenter Es=70 GPa
A
Pop-in 0 0.02 0.04 0.06 -2 0 2 4 6 8 10 0 0.05 0.1 0.15 0.2 Indentation Strain In de nta ti o n S tr e s s , G P a Es= 400 GPa 0 2 4 6 Es=400 GPa 20 µm indenterB
Pop-in 0 0.02 0.04 0.06ISS for 1.4 µm indenter with CSM[1] ISS for 1.4 µm without CSM ISS for 20 µm indenter with CSM [1] ISS for 20 µm without CSM ISS for 1.4 µm indenter with CSM[1] ISS for 1.4 µm without CSM ISS for 20 µm indenter with CSM [1] ISS for 20 µm without CSM
Figure 5. Comparison between the indentation stress-strain curves obtained using the CSM method (Task 1) and the non-CSM method on (A) aluminum and (B) tungsten samples with the 1.4 and 20 μm radii indenters. The insets show expanded views of the indentation stress-strain curves for the larger 20 µm indenter. Figure adapted from Pathak et al. [31].
Task 3. Analyzing the role of surface preparation in spherical nanoindentation data analysis (Publication C [33])
Since nanoindentation, with its high resolution load and depth sensing capabilities, is essentially a surface probe technique, any disturbance to the surface quality is likely to have an impact on the nanoindentation results. In this respect, our new data analyses procedures, with their ability to analyze the initial loading segments, is highly suited to gauge the quality of surface finish on the indented materials. Thus this task deals with understanding the precise role of surface preparation on the measured nanoindentation data. Here the focus is on 3 important
4 Pop-ins occur when the indenter suddenly experiences an increase in penetration depth without any major increase in the applied indentation load (in a load controlled experiment), as described in detail in Task 3 [33].
aspects that commonly affect the initial nanoindentation loading segments of metallic materials, namely (i) presence of a highly disturbed surface layer produced by traditional (mechanical) polishing methods, (ii) presence of a thin oxide film on the surface, and the (iii) occurrence of ‘pop-ins’ or depth excursions at low loads.
One of the most important factors for producing reliable results in nanoindentation experiments is the careful and reproducible preparation of the specimen surfaces to be analyzed. The effect of surface finish on nanoindentation results is illustrated in Figure 6 which shows the indentation stress-strain curves measured on an annealed sample of W prepared with two different surface finishes: (i) mechanically polished surface (final polishing step 1 μm diamond polish), and (ii) an electro-polished surface using a 13.5 μm radius spherical indenter. It is clearly seen from this figure that the indentation stress-strain curves for the W surface prepared by rough mechanical polishing are consistently higher than that of the electro-polished surfaces (Figure 6a), whereas those of electro-polished and vibro-polished (final polishing step 0.02 μm colloidal silica for ~48 hours) surfaces are in excellent agreement with each other (Figure 6b). Rough mechanical polishing generally leaves a disturbed surface layer with a higher dislocation content than in the original annealed material. Since the indentation modulus of the material is not altered appreciably by the presence of these dislocations, the main effect of this disturbed surface layer is in the form of an increase in the indentation yield strength. Furthermore, the indentation yield strengths measured on the mechanically polished samples also result in a large scatter in the measured indentation yield strengths because of the inherent variability in the surface layer produced by this method of surface preparation.
This underlines the importance of a high quality surface finish in obtaining reliable data from nanoindentation experiments, especially in the initial elastic loading segments. For metals, having a strain free surface is highly critical in order to get repeatable and reliable results from nanoindentation, which correspond to the properties of the pristine metal and not to the effects of the sample preparation techniques themselves. Both electro-polishing, where a certain thickness of the metal is removed to generate a strain-free flat surface, and vibro-polishing using fine sized colloidal silica for a significant length of time (~ 24-48 hours), seem to fulfill these requirements.
0 1 2 3 4 5 0 0.01 0.02 0.03 Indentation Strain Ind e n tat io n S tr e ss, G P a mechanical polish electro-polish Eeff=400GPa 0 1 2 3 4 0 0.01 0.02 0.03 Indentation Strain In dentati o n S tr e s s , G P a vibro-polish electro-polish Eeff=400GPa
(a)
(b)
Figure 6. Comparison between the indentation stress-strain responses in (a) mechanically polished and electro-polished surfaces and (b) electro-polished and vibro-polished surfaces of annealed W. These tests were carried out using a 13.5 μm spherical indenter. Figure adapted from Pathak et al. [33].
This work also investigated the effect of oxide films, present on most metal surfaces, on the indentation stress-strain curves using samples of electro-polished tungsten (with a 5-10 nm oxide layer on its surface) and electro-polished silver (negligible oxide layer thickness). Our results indicate that the influence of small surface oxide layers is largely reflected in the very early parts of the measured load-displacement data. Thus, for a metal like tungsten with a ~10 nm oxide thickness on the surface, deleting a slightly larger portion of the initial loading segment brings the measured load-displacement data in excellent agreement with the predictions of the Hertz’s theory. This indicates that our data analysis methodologies described in Tasks 1 and 2 are able to identify the regime in the initial loading segment consistent with Hertz’s theory – as long as the oxide film thickness is smaller than the elastic indentation depth. However, care should be exercised in measurements on surfaces with a larger oxide layer – if the thickness of the oxide layer is significant compared to the elastic indentation depth in the initial loading segment, then it would become very difficult to extract the linear portion of the indentation stress-strain curve using the analyses methods described here. In such situations, one needs to either find a way to remove or reduce the surface layer or use an indenter with a bigger tip radius.
Nanoindentation experiments are also affected by the occurrence of the so called ‘pop-in’ events – when the indenter suddenly experiences an increase in penetration depth without any major increase in the applied indentation load (in a load controlled experiment). These pop-ins,
which are generally associated with the onset of plastic deformation [34] in the indentation experiment, often generate significantly high stresses that have been estimated to be close to the theoretical limit (G/2π[35], where G is the shear modulus) of the material [36-43]. Our analyses procedures, with its ability of monitoring the indentation stress and strain continuously throughout the indentation process, can be efficiently used in investigating the cause of these events during nano-scale contacts.
0 5 10 15 20 0 50 100 150 Displacement, nm Loa d, m N 0 5 10 15 20 0 50 100 150 Displacement, nm Loa d , m N 0 0.5 1 1.5 2 2.5 3 3.5 0 0.01 0.02 0.03 0.04 Indentation Strain In d en ta ti o n S tr ess, G P a 0 0.5 1 1.5 2 2.5 3 3.5 0 0.01 0.02 0.03 0.04 Indentation Strain In dent at io n S tres s, G P a Test 1 (pop-in) Test 2 Test 3 Test 1 (pop-in) Test 2 Test 3 Test 4 Test 5 Test 6 Test 4 Test 5 Test 6 0 1 2 3 0 10 20 30
Pop-in Eeff=190GPa
Eeff=205 GPa
(a)
(b)
(c)
(d)
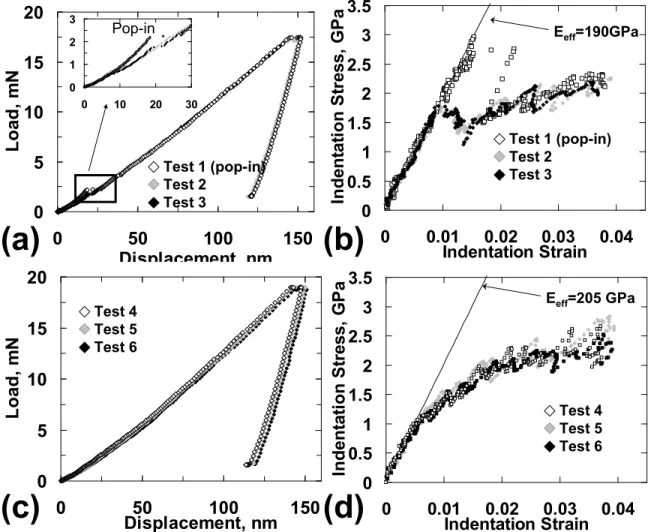
Figure 7. Nanoindentation of vibro-polished Fe-3%Si samples using the 13.5 μm indenter: multiple (a) load-displacement and (b) indentation stress-strain curves measured in annealed Fe-3%Si steel showing the stochastic occurrence of pop-ins with the larger 13.5 μm indenter where only Test #1 shows a pop-in event occurring in the annealed sample. When the Fe-3%Si sample is deformed to 30%, no pop-ins are visible in the (c) load-displacement or the (d) indentation stress-strain curves. Note that the orientations of the indented grains are different in Tests 1-3 vs. Tests 4-6, leading to their different modulus values [30]. Figure adapted from Pathak et al. [33].
Pop-ins events in vibro-polished samples of Fe-3%Si steel using a 13.5 µm indenter are shown in Figure 7(a) and (b). As seen from these figures, the indentation stress-strain curves
after the pop-in event seem to approach the indentation stress-strain curves obtained on the sample without the pop-in. This suggests that the pop-ins observed in these tests are caused by delayed activation of sources for plastic deformation, where the delayed initiation of plasticity extends the initial elastic regime. However, as soon as a good number of sources for plastic deformation get activated, the response is no different than the response obtained in the tests without the pop-in event. In other words, further loading after the pop-in event appears to completely wipe out the memory of the pop-in event; there is no effect on the indentation stress-strain curves at larger indentation stress-strains.
If the pop-ins are indeed caused by delayed activation of dislocation sources, then indentation measurements on cold-worked samples should show a lower propensity for the occurrence of pop-ins. This was verified by conducting spherical indentation on samples of vibro-polished annealed and 30% deformed of Fe-3%Si steel (see Figure 7c and d). It is seen that the occurrence of pop-ins is stochastic in the indentations on the annealed sample (Figure 7a and b), but are completely absent in the indentations on the 30% deformed sample (Figure 7c and d). Similarly, rough mechanical polishing – which too increases the dislocation density content in the top surface layer in the sample – was also found to reduce the occurrence of pop-ins significantly.
In summary, electro-polishing or vibro-polishing of metal surfaces is recommended, especially when extracting material properties from the initial loading segment in nanoindentation. Our analyses techniques are also found to be valid for metal samples with a thin layer of surface oxide film.
Task 4. Establishing local structure-property relationships at lower length scales in polycrystalline materials (Publication D [30])
The analyses techniques described in Task 1, with their ability to analyze precisely the initial loading segments of spherical nanoindentation experiments, are also ideally suited to investigate the differences in the plastic properties (namely the yield point designating the onset of plasticity) in individual crystals of a polycrystalline metal sample. This task reports on the further development of these nanoindentation data analyses procedures with the specific aim of characterizing the local indentation yield strengths in individual grains of deformed polycrystalline metallic samples and relating them to increases in the local slip resistances. It is important here to recognize that it is necessary to extract the local indentation modulus and yield
strengths from an analysis of the initial loading segment in the indentation experiment, because the indentation itself will alter the local microstructure and its properties once it imposes additional local plastic deformation.
0 50 100 150 0 5 10 15 20 25 Displacement, nm Lo ad , m N Near (111) As Cast 30% deformed Near (111) As Cast 30% deformed Eeff= 202 GPa Yind 0 0.01 0.02 0.03 0 0.5 1 1.5 2 2.5 3 Indentation Strain Ind e nta tion S tre ss , GPa
(b)
(c)
0
0.2
0.4
0.6
0.8
1
1.2
1.4
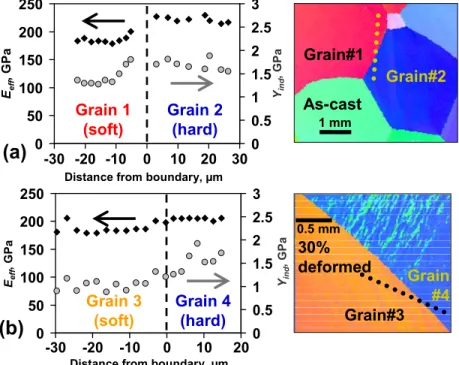
(100) (111) (100) (111) Widely spaced dislocation loops Close spaced dislocation loops Indentation Yield Str ess ( Yin d ), GPa As Cast 30% deformed Ri= 13.5 μm Ri= 13.5 μm(a)
Figure 8. (a) Causes for the change in indentation yield strength (Yind) in metals. In an as-cast Fe-3%Si
sample 5, the dislocation content is fairly uniform across all the grains in the metal. Here Yind varies from
one grain to another mainly due to the differences in the activities of the different slip systems in the different grains and their orientation with the indentation direction. When the metal is 30% deformed, its dislocation content increases and varies both within individual grains and between grains. The Yind in
deformed samples therefore depends on both the grain orientation and the dislocation content at the indentation site. (b) and (c) show the typical load-displacement response and the corresponding indentation stress-strain curves respectively for spherical indentations performed on near (111) grains in Fe-3%Si steel. A 13.5 µm radius spherical indenter was used for the tests. Figure adapted from Pathak et al. [45].
5 Note that although the as-cast state represents a low and uniform dislocation density for the Fe-3%Si sample, the same is not true for all metallic systems. For example, FCC metals that contract more on solidification often have a high dislocation density and significant in-grain misorientations due to contraction stresses [44]. These samples would then need to be annealed to attain a low and uniform dislocation density.
Specifically, the objective in this task is to establish correlations between local crystal lattice orientation at the indentation site and the indentation properties extracted from spherical nanoindentation stress-strain curves. In most currently used experimental protocols, the differences in properties extracted from different locations on a given polycrystalline sample are simply treated as “experimental scatter” and just averaged in reporting the measured properties. However it is argued here that these differences arise because of the inherent differences in the local material structure at the indentation site. For example, it is fully expected that the indentation yield strength will vary significantly from one crystal orientation to another, even in fully annealed samples where there are no major differences in the dislocation content of the differently oriented grains (see the illustration in Figure 8). This is because the plastic deformation imposed by the indenter needs to be accommodated locally at the indentation site by slip activity on the available slip systems, whose orientation and activation are strongly dependent on the local crystal lattice orientation with respect to the indentation direction. It is now possible to measure the local lattice orientation in polycrystalline samples using a technique called Orientation Imaging Microscopy (OIM) [46, 47]. This method is based on automated indexing of back-scattered electron diffraction patterns (obtained using a scanning electron microscope) and has a spatial resolution of less than a micron, with certain new enhancements promising to improve the spatial resolution to below 10 nms [48]. Therefore, coupling the structure information obtained from OIM with the mechanical data obtained from nanoindentation should produce vastly enriched datasets that are potentially capable of providing new insights into the local elastic-plastic properties of interest.
One major challenge for this task arises from the fact that the mechanical response of individual grains is inherently anisotropic, whereas almost all of our nanoindentation data analyses methods are built on Hertz’s theory [14] that assumes an isotropic elastic material behavior. For this task, the approach suggested by Vlassak and Nix [49] has been followed for elastic indentation of anisotropic samples. These authors suggest that Eqs. (7) and (8) can be used for elastic indentation of cubic crystals, provided an anisotropy parameter, , is appropriately introduced into the definition of the effective indentation modulus. In particular, they suggest that Eq. (8) be modified as
i i s s eff E E E 2 2 1 1 1 1 (12)