Large-Scale Triaxial Testing and
Numerical Modeling of Rounded
and Angular Rockll Materials
A. Aghaei Araei
1, A. Soroush
2;and M. Rayhani
3Abstract. This paper studies the behavior of a number of blasting (angular) and alluvium (rounded) modeled rockll materials by conducting large-scale triaxial testing, as well as numerical modeling. The numerical modeling is based on an elasto-plastic theory and enables one to predict the stress-strain-volumetric behavior of materials during shearing. The material parameters were determined from the experimental and numerical modeling. Variations of the material parameters, with respect to the conning pressure, Los Angeles abrasion, Point Load index, and particle breakage were investigated. Also, for design applications, curves tted to the data are presented.
Keywords: Rockll materials; Triaxial testing; Numerical modeling; Particle breakage.
INTRODUCTION
Rockll dams are increasingly used because of their inherent exibility, capacity to absorb large seismic energy, and their adaptability to various foundation conditions. The use of modern earth and rockll moving equipment and locally available materials make such dams economical as well. Rockll materials consist primarily of angular to sub-angular blocks and particles obtained by blasting rocks or rounded to sub-rounded particles extracted from river beds.
The behavior of rockll materials is aected by such factors as mineralogical composition, particle grading, fragmentation of particles, size and shape of particles, and stress conditions. Testing rockll materials and modeling their behavior are essential prerequisites to realistic analyses and economic design of rockll dams.
Rockll materials contain particles of large sizes
1. Iran University of Science and Technology, Tehran, P.O. Box 16765-163, Iran.
2. Department of Civil and Environmental Engineering, Amirk-abir University of Technology, Tehran, P.O. Box 01232747, Iran.
3. Department of Civil and Environmental Engineering, Car-leton University, Ottawa, Ontario, K1S 5B6, Canada. *. Corresponding author. E-mail: [email protected]
Received 27 June 2009; received in revised form 17 October 2009; accepted 20 February 2010
and their testing requires equipment of formidable dimensions. Therefore, the sizes of particles for test-ing are reduced, usually ustest-ing modeltest-ing techniques. Four modeling techniques are available: the scaling technique [1], the parallel gradation technique [2], the generation of quadratic grain-curve technique [3] and the replacement technique [4]. Among them, the parallel gradation technique has been considered most appropriate by Ramamurthy and Gupta [5].
In high rockll dams, particles of an underlying layer may be broken due to high stresses induced by the upper layers. Particle breakage and crushing of large particles to smaller ones result in lower strength and higher deformability. In earthquake prone regions, the latter is favored, as far as the behavior of rockll dams is concerned.
The degradation of particles inuences the strength and deformation behavior of coarse granular media [6-16]. Marsal [6] performed triaxial compression tests on coarse granular materials and found out that the most important factor aecting the shear strength and compressibility of the materials is the fragmen-tation of the granular body during compression and deviatoric loading. All granular aggregates subjected to stresses above normal geotechnical ranges exhibit considerable particle breakage [17-19]; however, parti-cle breakage of rocklls may even occur at low conning pressures [10,20]. Particle crushing causes volumetric
contraction in drained loading and pore pressure build up in undrained loading [21].
Varadarajan et al. [11] investigated the behavior of two dam site rockll materials in triaxial compres-sion testing; the rst material consisted of rounded particles, and the second of angular particles. They observed that the volume change behavior of the two rocklls is signicantly dierent. The rounded material exhibited continuous volume contraction, while the angular materials dilated after initial compression in volume. Also, they observed that a greater degree of particle breakage occurs with angular and larger particles because of the greater force per contact.
The two major factors governing the shear re-sistance of rockll materials are interlocking between particles and particle breakage. The eect of increase in interlocking is to increase the shearing resistance, while the eect of breakage of particles is vice versa. Obviously, angular particles are more susceptible to breakage than rounded particles. Alluvial materials at high conning pressures show an increase in the angle of shearing resistance as the size of the parti-cles increases [11,22,23], whereas materials produced from rock blasting show a decrease in the angle of shearing resistance as the size of the particles in-creases [11,24].
This paper studies the behavior of a number of angular and rounded rockll materials by conducting large-scale triaxial testing, as well as numerical model-ing, using the elasto-plastic Hardening Soil Model [25]. The numerical modeling enables one to predict the stress-strain-volumetric behavior of the materials dur-ing sheardur-ing.
MATERIALS PROPERTIES
The materials under study are from the shell of eleven rockll dams constructed or under construction in Iran. These materials lie essentially in two distinct categories: river alluvium, which are mainly rounded or subrounded, and particles produced from the blasting of rock quarries, which are mainly angular or sub-angular. The above two types of material will be referred, hereafter, in the paper, respectively, as \al-luvium" and \blasting" materials. Table 1 summarizes the materials characteristics including rockll type, mineralogy, size distribution, Loss Angeles abrasion (ASTM C 535), Point Load Strength index (ASTM D 5731), dry density and optimum water content. The maximum dry densities are estimated according to ASTM D1557. For the purpose of brevity, the names of the materials are introduced with their abbrevia-tions.
EXPERIMENTAL PROGRAM
The gradations of the materials for triaxial testing are derived using the parallel gradation modeling technique with a maximum particle size of 50 mm, which is 1/6 of the diameter of the triaxial cell, as shown in Figure 1. The ranges of conning pressure are chosen according to the stress levels in the dams (50 kPa to 1500 kPa). Consolidated Drained (CD) triaxial testing is conducted on the modeled rockll specimens with dimensions of 300 mm in diameter and 600 mm in height, using the large-scale triaxial equipment at the Geotechnical Department of Build-Table 1. Characteristics of rockll materials used in large-scale triaxial testing.
Material Dam Symbol
Passing 39.2 mm (%) Passing 25.4 mm (%) Passing 4.75 mm (%) Passing 0.2 mm (%) Los Angeles Abrasion (LA) (%) Point Load Index
(Is)
d
(95%) (kN/m3)
Wopt
(%)
Lime stone Roodbar BLRa 96 84 38 8 30 2.11 21 7.9
Sand stone Vanyar BSV 96 84 38 8 32 2.75 20.8 9.7
Andesibasalt Sabalan BABS 95 72 37 4 28 5.45 21.1 4.5
Blasting Dasite Zonoz BDZ 80 72 37 10 20 5.42 21 7.1
Andesite Aydoghmosh-G1 BAA1 96 84 37 8 19 3.95 21.8 6.5
Aydoghmosh-P BAA2 91 63 0 21.8
Lime stone Siah Bisheh BLS1 95 85 43 5.5 40 2.75 21b,c 5.33
BLS2 21.5b
Andesi-Dasite Yamchi-G1 AADY1 97.5 91 62 10 32 NIAd 20.5 9
Yamchi-G2 AADY2 70 35 7
Alluvium Andesi-Basalt Ghale-Chai AABG 92 78 43 10 26 NIA 21.4 9.9
Deurite-Basit Sahand-G1 ADBS1 97 91 62 10 46 NIA 20.5 9
Sahand-G2 ADBS2 96 84 37 8
Andesite Aydoghmosh-G2 AAA 82 73 25 1 19 NIA 22.3 7.4
Figure 1. Gradations of the modeled rockll materials. ing and Housing Research Center (BHRC), Tehran, Iran.
TESTING PROCEDURE
For each of the specimens, the quantity of various sizes of gain required to achieve the gradation of the modeled rockll materials for having the specimen at more than 95% maximum dry density is determined by weight. The individual fractions are mixed with distilled water to the optimum moisture content. The specimen materials are divided into six equal parts and prepared in six layers inside a split mold. Each of the layers is compacted using a vibrator with a frequency of 60 cycles/s. After passing CO2 and applying vacuum,
the specimen is saturated to more than 95% (Skempton B-value more than 95%) by allowing water to enter through the base of the triaxial cell and remove the air bubbles. The specimen is subjected rst to the required consolidation pressure and then is sheared to failure by applying axial loading at a rate of 0.5 mm/min. A few tests are repeated to verify the reproducibility of the results. Axial loading, vertical displacements and volume changes are monitored and recorded at periodic intervals during the tests.
TESTS RESULTS Immediate Results
Stress-strain-volume change behaviors of eight modeled blasting rockll materials subjected to triaxial testing are shown in Figures 2 to 9. It is observed that, in general, axial strain at failure increases with an increase in conning stress. All the blasting materials showed mixed trends (dilation and compression) in their volume change behavior, depending on their conning pressures.
The stress-strain-volume change behaviors of ve alluvium rockll materials are shown in Figures 10
Figure 2. Stress-strain-volume change relationships of BLR.
Figure 3. Stress-strain-volume change relationships of BSV.
Figure 4. Stress-strain-volume change relationships of BABS.
Figure 5. Stress-strain-volume change relationships of BDZ.
Figure 6. Stress-strain-volume change relationships of BAA1.
Figure 7. Stress-strain-volume change relationships of BAA2.
Figure 8. Stress-strain-volume change relationships of BLS1.
Figure 9. Stress-strain-volume change relationships of BLS2.
to 15. In these materials, axial strain at failure also increases with conning pressure. The dilation in volumetric strain decreases considerably with an increase in conning pressure.
In these high compacted specimens, a leveling out of the "v : "1 behavior occurs in some of the
specimens at low conning pressures due to strain localization. At high conning pressures, the highly compacted specimens bulge uniformly in the vicinity of peak stress and develop complex multiple sym-metrical radial shear bands at higher axial strain levels [26].
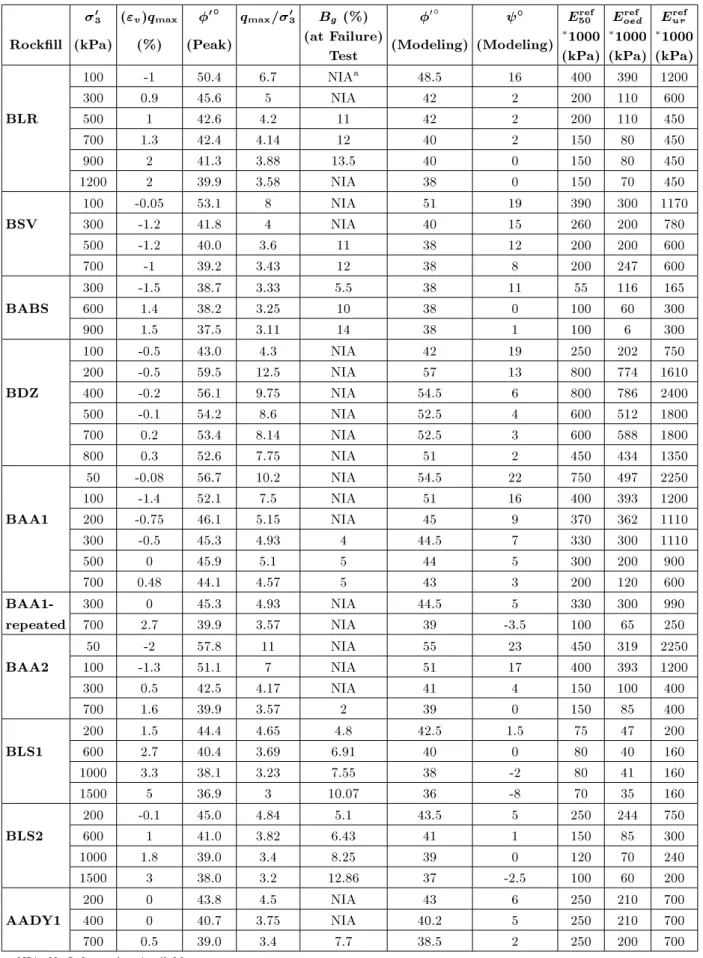
Compiled Results
The compiled tests results of the tests, such as volumet-ric strain at maximum shear stress ("v)qmax, eective
internal friction angle at maximum shear stress (0),
ratio of maximum deviator stress to conning pressure (qmax
0
3 ) and Marsal's breakage index (Bg) [6] are
pre-sented in Table 2. This table contains also a number of other parameters, which will be referred to in the coming sections.
Figure 10. Stress-strain-volume change relationships of AAY1.
Table 2. Results of triaxial tests and numerical modeling on rockll materials (continued). 0
3 ("v)qmax 0 qmax=03 Bg (%) 0 E50ref Eoedref Erefur
Rockll (kPa) (%) (Peak) (at Failure)
Test (Modeling) (Modeling)
1000
(kPa)
1000
(kPa)
1000
(kPa)
100 -1 50.4 6.7 NIAa 48.5 16 400 390 1200
300 0.9 45.6 5 NIA 42 2 200 110 600
BLR 500 1 42.6 4.2 11 42 2 200 110 450
700 1.3 42.4 4.14 12 40 2 150 80 450
900 2 41.3 3.88 13.5 40 0 150 80 450
1200 2 39.9 3.58 NIA 38 0 150 70 450
100 -0.05 53.1 8 NIA 51 19 390 300 1170
BSV 300 -1.2 41.8 4 NIA 40 15 260 200 780
500 -1.2 40.0 3.6 11 38 12 200 200 600
700 -1 39.2 3.43 12 38 8 200 247 600
300 -1.5 38.7 3.33 5.5 38 11 55 116 165
BABS 600 1.4 38.2 3.25 10 38 0 100 60 300
900 1.5 37.5 3.11 14 38 1 100 6 300
100 -0.5 43.0 4.3 NIA 42 19 250 202 750
200 -0.5 59.5 12.5 NIA 57 13 800 774 1610
BDZ 400 -0.2 56.1 9.75 NIA 54.5 6 800 786 2400
500 -0.1 54.2 8.6 NIA 52.5 4 600 512 1800
700 0.2 53.4 8.14 NIA 52.5 3 600 588 1800
800 0.3 52.6 7.75 NIA 51 2 450 434 1350
50 -0.08 56.7 10.2 NIA 54.5 22 750 497 2250
100 -1.4 52.1 7.5 NIA 51 16 400 393 1200
BAA1 200 -0.75 46.1 5.15 NIA 45 9 370 362 1110
300 -0.5 45.3 4.93 4 44.5 7 330 300 1110
500 0 45.9 5.1 5 44 5 300 200 900
700 0.48 44.1 4.57 5 43 3 200 120 600
BAA1- 300 0 45.3 4.93 NIA 44.5 5 330 300 990
repeated 700 2.7 39.9 3.57 NIA 39 -3.5 100 65 250
50 -2 57.8 11 NIA 55 23 450 319 2250
BAA2 100 -1.3 51.1 7 NIA 51 17 400 393 1200
300 0.5 42.5 4.17 NIA 41 4 150 100 400
700 1.6 39.9 3.57 2 39 0 150 85 400
200 1.5 44.4 4.65 4.8 42.5 1.5 75 47 200
BLS1 600 2.7 40.4 3.69 6.91 40 0 80 40 160
1000 3.3 38.1 3.23 7.55 38 -2 80 41 160
1500 5 36.9 3 10.07 36 -8 70 35 160
200 -0.1 45.0 4.84 5.1 43.5 5 250 244 750
BLS2 600 1 41.0 3.82 6.43 41 1 150 85 300
1000 1.8 39.0 3.4 8.25 39 0 120 70 240
1500 3 38.0 3.2 12.86 37 -2.5 100 60 200
200 0 43.8 4.5 NIA 43 6 250 210 700
AADY1 400 0 40.7 3.75 NIA 40.2 5 250 210 700
700 0.5 39.0 3.4 7.7 38.5 2 250 200 700
a: NIA: No Information Available.
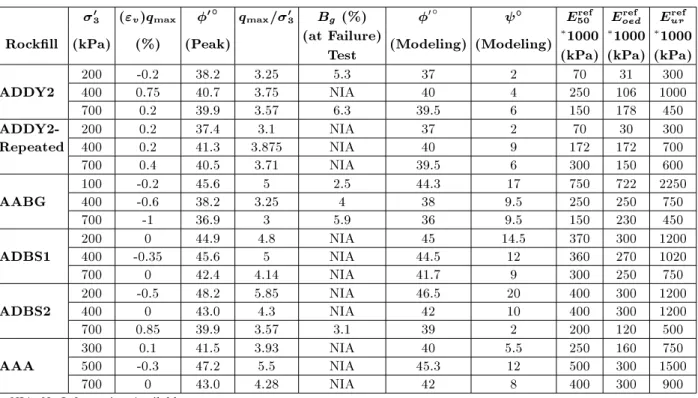
Table 2. Continued. 0
3 ("v)qmax 0 qmax=03 Bg (%) 0 E50ref Eoedref Eurref
Rockll (kPa) (%) (Peak) (at Failure)
Test (Modeling) (Modeling)
1000
(kPa)
1000
(kPa)
1000
(kPa)
200 -0.2 38.2 3.25 5.3 37 2 70 31 300
ADDY2 400 0.75 40.7 3.75 NIA 40 4 250 106 1000
700 0.2 39.9 3.57 6.3 39.5 6 150 178 450
ADDY2- 200 0.2 37.4 3.1 NIA 37 2 70 30 300
Repeated 400 0.2 41.3 3.875 NIA 40 9 172 172 700
700 0.4 40.5 3.71 NIA 39.5 6 300 150 600
100 -0.2 45.6 5 2.5 44.3 17 750 722 2250
AABG 400 -0.6 38.2 3.25 4 38 9.5 250 250 750
700 -1 36.9 3 5.9 36 9.5 150 230 450
200 0 44.9 4.8 NIA 45 14.5 370 300 1200
ADBS1 400 -0.35 45.6 5 NIA 44.5 12 360 270 1020
700 0 42.4 4.14 NIA 41.7 9 300 250 750
200 -0.5 48.2 5.85 NIA 46.5 20 400 300 1200
ADBS2 400 0 43.0 4.3 NIA 42 10 400 300 1200
700 0.85 39.9 3.57 3.1 39 2 200 120 500
300 0.1 41.5 3.93 NIA 40 5.5 250 160 750
AAA 500 -0.3 47.2 5.5 NIA 45.3 12 500 300 1500
700 0 43.0 4.28 NIA 42 8 400 300 900
a: NIA: No Information Available.
Other parameters of the Hardening Soil model: vur= 0:25, pref= 500 kPa, m = 0:35, c := 0, Rf = 0:9, knc0 = 1 sin .
Figure 11. Stress-strain-volume change relationships of
Figure 13. Stress-strain-volume change relationships of ADBS1.
Figure 14. Stress-strain-volume change relationships of ADBS2.
Figure 15. Stress-strain-volume change relationships of AAA.
("v)qmax : 3
Variations of the volumetric strain at maximum shear stress ("v)qmax versus conning pressure (03) for the
blasting and alluvium materials are shown in Figure 16. This gure indicates that for almost all of the blasting materials, ("v)qmax is negative (i.e., dilative behavior)
at low conning pressures and positive at high conning pressures (i.e., contractive behavior). The only excep-tion is BSV, in which ("v)qmax remains negative, even
for high conning pressures. The variations of ("v)qmax
with conning pressures for the alluvium materials are less pronounced, and range from -1% to +1%; whereas the variations for the blasting materials are more, and range from -2% to +5%.
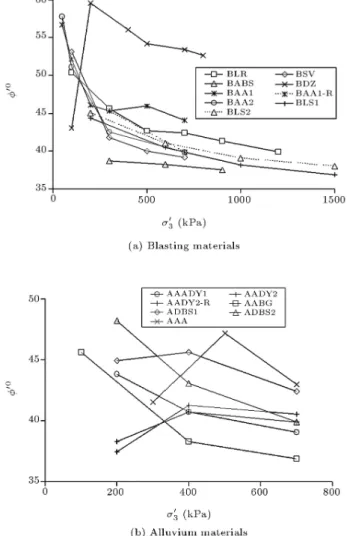
0 : 3
The variations of internal friction angle versus conning pressure for the blasting and alluvium materials are presented in Figure 17. Friction angles are calculated for each single conning pressure, assuming c = 0 and using the following equation:
sin 0 =01 30
0
1+ 30: (1)
Figure 17a indicates that the internal friction angle of the blasting materials decreases with increasing of the
Figure 16. Volumetric strain at maximum shear stress versus conning pressure.
conning pressure. This is, in fact, due to the eect of particle breakage. The behavior of BDZ materials is an exception in which the internal friction angle rst increases sharply from 43 for 0
3 = 100 kPa to 59
for 0
3 = 200 kPa, then 0 decreases moderately to
about 53 for 0
3 = 800 kPa. For this material, it
seems that particle breakage did not happen in the lower stress levels, and that strain localization also occurred very early before the peak, corresponding to a non-homogeneous strain at low conning pressures. At higher stress levels, the amount of softening decreased and some breakage occurred, leading to a decrease in 0; however, it still remains higher than the initial 0
at 0
3 = 100 kPa. This behavior may be attributed
to the fact that this material is relatively hard and sti, as indicated by its Los Angeles abrasion and point load index, Is(Table 1). Generally, the internal
ction angle for blasting materials ranges between 59
to 38 for the conning pressures ranging from 50 to
1500 kPa.
Figure 17b shows that the internal friction angle for some of the alluvium materials (e.g. AADY2,
Figure 17. Internal friction angle versus conning pressure.
ADBS1 and AAA) increases, due to less interlocking, with conning pressures up to 400-500 kPa, and then decreases due to particle breakage, in the higher con-ning pressure. In these materials, pre-peak strain localization may have occurred, corresponding to a non-homogeneous strain at low conning pressure, which has led to lower values of internal friction angles. In higher stress levels (up to 400-500 kPa), the degree of softening decreases and, at stress levels higher than 500 kPa, some breakage has also occurred, which resulted in decreasing the friction angle. For ADBS2, AADY1, and AABG alluvium materials, continuous decreases in the internal friction angle are observed with an increase in the conning pressures. Generally, the internal friction angle of the alluvium materials for the conning pressures of 100-700 kPa ranges between 49
-37.
In general, the reduction rate of 0for the blasting
materials at low conning pressures is much higher than the same rate for the alluvium materials.
Data presented in Tables 1 and 2 suggests that particle gradation has signicant eects on the value
of the internal friction angle for both blasting and alluvium materials. Generally, 0for blasting materials
subjected to a specic conning pressure decreases with an increase in the size of the particle. For example, the internal friction angle decreases by changing from BAA1 to BAA2 grading (see Figure 1). A similar trend is obvious for the alluvium materials; for example, 0 decrease by changing from AADY1 to AADY2 or
from ADBS1 to ADBS2 grading. The above behavior may be attributed to the fact that particle breakage potential in materials with relatively larger particles is comparatively higher.
Eect of Point Load Index and Los Angeles Abrasion
Individual particle strength is one of the factors that aects the shear strength of the rockll materials, in particular, as the particle is subjected to high interparticle stresses during shearing. The strength of rock particles is usually evaluated by the point load test (ASTM D5731).
Figure 18 presents variations of 0versus the ratio
of Point Load index to Los Angeles abrasion (Is
LA)
for each of the blasting materials. As expected, sti materials have higher friction angles.
Particle Breakage
Breakage of the particles was observed during the triaxial tests. The breakage is usually expressed quantitatively by the breakage index, Bg [6]. The
value of Bg is calculated by sieving the sample
us-ing a set of sieves (50 to 0.075 mm) before and after testing. The percentage of particles retained in each sieve is determined at both stages. Due to breakage of particles, the percentage of the particles retained in large size sieves will decrease and the percentage of particles retained in small size sieves
Figure 18. Variation of 0 versus I
s=LA for the blasting
materials.
will increase. The sum of the decreases will be equal to the sum of increases in the percentage retained. The decrease (or increase) is the value of the breakage factor, Bg.
Figure 19 shows variations of the maximum prin-ciple stress ratio, (01
0
3)max, versus Marsal breakage
index (Bg) for the alluvium and blasting materials.
As expected, Bg increases as (
0 1
0
3)max decreases.
Con-sequently, it can be inferred that the friction angle decreases with an increase in Bg (see also Table 2).
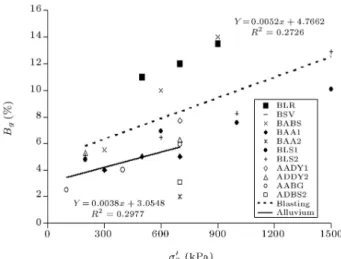
Figure 20 presents variations of breakage index versus conning pressure for the two material types. Although the data are scattered, Bgincreases generally
as 0
3 increases, with a slightly higher rate of increase
for the blasting materials. The eect of particle size and conning pressure on Bg for the blasting
material is more signicant than for the alluvium materials [11].
Figure 19. Variations of maximum principle stress ratio (10
0
3)max versus Marsal breakage index (Bg).
Figure 20. Variations of maximum breakage index (Bg)
versus 0 3.
NUMERICAL MODELING Constitutive Model
The elasto-plastic Hardening Soil Model [25], adopted in the PLAXIS nite element computer code [27], was employed for numerical analyses. This model uses principles of the hyperbolic model [28] and formulates plastic stresses and strains. The Hardening Soil Model (HSM) supersedes the hyperbolic model by:
(a) Using the theory of plasticity rather than the theory of elasticity;
(b) Including soil dilatancy; (c) Introducing a yield cap.
The model computes volume changes induced by dila-tion and employs the yield cap for dening volumetric failures. Some basic characteristics of the model are as follows:
(a) Stress-dependent stiness according to a power law (input parameter, m);
(b) Plastic straining due to primary deviatoric loading (input parameter, Eref
50);
(c) Plastic straining due to primary compression (in-put parameter, Eref
oed);
(d) Elastic unloading/reloading (input parameters, Eref
ur, ur);
(e) Failure, according to the Mohr-Coulomb model (input parameters, c, 0and ). The model relates
the dilation angle, , to the volumetric and major principal strains, as follows:
"v
"1 =
2 sin
1 sin : (2)
The verication and modeling of some large-scale triaxial tests and nite element back analyses of the Masjed-E-Soleyman dam showed that the Hardening Soil model is capable of favorably simulating the behavior of rockll materials [29,30].
Analysis Procedure
In order to substantiate values of the parameters, such as 0 and , and to estimate values of the special
parameters for the Hardening Soil model (Eref 50, Eoedref,
Eref
ur), we simulated, numerically, the triaxial tests
introduced in the foregoing sections. The reference stress for the stiness in the model was chosen 500 kPa. Based on the simulation results, some empirical correlations are suggested. The HSM is not able to predict the degree of particle breakage at increments of shearing.
Results of Numerical Analyses
Values for the above parameters (0, , Eref
50, Eoedref and
Eref
ur) were selected, so that numerical analyses resulted
in the best ts with test results (q : "1 and "v : "1).
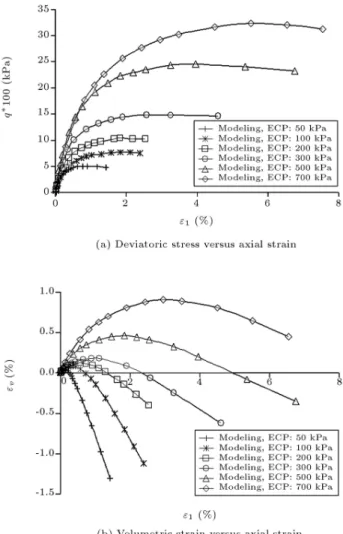
The above values are presented in Table 2. Figure 21 compares the stress-strain and volumetric behaviors resulted from analyses for specimen BAA1, which is angular. Figure 22 presents the same comparison for specimen ADBS1, which is rounded. Good agreement between these results and their corresponding test results (Figures 6 and 13, respectively) is evident, indicating that the HSM is capable of capturing the behavior of rockll materials. These results are typical; favorable results were obtained for the other rockll type specimens. For each of the materials, a value of 0for the reference stress value of 500 kPa, used for the
numerical analyses, is selected two degrees less than the 0 value resulted from Equation 1.
Data presented in Table 2 suggests that, generally, the secant stiness (Eref
50), tangent stiness (Eoedref), and
stiness in unloading and reloading (Eref
ur) decrease as
0
3increases. The behavior of BDZ, AADY2 and AAA
are exceptions, in which the values of the mentioned parameters rst increase (probably due to interlocking) with increase of conning pressure, and then decrease (probably due to particle breakage), at higher conning pressure.
Figure 22. Computed results of triaxial testing on ADBS1.
Figure 23. Variation of Eref
50 versus 0 for the blasting
and alluvium materials.
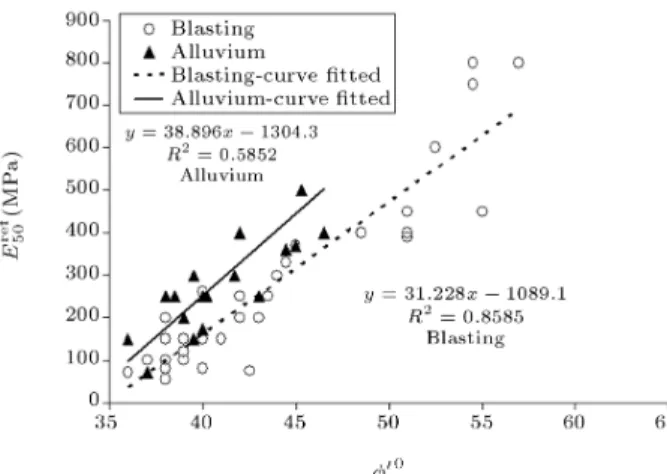
Figure 23 shows variations of Eref
50 versus 0 (for
reference stress of 500 kPa) for the alluvium and blasting materials separately. Reasonable linear rela-tionships exist for the data. As expected, Eref
50 increases
as 0 increases for both types of rockll material. It is
seen that for a given 0, Eref
50 is comparatively higher for
the alluvium materials. The following equations may be used for estimating Eref
50 as a function of 0.
Eref
50=312280 1000000; for blasting materials; (3)
Eref
50=393300 106; for alluvium materials; (4)
where Eref
50 is in kPa and 0 is in degree. Similar trends
are obtained for Eref
oed and Eurref.
Figures 24a and 24b show variations of Eref 50,
respectively, versus Eref
ur and Eoedref for the materials.
Obviously, linear and almost identical relationships
Figure 24. Variation of Eref
50 versus (a) Eurrefand (b) Eoedref
exist between these parameters, as follows: Eref
50 = 0:31Eurref+ 27000 (kPa);
for blasting materials; (5)
Eref
50 = 0:33Eurref+ 10000 (kPa);
for alluvium materials; (6)
Eref
50 = Eoedref + 48000 (kPa);
for blasting materials; (7)
Eref
50 = Eoedref + 63000 (kPa);
for alluvium materials: (8)
SUMMARY AND CONCLUSIONS
This paper presented the results of large scale triaxial testing in drained conditions on a number of rockll material specimens. Rockll materials fall basically into two distinct categories:
1. Materials collected from river sediment, which are rounded and/or subrounded (namely alluvium). 2. Materials from rock quarries, which are angular
and/or subangular(namely blasting).
The tests results revealed that the strength and de-formation parameters of the materials depend on such factors as type and size of particles, conning pres-sure during tests, Point Load index of the individual particles, and Los Angeles abrasion of the materials. A number of correlations between the above factors and the strength and deformation parameters of the materials are suggested. The main results can be summarized as follows:
Axial strain at failure of blasting and alluvium rock-lls increases with an increase in conning stress. The variations of ("v)qmax with conning pressures
for the alluvium materials are less pronounced and range from -1% to +1%; whereas the variations for the blasting materials are more, and range from -2% to +5%.
All the blasting and alluvium materials showed mixed trends (dilation and contraction) in their volume change behavior, depending on their con-ning pressures. The dilation in volumetric strain decreases considerably with an increase in conning pressure.
Generally, the internal ction angle for the blasting materials ranges between 59to 38for the conning
pressures ranging from 50 to 1500 kPa. The internal friction angle of the alluvium materials for the conning pressures of 100-700 kPa ranges between 49-37.
Generally, 0 for the blasting materials subjected
to a specic conning pressure, decreases with an increase in the size of the particle.
As expected, the stier materials, as dened by the Point Load Index and Los Angeles Abrasion, have relatively higher friction angles.
Generally, the internal friction angle of the blast-ing materials decreases with an increase in con-ning pressure; whereas the alluvium materials show mixed trends in their friction angle behavior, depending on their conning pressures, stiness and particle breakage.
In general, the reduction rate of 0 with conning
pressure for the blasting materials is much higher at low conning pressures than the same rate for the alluvium materials.
Generally, Bgincreases as 30 increases, with slightly
higher rate of increase for the blasting materials. The eect of particle size and conning pressure on Bgfor the blasting material is more signicant than
that on the alluvium materials.
The triaxial tests results were also numerically simulated by employing the Hardening Soil Model adopted in the PLAXIS computer code. Reasonable agreements between the simulation results and the tests results were observed, indicating that the Hardening Soil Model is capable of capturing the behavior of rockll materials. On the basis of the simulation results, the special parameters of the soil model are estimated using a number of correlations.
ACKNOWLEDGMENT
The authors are grateful to the Department of Geotech-nical Engineering, BHRC for conducting the tests and for nancial support, and to the Ministry of Energy, as the projects' client for providing data for this research. Also, the authors wish to thank the reviewers and referees of this paper for their constructive comments and valuable suggestions.
NOMENCLATURE
Bg Marsal's breakage index
c cohesion
Eref
50 secant stiness in standard drained
triaxial test Eref
oed tangent stiness for primary oedometer
loading Eref
ur stiness in unloading and reloading
Is point load index
m exponent factor for stress-level dependence of stiness
Pref reference stress for stiness
Rf failure ratio
Wopt optimum water content
d dry density
ur Poisson ratio for unloading/reloading
0 eective friction angle at maximum
shear stress dilation angle
q deviatoric stress
0
3 eective minor principal stress
LA Los Angeles abrasion
0
1 eective major principal stress
0
modeling simulated internal friction angle
"1 major principal strain
"v volumetric strain
REFERENCES
1. Zeller, J. and Wullimann, R. \The shear strength of the shell materials for the Ge-Schenenalp dam, Switzerland", Proc., 4th Inst., J. SMFE, London, 2, pp. 399-404 (1957).
2. Lowe, J. \Shear strength of coarse embankment dam materials", Proc., 8th Int. Congress on Large Dams, 3, pp. 745-761 (1964).
3. Fumagalli, E. \Tests on cohesionless materials for rockll dams", J. SMFE, ASCE, 95(1), pp. 313-332 (1969).
4. Frost, R.J. \Some testing experiences and characteris-tics of boulder-gravel lls in earth dam", ASTM, STP 523, pp. 207-233 (1973).
5. Ramamurthy, T. and Gupta, K.K. \Response paper on how one ought to determine soil parameters to be used in design of earth and rockll dams", Proc., Indian Geotechnical Conf., New Delhi, India, 2, pp. 15-19 (1986).
6. Marsal, R.J. \Large scale testing of rockll materials", J. SMFE, ASCE, 93(2), pp. 27-43 (1967).
7. Vesic, A.S. and Clough, G.W. \Behavior of granu-lar materials under high stresses", J. SMFE, ASCE, 94(3), pp. 661-688 (1968).
8. Hardin, B.O. \Crushing of soil particles", J. SMFE, ASCE, 111(10), pp. 1177-1192 (1985).
9. Indraratna, B., Ionescu, D. and Christie, H.D. \Shear behavior of railway ballast based on large-scale triaxial tests", J. SMFE, ASCE, 124(5), pp. 439-449 (1998). 10. Indraratna, B. and Salim, W. \Modeling of particle
breakage of coarse aggregates incorporating strength and dilatancy", Proceedings of the Institution of Civil Engineers, London, 155(4), pp. 243-252 (2002). 11. Varadarajan, A., Sharma, K.G., Venkatachalam, K.
and Gupta, A.K. \Testing and modeling two rockll materials", J. SMFE, ASCE, 129(3), pp. 206-218 (2003).
12. Salim, W. and Indraratna, B. \A new elastoplastic constitutive model for coarse granular aggregates in-corporating particle breakage" Can. Geotech. J., 41, pp. 657-671 (2004).
13. Gupta, A.K. \Eect of particle size and conning pressure on breakage and strength parameters of rockll materials", Electronic Journal of Geotechnical Engineering, 14, Bundle H, pp. 1-12 (2009).
14. Ghanbari, A., Sadeghpour, A.H., Mohamadzadeh, H. and Mohamadzadeh, M. \An experimental study on the behavior of rockll materials using large scale tests", Bundle G, Electronic Journal of Geotechnical Engineering, 13 (2008).
15. Habibagahi, G. and Taherian, M. \Prediction of col-lapse potential for compacted soils using articial neural networks", Scientia Iranica, 11(1&2), pp. 1-20 (2004).
16. Hosseini, S.M., Haeri, S.M. and Toll, D.G. \Behavior of gravely sand using critical state concepts", Scientia Iranica, 12(2), pp. 167-177 (2005).
17. Hirscheld, R.C. and Poulos, S.J. \High pressure triaxial tests on compacted sand and undisturbed silt", in Laboratory Shear Testing of Soils, ASTM, STP, 361, pp. 329-339 (1963).
18. Bilam, J. \Some aspects of the behavior of granular materials at high pressures", in Stress-Strain Behavior of Soils: Proceedings of the Roscoe Memorial Sympo-sium, Cambridge, R.H.G. Parry and G.T. Foulis, Eds., Co. Ltd., Henley-on-Thames, UK, pp. 69-80 (29-31 March 1971).
19. Lade, P.V., Yamamuro, J.A. and Bopp, P.A. \Signif-icance of particle crushing in granular materials", J. SMFE, ASCE, 122(4), pp. 309-316 (1996).
20. Miura, N. and O-hara, S. \Particle crushing of de-composed granite soil under shear stresses", Soils and Foundations, 19(3), pp. 1-14 (1979).
21. Russell, A.R. and Khalili, N. \A bounding surface plas-ticity model for sands exhibiting particle crushing", Can. Geotech. J., 41, pp. 1179-1192 (2004).
22. Sudhindra, C., Venkatachalam, K., Soni, M.L., Sivaku-mar, N. and Sharma, P. \Large size triaxial shear tests on rockll materials for design parameters", Proc. 56th Research and Development Session, CBIB, Hyderabad, pp. 29-34 (1991).
23. Venkatachalam, K. \Prediction of mechanical behavior of rockll materials", PhD Thesis, Indian Institute of Technology, Delhi, India (1993).
24. Marachi, N.d., Chan, C.K. and Seed, H.B. \Evaluation of properties of rockll materials", J. SMFE, 98(1), pp. 95-114 (1972).
25. Schanz, T., Vermeer, P.A. and Bonnier, P.G. \The hardening-soil model-formulation and verication", in Beyond 2000 in Computational GeotechNICS: Ten Years of Plaxis International, R.B.J. Brinkgreve, Ed., Balkema, Amsterdam, pp. 281-296 (1999).
26. Alshibli, K.A., Batiste, S.N. and Sture, S. \Strain localization in sand: plane strain versus triaxial com-pression", J. Geotech. Geoenviron. Eng., 129(6), pp. 483-494 (2003).
27. Brinkgreve, R.B.J. and Vermeer, P.A. \PLAXIS nite element code for soil and rock analyses", Version 7, Plaxis BV, Delft (1998).
28. Duncan, J.M. and Chang, C.Y. \Nonlinear analysis of stress and strain in soils", J. SMFE, ASCE, 96(5), Proceedings Paper 7513 (1970).
29. Aghaei Araei, A. \Back analysis of deformations in-duced during rst impounding of Masjed-E-Soleyman dam", MS Thesis, Department of Civil and Environ-mental Engineering, Amirkabir University of Technol-ogy, Tehran, Iran (2002).
30. Soroush, A. and Aghaei Araei, A. \Analysis of be-havior of a high rockll dam", GE Proceedings of the Institution of Civil Engineers (ICE), 159(1), pp. 49-59 (2006).
BIOGRAPHIES
Ata Aghaei Araei is a PhD candidate in the School of Civil Engineering at Iran University of Science and Technology (IUST) and also PhD Researcher at Geotechnical Laboratory of Civil Engineering at The University of Tokyo. He received his MS from the Amirkabir University of Technology (Tehran Polytech-nic) in 2002. He is working as a senior
geotech-nical engineer and head of geotechgeotech-nical laboratory at Building and Housing Research Center (BHRC) since 2003. Mr. Aghaei-Araei's primary research interests include: (i) Monotonic and dynamic testing on geomaterials, (ii) Microzonation, (iii) Geotechnical equipment construction.
Abbas Soroush is an associate professor in the Department of Civil and Environmental Engineering at the Amirkabir University of Technology (Tehran Polytechnic) since 1997. He received his PhD degree in Geotechnical Engineering under the supervision of Professor N.R. Morgenstern from the Department of Civil and Environmental Engineering, University of Alberta, Canada. His research interests cover a variety of subjects, including numerical modeling of geomaterials and soil structures, especially earth dams. Dr. Soroush is known as an expert in dam engineering and has attended several numbers of international expert panels for reviewing large dams in the coun-try.
Mohammad Rayhani is an Assistant Professor in the Department of Civil and Environmental Engineering at Carleton University. He received his PhD from the University of Western Ontario in 2007. Prior to joining Carleton University in 2009, he worked as a postdoctoral fellow and adjunct professor at Queen's university between 2007 and 2009. He has over 10 years experience in the eld of geotechnical engineering and geotechnical engineering research. He has been involved in over 20 engineering projects in Canada and Iran and has experience in foundation investigation and design, landll barrier design, geotechnical earthquake engineering, embankment dam design and slope stabil-ity. Dr. Rayhani's primary research interests include: (i) Landll barrier systems, (ii) Seismic site response and soil-structure interaction, and (iii) Geotechnical hazards.