Available online at www.centmapress.org
Int. J. Food System Dynamics 7 (4), 2016, 293-310
DOI: http://dx.doi.org/10.18461/ijfsd.v7i4.742
Consumers’ Preference for Sweet Peppers with different
Process Attributes: A Discrete Choice Experiment in Taiwan
Ching-Hua Yeh and Monika Hartmann
Dept. of Agricultural and Food Market Research, University of Bonn, Germany [email protected]; [email protected]
Received February 2016, accepted June 2016, available online July 2016
ABSTRACT
Based on an online discrete choice experiment (DCE) this study investigates the relative importance of food label information (country of origin, production methods, chemical residue testing (CRT)) and price for Taiwanese consumers’ in their purchase of sweet peppers. Results show that respondents focus mostly on the COO labeling during their sweet-pepper shopping, followed by price. Information concerning CRT results and production methods are of less importance. Our findings also indicate that interaction between attributes matter and that preference for attribute levels differs depending on socioeconomic characteristics.
1
Introduction
Agricultural practices in Taiwan are very intensive and characterized by an extensive use of chemical inputs (Mao and Schive, 1995; Francks et al., 1999; Lin, 2002; Yang, 2013; Yang, 2014). Furthermore, due to the high population density and the growing demand for food, Taiwan substantially depends on agricultural and food imports. This holds especially with respect to organic products. Over the last decade China and Japan have emerged as the two biggest sources of Taiwanese food imports, though from a quality and safety perspective Taiwanese consumers consider these two trading partners different (Customs Administration, 2014).
Thus, with a rising health consciousness on the one hand and frequent food scandals over the last years on the other hand consumers’ interest in COO and food safety labeling as well as in organic food products is on the rise (Hsieh, 2005; Chen, 2009; Chen, 2012; Liu et al., 2013; Tung et al., 2012). In order to increase transparency for consumers and thus to allow consumers to select the products according to their preferences the labeling of country of origin (COO) as well as of production methods (organic certified labeling) have been introduced in Taiwan (Food and Drug Administration, 2012; 2014; Council of Agriculture, 2007). Additionally, information on chemical residue testing (CRT) of food products are in some cases reported by food retailers and sellers in the Taiwanese market (Hsu et al., 2006; Greenpeace, 2012; Liu, 2013; Greenpeace 2016)1. Given this background the objective of the study is to understand Taiwanese consumers’ preference for food safety, production methods and origin labeling as well as the utility derived from the combination of the various attributes. More specifically, we want to test whether consumers differentiate between organic products depending on the COO and how CRT information and organic production is perceived on its own as well as in combination. As no chemicals are allowed to be applied in organic production, thus, chemical residuals should play no role in organic products. In addition, we are interested to gain insights with respect to the relevance of sociodemograhics for consumer preferences regarding the purchase of sweet peppers.
This paper is organized as follows. First, the method and data applied are presented. Second, the paper provides insights regarding the relative relevance of different product and process characteristics in determining Taiwanese consumers’ purchase decision of sweet papers taking into consideration potential interdependencies between those characteristics as well as of socio-demographics. The paper concludes with a discussion of the results.
2
Methods
To analyze Taiwanese consumers’ purchase decision we make use of the methodology of discrete choice experiment (DCE) (McFadden, 1974) which is derived from Lancaster’s new demand theory (Lancaster, 1966). The latter assumes that a consumer’s utility depends on product characteristics instead of the product itself. In accordance with utility maximizing behavior, consumers choose the product among the given alternatives that possesses the combination of attributes that maximizes his/her utility (Rachlin, 1980; McFadden, 1986). Assuming a linear indirect utility function, the utility of alternative j in choice situation s for individual i is
(1)
where is the attribute vector and is the corresponding parameter vector. is the stochastic components of the utility function which is assumed to be ‘identically and independently distributed’ (IID) (Carson et al., 1994; Train, 2009).
DCE data is firstly, analyzed using aggregate-level logit models. Calculated partworth utilities provide information on the values consumers assign to each attribute level. In addition, aggregate -level logit models allow to determine the interaction effects among attributes, and thus to investigate whether the combined effect of two attribute levels is significant different from the sum of the two main effect utilities. However, aggregate-level logit models assume that the coefficients of variables that enter the model are identical for all consumers, implying that different consumers with the same observed characteristics have the same values for each factor of the model which likely is not the case.
1
Pesticide residues are a problem in the Taiwanese vegetable market as a recent study by Greenpeace confirms (see
Furthermore, aggregate-level logit models are based on the ‘independence from irrelevant alternatives’ (IIA) assumption. This implies that the odds of choosing product 1 over product 2 should not depend on whether some other alternative 3 is present or absent (Train, 2009).
The hierarchical Bayesian inferences of random effect logit model can take care of the above mentioned limitations. It was utilized to estimate part worth utility values taking into account the heterogeneity of consumers regarding their preferences for sweet peppers (Train and Sonnier, 2005; Train, 2009).
Fresh unpacked sweet pepper was chosen as study object as it is part of Taiwanese people’s daily diet (The Committee of Agricultural Extension, 2014; Taichung District Agricultural Research and Extension Station, 2016). Furthermore, sweet pepper is a suitable product because it is one of the few fresh agri-products permitted to be imported into Taiwan from mainland China. Thus, it is available on the Taiwanese domestic market in conventional and organic quality from the three countries considered in the study: Taiwan, China, and Japan. Besides COO and production methods, two additional characteristics were considered in the choice experiment: price and CRT information (shown in Table 1).
Table1.
Attribute and attribute levels used in DCE
Attributes Levels
Country of origin (COO) 1. Taiwan
2. Japan 3. China
Production methods 1. Organic
2. Conventional Chemical residue test (CRT)
information
1. CRT approved in the production country 2. CRT approved in Taiwan
3. No CRT
Price¶ 1. NT 65
2. NT 85 3. NT 105 4. NT 125
In July 2014, 1 US Dollar = 29.98 New Taiwanese (NT) Dollars 1 Taiwanese catty = 600 grams
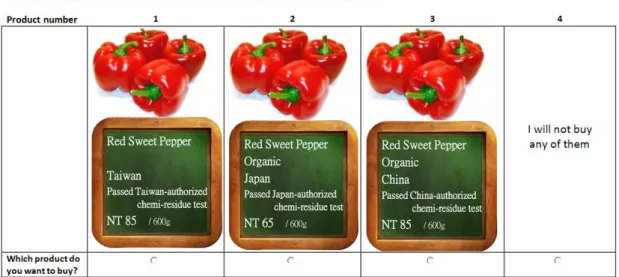
An optimal orthogonal design was used to generate 36 choice scenarios. This fractional factorial design technique is based on the consideration of maintaining the properties of orthogonality in alternatives’ attributes that are uncorrelated with one another among the choice sets in the whole experiment (Scarpa and Rose, 2008; Burgess and Street, 2005). Those were blocked into six groups with six choice situations, respectively. A choice task consisted of the option to buy one of three peppers that differed in the levels of the four product attributes (see Table 1). Participants could also decide to buy none of the three peppers (“opt-out” option) (see Figure 1a for the original and Figure 1b for the English version).
Figure 1a. A choice task example in DCE (original in Taiwanese)
Figure 1b. A choice task example in DCE (English translation)
Data was collected in April 2014 using a pre-tested self-administered online questionnaire addressing Taiwanese consumers. The survey was designed as a 15 minutes online questionnaire including a Discrete Choice Experiment (DCE) and questions to obtain information on respondents’ food consumption behavior and socio-demographics. Potential respondents were informed about the survey via author’s social media groups and e-mail (e.g. family members and alumni of author). Contacted persons were asked to circulate the link to the questionnaire (snow balling procedure) to increase the number of participants of the survey.
3
Results
A total of 814 people took part in the survey. Of these only respondents fulfilling the following three criteria were considered: being a Taiwanese citizen and inhabiting in Taiwan, being responsible for their household’s food shopping and consuming sweet peppers. Overall, 290 valid responses for data analysis were obtained.
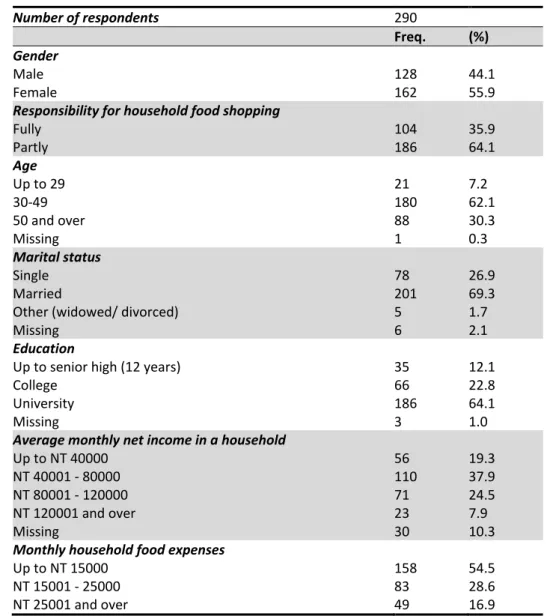
With regard to demographics women are slightly overrepresented (55.9%) in the sampl e and 35.9% of participants were fully responsible for their household food purchase. Compared to the Taiwanese population the sample is biased towards younger, better educated and wealthier inhabitants. Table 2 summarizes the structure of the sample.
For data analysis Sawtooth Software v.8 was used for estimating aggregate-level logit models as well as for the hierarchical Bayes estimation of random parameter logit models.
Table 2.
Sample structure
Number of respondents 290
Freq. (%)
Gender
Male 128 44.1
Female 162 55.9
Responsibility for household food shopping
Fully 104 35.9
Partly 186 64.1
Age
Up to 29 21 7.2
30-49 180 62.1
50 and over 88 30.3
Missing 1 0.3
Marital status
Single 78 26.9
Married 201 69.3
Other (widowed/ divorced) 5 1.7
Missing 6 2.1
Education
Up to senior high (12 years) 35 12.1
College 66 22.8
University 186 64.1
Missing 3 1.0
Average monthly net income in a household
Up to NT 40000 56 19.3
NT 40001 - 80000 110 37.9
NT 80001 - 120000 71 24.5
NT 120001 and over 23 7.9
Missing 30 10.3
Monthly household food expenses
Up to NT 15000 158 54.5
NT 15001 - 25000 83 28.6
Aggregate-level logit models
The empirical models developed in this study are based on the choice experimental structure as depicted in Table 1. The results for the aggregate-level logit models are illustrated in Table 3. Model 1 reveals the utility scores for the main effects with respect to the four attributes considered, while Models 2 and 3 consider the interaction effect between the attributes COO and production methods and between production methods and CRT, respectively. The interaction between CRT and COO was as well investigated but proved to be insignificant leading to a lower overall model fit . Thus, the results are not presented.
According to the results of model 1, all levels of the four considered attributes proved to be significant at the 5% level. The price coefficient is negative as expected. The coefficient of organic is positive, indi cating that respondents are willing to pay a premium for organically produced sweet peppers compared to conventional ones. The positive signs for Taiwan and Japan show that survey participants preferred sweet peppers from these countries compared to the COO China (negative main effect). Respondents also value products with CRT information (positive main effect).
Model 2 indicates that the relevance of the production methods increases relative to Model 1 and the utility derived from organic (conventional) production differ depending on the COO (see Table 3). It is negative (positive) for the COO Taiwan and positive (negative) for China, while there is no significant interaction effect between production methods and the COO Japan. Having a closer look at the results of the second model reveal that in the case of Taiwanese organic sweet peppers the two positive main effects for the COO Taiwan and the production method organic are corrected downward. The situation is different with respect to China. Consumers have the lowest preference for the COO China (negative main effect). In the case of organic products originating from China the interaction effect is positive. Thus, the production method organic can mitigate the negative evaluation of the COO China to some extent beyond the general positive effect organic production has. Comparing model 1 and model 2 reveals, however, that the inclusion of the interaction terms (model 2) leads only to a very slight increase (0.13%) in the percent certainty measure while there is no improvement in the root likelihood (RLH) as the goodness-of-fit measure.
Model 3 considers besides the main effects and the interactions between COO and production methods also the interaction between production methods and CRT (see Table 3). The results, confirm the findings of model 2 regarding the main effects as well as the interaction effect for COO and production methods, with the significance of the latter being higher in the case of COO Taiwan combined with production method.
The combination of the two attributes CRT approved and organic production both with a positive main effect can be assumed to be negative and thus adjusted downward as standards for organic production do not allow the use of chemical inputs. Indeed, Table 3 reveals a significant negative effect for the interaction between organic production and CRT in the production country while the effect for organic production and CRT in Taiwan is slightly positive, though not significant. Along the same lines we can assume that lack of CRT is less relevant in the case of organic products implying a positive interaction effect. Our results confirm this assumption. Furthermore, in the case of conventional products CRT testing gains in relevance. The interaction effect for conventional products and CRT testing in the production country is significant and as expected positive. However, the respective effect for conventional products and CRT testing in Taiwan proves to be insignificant and slightly negative. Finally, consumers evaluate conventional production on the one hand and No CRT on the other hand negative. Our results reveal that the combination of those two attribute levels further reinforces the negative evaluation of consumers.
Table 3.
Aggregate-level logit models
(N=290) Aggregate logit models
Discrete choice models Model 1 Model 2 Model 3
RLH 0.51 0.51 0.51
Null log-likelihood -2412.15 -2412.15 -2412.15
Restricted log-likelihood -1169.24 -1165.95 -1157.82
Percent Certainty 51.53 51.66 52.00
Bayesian Information Crit. 2405.64 2413.98 2412.64
Consistent Akaike Info Crit. 2414.64 2424.98 2425.64
Chi-Square 2485.82 2492.41 2508.67
Util. Sig. S.E. Util. Sig. S.E. Util. Sig. S.E.
COO
Taiwan 1.47 ** 0.06 1.50 ** 0.07 1.59 ** 0.07
Japan 0.58 ** 0.06 0.60 ** 0.07 0.59 ** 0.07
China -2.04 ** 0.10 -2.10 ** 0.12 -2.17 ** 0.12
Production method
Organic 0.15 ** 0.04 0.25 ** 0.06 0.28 ** 0.06
Conventional -0.15 ** 0.04 -0.25 ** 0.06 -0.28 ** 0.06
CRT information
CRT appr. in prod. country 0.23 ** 0.05 0.25 ** 0.05 0.27 ** 0.05
CRT approved in Taiwan 0.22 ** 0.05 0.22 ** 0.05 0.22 ** 0.05
No CRT -0.45 ** 0.05 -0.47 ** 0.05 -0.50 ** 0.05
Price
NT 65 1.05 ** 0.06 1.03 ** 0.06 0.98 ** 0.06
NT 85 0.38 ** 0.06 0.40 ** 0.06 0.49 ** 0.07
NT 105 -0.47 ** 0.07 -0.45 ** 0.07 -0.40 ** 0.07
NT 125 -0.97 ** 0.07 -0.98 ** 0.07 -1.07 ** 0.08
COO × Production methods
Taiwan × Organic -0.19 * 0.08 -0.23 ** 0.08
Taiwan × Conventional 0.19 * 0.08 0.23 ** 0.08
Japan × Organic -0.08 0.08 -0.08 0.08
Japan × Conventional 0.08 0.08 0.08 0.08
China × Organic 0.27 * 0.12 0.31 * 0.12
China × Conventional -0.27 * 0.12 -0.31 * 0.12
Production methods × CRT
Organic × CRT prod. country -0.28 ** 0.07
Organic × CRT Taiwan 0.07 0.07
Organic × No CRT 0.21 ** 0.07
Conv. × CRT prod. country 0.28 ** 0.07
Conv. × CRT Taiwan -0.07 0.07
Conv. × No CRT -0.21 ** 0.07
None -1.85 ** 0.17 -1.81 ** 0.18 -1.82 ** 0.18
*
Statistical significant level at 1%; **Statistical significant level at 5%;
Random effect logit models
The results of the random effect logit models for the whole sample (model 4 exclusively main effects; model 5 in addition to main effects the interaction term COO and production methods, and model 6 in addition to main effects the interaction terms of COO and production methods as well as production methods and CRT; see Table 4) confirm the findings of the aggregate-logit models regarding the relative relevance of the different attributes and the partworth utilities of the attribute levels. In model 4, respondents perceive COO as by far the most important attribute (attribute importance: 53. 99%), followed by price (29.84%), and CRT information (11.10%) while production methods (5.07%) prove to be of lower relevance in the purchase decision. The ranking remains the same in models 5 and 6 though the difference between CRT and production methods is considerable smaller in Model 5 compared to Models 4 and 6. The percent certainty and root likelihood (RLH) value for model 6 is slightly higher as for models 4 and 5 indicating a higher goodness of fit of the former compared to the latter two models.
Though the random parameter logit models 4 to 6 consider preference heterogeneity of consumers, they do not reveal the driving forces of heterogeneity. To explore the existence of different market segments we investigate preferences for different consumer groups based on socioeconomic characteristics. Separate random effect logit models were estimated for males (model 7) and females (model 8) and for four consumer groups depending on their income and education level (models 9 -12). Regarding the latter, consumer’s preference formation is investigated for the following four consumer segments: high income high education (model 9), high income lower education (model 10), lower income higher education (model 11) and lower income lower education group (model 12). High (lower) income is defined as a monthly income above (below or equal) to NT 80,000 in a household. High (lower) education is understood that respondents (don’t) have a university degree. The results of models 7 and 8 are summarized in Table 5, the ones for models 9 to 12 are reported in Table 6.
Male and female consumer reveal similar attribute importance for food price (male: 30.75%; female: 29.21%) and production methods (male: 5.01%; female: 5.30%). Considerable differences in preferences, however, exist with respect to the other two attributes. For male consumers CRT information is more important in their preference formation than for female consumers (male: 14.57%; female: 9.66%), whereas the opposite holds for the attribute production origin (male: 49.67%; female: 55.84%).
Table 4.
Random effect logit models
(N=290) Random effect logit model
Choice models Model 4 Model 5 Model 6
RLH (Model fit measure) 0.76 0.78 0.79
Percent certainty measure 0.80 0.82 0.83
Rk. Avg. Imprt.
S.D. Avg. Utl. S.D. Avg.
Imprt.
S.D. Avg. Utl. S.D. Avg. Imprt.
S.D. Avg. Utl. S.D.
COO 1 53.99 13.48 52.14 11.98 54.56 13.61
Taiwan 87.77 32.66 83.62 29.44 87.07 31.18
Japan 35.60 32.72 37.23 29.06 40.17 28.49
China -123.36 31.09 -120.85 27.53 -127.24 30.13
Price 2 29.84 14.24 -37.66 22.94 27.47 13.39 -34.65 21.46 28.35 14.30 -35.94 22.40
CRT information 3 11.10 6.42 10.69 5.88 11.52 5.87
CRT appr. in prod. country 13.22 10.32 13.04 9.38 14.15 9.48 CRT approved in Taiwan 12.40 11.43 12.06 10.34 12.77 10.74
No CRT -25.63 16.79 -25.11 15.24 -26.92 15.20
Production method 4 5.07 3.49 9.70 3.41 5.57 3.01
Organic 8.78 8.64 19.13 7.57 10.74 6.69
Conventional -8.78 8.64 -19.13 7.57 -10.74 6.69
COO × Production methods
Taiwan × Organic -12.74 8.35 -5.24 6.79
Taiwan × Conventional 12.74 8.35 5.24 6.79
Japan × Organic -10.17 9.76 1.76 4.81
Japan x Conventional 10.17 9.76 -1.76 4.81
China x Organic 22.91 10.89 3.48 7.97
Rk. Avg. Imprt.
S.D. Avg. Utl. S.D. Avg.
Imprt.
S.D. Avg. Utl. S.D. Avg. Imprt.
S.D. Avg. Utl. S.D. Production methods × CRT
Organic × CRT prod. country -16.24 9.32
Organic × CRT Taiwan 12.63 8.41
Organic × No CRT 3.61 10.97
Conv. × CRT prod. country 16.24 9.32
Conv. × CRT Taiwan -12.63 8.41
Conv. × No CRT -3.61 10.97
Table 5.
Random effect logit models (continued)
(N=290) Random effect logit models
Choice models Model 4
(Aggregate sample)
Model 7
(Male sample)
Model 8
(Female sample)
Sample size 290 128 162
RLH 0.76 0.75 0.78
Percent certainty 0.80 0.79 0.82
Rk. Avg.
Imprt.
Avg. Util. S.D. Avg.
Imprt.
Avg. Util. S.D. Avg.
Imprt.
Avg. Util. S.D.
COO 1 53.99 49.67 55.84
Taiwan 87.77 32.66 78.50 34.83 91.54 29.73
Japan 35.60 32.72 33.87 35.70 37.75 26.01
China -123.36 31.09 -112.37 36.86 -129.29 20.89
Price 2 29.84 -37.66 22.94 30.75 -38.62 25.39 29.21 -36.84 21.92
CRT information 3 11.10 14.57 9.66
CRT approved in production country 13.22 10.32 16.76 12.72 10.41 11.26
CRT approved in Taiwan 12.40 11.43 16.79 15.01 10.48 9.06
No CRT -25.63 16.79 -33.55 20.32 -20.90 12.43
Production method 4 5.07 5.01 5.30
Organic 8.78 8.64 7.03 10.37 9.01 10.14
Conventional -8.78 8.64 -7.03 10.37 -9.01 10.14
With respect to income and education level the following findings can be summarized. Respondents belonging into the high income, high education cluster perceive organic certified products as more important than all other consumer segments (see Table 6). At the same time our results reveal that the two lower education segments (models 10 and 12) attach a higher relevance to CRT information compared to those consumer segments with a university degree (15.91% in model 10 and 14.46% in model 12 compared to 11.16% in model 9 and 10.15% in model 11). Income seems the decisive characteristics for the overall importance assigned to COO as a comparison of the results of models 9 and 10 with models 11 and 12 reveals (relative importance 48.81% and 46.29% versus 55.25% and 55.36%, respectively). Though the overall importance consumers attach to the attribute COO appears to be primarily driven by income, the evaluations of different origins seems largely dependent on the education level; e.g. consumers with a university degree (models 9 and 11) evaluate the COO Japan much more favora ble than those without a university degree (models 10 and 12). Finally, price is according to our findings more important for the high income segments (32.38% in model 9 and 32.87% in model 10) compared to the low income groups (29.59% in model 11 and 25.42% in model 12).
Table 6.
Random effect logit models (continued)
(N=290) Random effect logit models
Choice models Model 9
(Higher net income + University degree)
Model 10
(Higher net income + No university degree)
Model 11
(Lower net income + University degree)
Model 12
(Lower net income + No university degree)
Sample size 67 26 103 62
RLH 0.77 0.71 0.76 0.81
Percent certainty 0.81 0.75 0.80 0.85
Rk. Avg.
Imprt.
Avg. Util. S.D. Avg.
Imprt.
Avg. Util.
S.D. Avg.
Imprt.
Avg. Util. S.D. Avg.
Imprt.
Avg. Util. S.D.
COO 1 48.81 46.29 55.25 55.36
Taiwan 78.47 29.44 85.16 42.61 83.32 24.67 102.32 36.53
Japan 36.58 24.47 7.17 18.79 47.92 28.59 15.71 29.62
China -115.06 29.52 -92.33 38.79 -131.24 28.10 -118.03 20.19
Price 2 32.38 -39.52 25.74 32.87 -42.67 23.02 29.59 -37.44 21.91 25.42 -30.60 26.85
CRT information 3 11.16 15.91 10.15 14.46
CRT appr. in prod. country 9.51 14.14 32.88 14.40 9.99 9.73 12.48 11.78
CRT appr. in Taiwan 12.57 15.24 -3.97 14.56 12.32 10.84 19.91 17.25
No CRT -22.07 18.64 -28.90 14.88 -22.31 13.94 -32.39 19.95
Production method 4 7.65 4.92 5.00 4.76
Organic 14.50 9.98 4.79 11.89 7.92 9.41 6.56 11.07
Conventional -14.50 9.98 -4.79 11.89 -7.92 9.41 -6.56 11.07
4
Discussion and Conclusion
The present study is the first to investigate the relevance of different product and process attributes for Taiwanese consumers purchase decision considering interaction effects between attributes and providing results for consumer segments differentiated by socio-economic criteria.
Our findings reveal respondents’ high preference for COO labeling which proves to be far more important than the product price. Becker et al. (2000), Schnettler et al. (2009) as well as Baker and Ballington (2011) arrive at similar results revealing in their studies that COO has a greater importance in consumers’ preference formation than price. COO seems to be the core cue for evaluating not just the origin of the food but also its quality and safety.
Compared to COO and price we find that the other two process attributes (CRT information, and organic labeling) investigated in our study provide a comparable little contribution to consumers’ utility. The latter result is similar to the findings of Magnusson et al. (2001). An explanation might be confusion of consumers in recognizing organic labels and understanding the organic farming concept (Yiridoe et al., 2005; Zakowska-Biemans, 2011; Tung et al., 2012). In consequence, they might be skeptical with respect to organic certified labels. In Taiwan organic production, though it is gaining in relevance, is still a very small niche market (Chen, 2007). Thus, many consumers might not be very familiar with those labels and the respective standard underlining the explanations provided above. CRT information proves to be of slightly greater relevance for consumers despite the fact that it is only occasionally displayed on products in Taiwan. However, though consumers might also not be that familiar with this label it directly refers to food safety and thus is at least easier to understand compared to information on organic versus conventional production.
The results of the study also point to the fact that their exist interdependencies between attribute levels (e.g. COO and production methods; production methods and CRT information) which need consideration to fully understand consumers’ preferences.
Finally, we detect heterogeneity between consumer groups in the importance of different product attributes as well as in the relevance of different attribute levels. Compared to men females attach a higher value to COO, a result confirming the finding of Hoffmann (2000). As previous studies we show that income (e.g. Tsakiridou et al., 2008; Curl et al., 2013; Pugliese et al. 2013) and education (e.g. Solomon et al., 2006; Denver and Jensen, 2014) affect consumers’ preferences with respect to various product and process attributes. More precisely, our result indicate that the higher educated and higher income consumer segment has a stronger preference for organic products compared to lower educated and lower income segments, a result which is in line with the finding of Dimitri and Dettmann (2012 ). For better educated and more wealthy consumers it is likely not only easier to obtain and understand the information regarding organic farming and organic certification, but they also have the economic means to buy those products and thus more experience with organic products. Nevertheless, even those consumers seem not to fully understand or trust the organic label as they, as all other consumer segments, value CRT information higher than organic production, though with the latter the former should actually not be necessary.
Furthermore, our study shows that consumers with higher education differentiate stronger between foreign origins: COO originating from Japan was considerably more favorably evaluated in these consumer segments than in the one with lower education. Better educated groups seem more capable to differentiate and are likely less ethnocentric compared to lower educated consumers (e.g. Anderson and Cunningham, 1972; Mittal and Tsiros, 1995; Insch and McBride, 2004; Sharma et al., 1995).
Our results also indicate that the higher income consumer segments attach a higher relative importance to price compared to the lower income groups, a result that seems to contradict the findings of previous studies (Ainslie and Rossi, 1998; Boatwright et al., 2004; Hsieh, 2012).
Despite heterogeneity between consumer groups we find for all consumer segments analyzed (models 7 to 12) that COO is by far the most important attribute, price takes second place, CRT third and production methods prove to be of lowest relevance.
With regard to recommendations our results suggest that firms that want to signal superior process quality should offer sweet peppers from Taiwan. Consumers with higher education will also appreciate sweet peppers originating from Japan. In addition, CRT information proves to be more important than organic production, though the latter is in fact the much broader concept. Further research is needed to better understand whether this result can be explained by consumers’ lack of knowledge regardi ng the
different labels or a lower level of trust in the organic label compared to CRT.* Retailers that intend to promote organic sweet peppers will be most successful in high educated high income neigh borhoods. Furthermore, the positive effect of organic is stronger for China compared to the other two COO and thus is able to slightly compensate the negative image of COO China. Finally, CRT (organic) certified is especially important for conventional (not CRT certified) products.
The findings of this study should be considered within the following limitations. First, our analysis focuses on one product, sweet pepper. Thus, our results hold for this product, though they might be transferable to other vegetables that are part of Taiwanese people’s daily diet. For a better understanding of the relevance of process attributes such as COO and production method on consumers’ purchase of e.g. animal products additional investigations are needed. Second, the results obtained in this study are not representative for the Taiwanese population but refer to the more educated and wealthy citizens as we relied on a convenience sample. However, as consumers’ consciousness for food safety and healthy diet have started to gain in relevance especially in this segment of the population and likely will spread to larger parts of the population in the future it can serve as an interesting initial insight into the relevance of key process characteristics for Taiwanese consumers purchase decision of fresh sweet pepper.
References
Anderson Jr., W. T.; Cunningham, W. H. (1972). The socially conscious consumer. The Journal of Marketing: 23
-31.
Ainslie, A.; Rossi, P. E. (1998). Similarities in choice behavior across product categories. Marketing Science, Vol.
17, No. 2: 91-106.
Baker, M. J.; Ballington, L. (2011). Country of origin as a source of competitive advantage. Journal of Strategic
Marketing, Vol. 10: 157-168.
Becker, T.; Benner, E.; and Glitsch, K. (2000). Consumer perception of fresh meat quality in Germany. British
Food Journal, Vol. 102, No. 3: 246-266.
Boatwright, P.; Dhar, S.; and Rossi, P. E. (2004). The role of retail competition, demographics and account retail strategy as drivers of promotional sensitivity. Quantitative Marketing and Economics, Vol. 2, No. 2: 169-190.
Burgess, L.; Street, D. J. (2005). Optimal designs for choice experiments with asymmetric attributes. Journal of
Statistical Planning and Inference, Vol. 134, No. 1: 288-301.
Carson, R. T.; Louviere, J. J.; Anderson, D. A.; Arabie, P.; Bunch, D. S.; Hensher, D. A.; Johnson, R. M.; Kuhfeld, W. F.; Steinberg, D.; Swait, J.; Timmermans, H.; and Wiley, J. B. (1994). Experimental analysis of choice.
Marketing Letters, Vol. 5, No. 4: 351-367.
Chen, M.-F. (2007). Consumer attitudes and purchase intentions in relation to organic foods in Taiwan: Moderating effects of food-related personality traits. Food Quality and Preference, Vol. 18, No. 7: 1008-1021.
Chen, M.-F. (2009). Attitude toward organic foods among Taiwanese as related to health consciousness, environmental attitudes, and the mediating effects of a healthy lifestyle. British Food Journal, Vol. 111, No. 2:165-178.
Chen, M.-F. (2012). Segmentation of Taiwanese consumers based on trust in the food supply system. British
Food Journal, Vol. 112, No. 1: 70-84.
Curl, C. L.; Beresford, S. A.; Hajat, A.; Kaufman, J. D.; Moore, K.; Nettleton, J. A.; and Diez-Roux, A. V. (2013). Associations of organic produce consumption with socioeconomic status and the local food environment: Multi-Ethnic Study of Atherosclerosis (MESA). PloS one, Vol. 8, No. 7: e69778.
Council of Agriculture (2007). Agriculture Production and Certification Act. Executive Yuan. http://law.coa.gov.tw/GLRSnewsout/EngLawContent.aspx?Type=E&id=104 (Last accessed 12th May 2015) Customs Administration. (2014). Trade Statistics Search. Customs Administration, Ministry of Finance.
http://www.customs.gov.tw/StatisticWeb/IESearch.aspx (Last accessed, 24th July 2014).
*
The lack of trust might be explained by the fact that also in organic products chemical residues have been found in the past (Wu and Wang, 2005; Wang and Liu, 2011; Lin and Chung, 2013).
Denver, S.; Jensen, J. D. (2014). Consumer preferences for organically and locally produced apples. Food Quality
and Preference, Vol. 31: 129-134.
Dettmann, R.; Dimitri, C. (2007). Who's buying organic vegetables? Demographic characteristics of US consumers, Journal of Food Distribution Research: 49‐62.
Dimitri, C.; Dettmann, R. L. (2012). Organic food consumers: what do we really know about them? British Food
Journal, 114(8): 1157-1183.
Greenpeace (2012). Banned pesticide policy and measures investigation in supermarkets.
http://www.greenpeace.org/taiwan/zh/publications/reports/food-agriculture/2013/supermarket-ranking/ (Last accessed 12nd April 2016)
Greenpeace (2016). Evaluation report: Pesticide evaluation for supermarkets and hypermarkets. http://www.greenpeace.org/taiwan/Global/taiwan/planet3/publications/reports/2016/2016-pesticide-evaluation.pdf (Last accessed 12nd April 2016)
Food and Drug Administration (2012). Food regulation for the country of origin labeling.
http://www.fda.gov.tw/TC/law.aspx?pn=2&cid=62&cchk=98582909-2745-4c4e-9469-cc93da057d65&subClassifyID=67 (last accessed 12nd April 2016)
Food and Drug Administration (2014). Country of origin labeling Q & A.
http://www.fda.gov.tw/upload/133/Content/2014040711512826781.pdf (Last accessed 12nd April 2016) Francks, P.; Boestel, J.; and Kim, C. H. (1999). Agriculture and Economic Development in East Asia: From growth
to protectionism in Japan, Korea and Taiwan. Routledge.
Krystallis, A.; Fotopoulos, C.; and Zotos, Y. (2006). Organic consumers' profile and their willingness to pay (WTP) for selected organic food products in Greece. Journal of International Consumer Marketing, Vol. 19, No. 1: 81-106.
Hoffmann, R. (2000). Country of origin-a consumer perception perspective of fresh meat. British Food Journal, Vol. 102, No. 3: 211-229.
Hsieh, S.-C. (2005). Organic farming for sustainable agriculture in Asia with special reference to Taiwan experience. Research Institute of Tropical Agriculture and International Cooperation, National Pingtung
University of Science and Technology, Taiwan.
http://www.agnet.org/htmlarea_file/library/20110801133519/eb558.pdf (Last accessed 13th June 2013). Hsu, L.-L.; Cheng, S.-H.; Cheng, S.-S.; Shyu, J.-F.; Su, S.-C.; Chou, S.-S.; and Chen, T.-H. (2006). Monitoring of
Pesticide Residues in Packed Vegetables and Fruit from Packing Field. Annual Scientific Report of National Laboratories of Foods and Drugs, Departiment of Health, Executive Yuan, Vol. 24: 290-300.
Hsieh, M. F. (2012). Store Format Choice. Doctoral dissertation, The university of wisconsin-madison. http://search.proquest.com/docview/1018542687 (Last accessed 12nd Feb. 2016)
Insch, G. S.; McBride, J. B. (2004). The impact of country-of-origin cues on consumer perceptions of product quality: A binational test of the decomposed country-of-origin construct. Journal of Business Research, Vol.
57, No. 3: 256-265.
Lancaster K. J. (1966). A new approach to consumer theory. Journal of Political Economy. Vol. 74, No. 2: 132-157.
Lin. Kuo-Cheng; Chung, H.-M. (2013). Taiwan organic store operation business model researches: An example
of C Co. Master Thesis. National Chiao Tung University.
https://ir.nctu.edu.tw/handle/11536/71393 (Last accessed 17th April 2016)
Lin, M. (2002). Fertilizer Use by Crop in Taiwan. Food and Agriculture Organization of the United Nations. Rome.
Liu, R.; Pieniak, Z.; Verbeke, W. (2013). Consumer’s attitude and behavior towards safe food in China: A review.
Food Control, Vol. 33: 93-104.
Liu, C.-J. (2013). The Impact of Market Orientation and Participation Behavior on Word-of-Mouth: Case of
Taiwanese Chain Supermarket. Master Thesis. Yu Da University, Taiwan.
http://ir.ydu.edu.tw/bitstream/310997200/10097/2/99100003.pdf (Last accessed 14th April 2016). Magnusson, M. K.; Arvola, A.; Koivisto Hursti, U. K.; Åberg, L.; and Sjödén, P. O. (2001). Attitudes towards
Mao, Y.-K.; Schive, C. (1995). Agricultural and industrial development in Taiwan. In Mellor, J. W. (Ed.), Agriculture on the Road to Industrialization:23-66. John Hopkins University Press.
McFadden, D. (1974). Conditional logit analysis of qualitative choice behavior. In Zarembka, P. (ed.), Frontiers in econometrics. New York: Academic Press: 105–142.
McFadden, D. (1986). The choice theory approach to market research. Marketing Science, 5(4): 275-297. Mittal, V., Tsiros, M. (1995). Does country of origin transfer between brands? Advances in Consumer Research,
Vol. 22 No. 1: 292‐6.
Pugliese, P.; Zanasi, C.; Atallah, O.; and Cosimo, R. (2013). Investigating the interaction between organic and local foods in the Mediterranean: The Lebanese organic consumer’s perspective. Food Policy, Vol. 39: 1-12. Rachlin, H. (1980). Economics and behavioral psychology. In Staddon, J.E.R. (Ed.). Limits to Action: The
Allocation of Individual Behavior. Academic Press, New York: 205–236.
Scarpa, R.; Rose, J. M. (2008). Design efficiency for non-market valuation with choice modeling: how to measure it, what to report and why. The Australian Journal of Agricultural and Resource Economics, Vol.
52: 253-283.
Sharma, S.; Shimp, T. A.; and Shin, J. (1995). Consumer ethnocentrism: A test of antecedents and moderators.
Journal of the Academy of Marketing Science, Vol. 23, No. 1: 26-37.
Schnettler, B.; Vidal, R.; Silva, R.; Vallejos, L.; Sepúlveda, N. (2009). Consumer willingness to pay for beef meat in a developing country: The effect of information regarding country of origin, price and animal handling prior to slaughter. Food Quality and Preference, Vol. 20, No. 2: 156-165.
Solomon, M.R., Bamossy, G.J., Askegaard, S. & Hogg, M. (2006). Consumer Behaviour: A European Perspective.
Prentice Hall Europe, New York.
Taichung District Agricultural Research and Extension Station (2016). Sweet peppers production and cultivation technology. Council of Agriculture Executive Yuan, Taiwan. http://www.tdais.gov.tw (Last accessed 4th April 2016).
The Committee of Agricultural Extension (2014). Sweet peppers and agricultural facilities. Review of
Agricultural Extension Science, Vol. 68. National Iland University.
Train, K. (2009). Discrete choice methods with simulation. 2nd Ed. Cambridge University Press.
Train, K.; Sonnier, G. (2005). Mixed logit with bounded distributions of correlated partworths. In: Alberini, A.; Scarpa, R. (Eds.) Applications of Simulation Methods in Environmental and Resource Economics. Springer: 117-134.
Tsakiridou, E.; Boutsouki, C.; Zotos, Y.; and Mattas, K. (2008). Attitudes and behaviour towards organic products: an exploratory study. International Journal of Retail & Distribution Management, Vol. 36, No.2: 158-175.
Tung, S.-J.; Shih, C.-C.; Wie, S.; and Chen, Y.-H. (2012). Attitudinal inconsistency toward organic food in relation to purchasing intention and behavior. British Food Journal, Vol. 114, No. 7: 997-1015.
Wu, P.-H.; Wang, C.-H. (2005). Organic Food, is it Ecological or Economical? An Analysis of Three Organized
Organic Consumer Fields. Master Thesis. National Chiao Tung University, Taiwan.
http://140.113.39.130/cgi-bin/gs32/tugsweb.cgi/ccd=fPrLn6/fulltextstdcdr?dbid=i%257FW_NJNGLIK&dbpathf=/opt/fb32/db/nctu/nc tucdrf/&fuid=01&dbna= (Last accessed 17th April 2016).
Wang, P.-C.; Liu, H.-H. (2011). A Study of the Relationship Quality, Consumption Situation, and the Customer Loyalty: Example of Farmer Markets. Master Thesis. National Kaohsiung University of Hospitality and Tourism.
http://ir.nkuht.edu.tw/bitstream/987654321/1019/1/U0018-0601201116581900.pdf (Last accessed 17th April 2016)
Yang, Y. T. (2013). The Development of Taiwan’s Healthy Agriculture Industry. Agricultural Biotechnology
Industry Quarterly, Vol. 32: 1-6.
Yang, C. M. (2014). From Organic Farming, Weed Management in Organic Farming to New Agricultural Value Chain: Another Opportunity for Agricultural Development in Taiwan. Crop, Environment and
Yiridoe, E. K.; Bonti-Ankomah, S.; and Martin, R. C. (2005). Comparison of consumer perceptions and preference toward organic versus conventionally produced foods: a review and update of the literature. Renewable Agriculture and Food Systems, Vol. 20, No. 4: 193-205.
Zakowska-Biemans, S. (2011). Polish consumer food choices and beliefs about organic food. British Food