Soil Classification Through Penetration Tests
A. H. Khan, A. Akbar, K. Farooq, N. M. Khan, M. Aziz and H. MujtabaDepartment of Civil Engineering, University of Engineering and Technology, Lahore, Pakistan. Email: [email protected]
Abstract
The Newcastle Dilatometer (NDMT) developed by Akbar in 2001 has a distinctive feature that it loads the soil with a rigid piston in place of flexible membrane as in the Marchetti Dilatometer (MDMT). Based on the previous research works carried out using the NDMT in normally consolidated soils, it has been found that the material and dilatometer indices from the NDMT data can be used to classify the soils based on Marchetti and Crapps (1981) chart. However, in overconsolidated soils, the Marchetti and Crapps (1981) chart for soil classification sometimes shows disagreement with other methods in the prediction of soil type based on the NDMT data. This is also true with the Cone Penetrometer (CPT) data. These findings are based on extensive testing carried out in alluvial soil deposits at Kala Shah Kaku campus of the University of Engineering and Technology, Lahore. These testing comprised particle size analysis in the laboratory in conjunction with the NDMT and CPT testing in the field. This paper presents the data of penetration tests along with laboratory soil classifications and explores the possible causes of disagreement in the prediction of true soil type based on penetration tests in overconsolidated soils.
Key Words
: Soil classification; cone penetration test; alluvial deposit; dilatometer test.1. Introduction
Ever since the appearance of the first in situ test, engineers and scientists have continuously endeavored to improve the equipment, the test protocol and the interpretation of data to obtain more representative values of soil profiling, in-situ strength, stiffness and horizontal stress. This has led to an improvement in the analyses required for the design of various geotechnical structures.
Like other engineering techniques used in the evaluation of geotechnical design parameters, intrusive in-situ testing does disturb the ground to some extent creating difficulties in interpreting tests to obtain intrinsic design parameters. This difficulty in the interpretation of test results is primarily due to the complex behaviour of soils, together with the lack of control and choice of the boundary conditions in any field test. Therefore the results of many in situ tests are interpreted using empirical correlations with results of laboratory tests.
One of such penetration devices is the MDMT
which is a simple and cost effective geotechnical investigation tool. Its testing procedure has been standardized as ASTM D 6635[1]. The MDMT is still in use as originally designed and all efforts (except the
NDMT) improve the data quality or interpretation at the cost of increase in complexity of device. Marchetti et al. (2001) suggests that the reliability of the MDMT
data interpretation in overconsolidated soils is uncertain [2].
The NDMT was developed and initially tested in the UK soils [3]. Later on, its in-situ testing & research was initiated in Pakistan [4, 5, 6, 7, 8]. The
NDMT research work can be seen in the following references [3, 9, 10, 11, 12, 13,14].
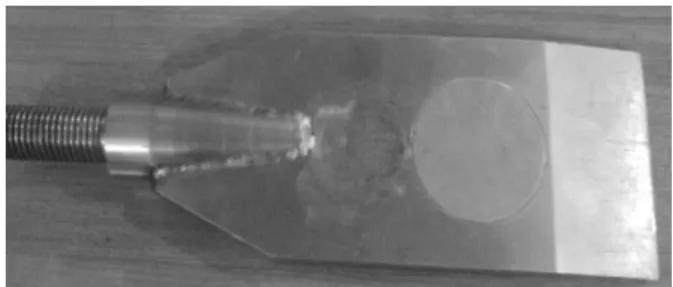
In the NDMT (Figure 1), a rigid piston is moved out to load the soil through N2 gas. The piston
movement is measured electronically by a magnet and Hall Effect transducer system. The gas pressure required in moving the piston is simultaneously recorded by a pressure transducer.
Figure 2 show a typical pressure-displacement curve obtained by constant rate of stress (CRS) method.
Figure 2: A typical NDMT pressure displacement
curve using CRS method
Further details about design and testing procedure can be seen in reference [3].
2. Basic Indices of Dilatometer
The NDMT indices (Table 1) are based on three pressures (pB, pE and p1.1) defined in Figure 2. The
MDMT corresponding indices are based on two pressures (p0 and p1) defined below.
Table 1: The NDMT & MDMT indices
Index NDMT [9] MDMT [15]
Material index (ID) (p1.1–pE) / (pE–u0) (p1 –p0 )/(p0 – u0)
Dilatometer modulus (ED)
42.8 (p1.1 – pB) 34.7 (p1 – p0)
Horizontal stress index (KD)
(pE – u0)/ σ΄v0 (p0 – u0 )/σ΄v0
where
p1 = The MDMT pressure corresponding to
1.1 mm expansion of membrane
p0 = The MDMT lift off pressure
p1.1 = The NDMT pressure corresponding to
1.1 mm displacement of rigid piston
pB = The NDMT lift off pressure
pE = The NDMT yield pressure
u0 = Static pore pressure
ID is a parameter that helps define a soil type, and
a reasonable soil description in normal soils. Marchetti in 1980 presented a soil classification system based on
ID values. The system is based on the concept that
slope of loading curve (p1.1-pE) is less in clays and
more in sands [2].
Marchetti (1980) found, from his testing experience in a variety of soils, that the material index 'ID' is a parameter, which is related to the prevailing
grain size of a soil, and is relatively independent of
OCR. It is also independent of the degree of saturation of a soil [16, 17, 18]. Table 2 is based on the mechanical behaviour of soils (or possibly rigidity index) and, therefore, sometimes, it can misdescribe silt as clay and vice versa. An admixture of sand and clay would generally be described as silt [2].
Table 2: Soil classification based on ID [19]
Soil type Material index, ID
Peat/sensitive clays < 0.10 Clay 0.10 0.35 Silty clay 0.35 0.60 Clayey silt 0.60 0.90 Silt 0.90 1.20 Sandy silt 1.20 1.80 Silty sand 1.80 3.30 Sand >3.30
Marchetti & Crapps (1981) expanded Table 2 to produce Figure 10 which, based on dilatometer modulus and material index, can provide an estimate of in-situ unit weight of soil as well [19]. Lacasse & Lunne (1988) further reinforced Figure 3 by including the effect of OCR on ID and ED [17].
NC sil ty san d
NC c lean san d Till
NC sil ts Crust
OC clays NC and aged clays
Peat organic clay ?
O
v
e
rb
u
rd
e
n
O
C
R
(20. 5) (19) (18) (17) (16)
CLAY SILT SAND
S
il
ty
S
il
ty
C
la
y
e
y
S
a
n
d
y
0.01 0.02 0.06 0.1 0.6 1 1.8 3.3 8.0 t (kN/m
3) (Marchetti and Crapps, 1981)
0.1 1 10 100 200
D
il
a
to
me
te
r
m
o
d
u
lu
s,
ED
(
M
P
a
)
NC
=
No
rm
a
lly
co
n
so
li
d
a
te
d
O
C
=
O
ve
rco
n
s
o
li
d
a
te
d
Material index, ID
D
e
n
s
it
y
O
C
R
3. Field and Laboratory Testing
In-situ testing was carried out at the Kala Shah Kaku (KSK) campus of the University of Engineering and Technology, Lahore, Pakistan. The in-situ testing comprised the NDMT and the electrical CPT [20] soundings. These tests were performed at 10 locations (labelled TP-1 to TP-10) up to a depth of 10 m. All the test locations were kept within 1.0 m distance. The disturbed soil samples were obtained through split spoon sampler at depth interval of 0.5 m from boreholes close to the test points, for actual soil classification in the laboratory. The undisturbed block samples were collected from the test pits (dug to 3.0 m depth close to the other test points) for laboratory oedometer tests [21]. The CPT soundings were taken at depth interval of 1 cm. The NDMT tests were performed at an interval of 20 cm [15]. The ground water table was encountered at a depth of 7.5 m at all the investigated points.
4. Results and Discussion
Based on results of particle size distribution and Atterberg limits, the soil samples have been classified according to ASTM D 2487. The soil descriptions are given in Table 3.
Figure 4: A generalized soil profile at the test site
Figure 4 shows a generalised soil profile at the site up to 10 m depth based on the actual soil classification tests.
The CPT tip resistance and friction ratio profiles are shown in Figure 5. The friction ratio (Rf) is
normally used for soil classification. There are more than 25 different independent CPT soil classification systems in use worldwide [22]. However, Robertson (1990) soil classification chart (Figure 6) has been
used in this analysis [23] and the soil descriptions are given in Table 3.
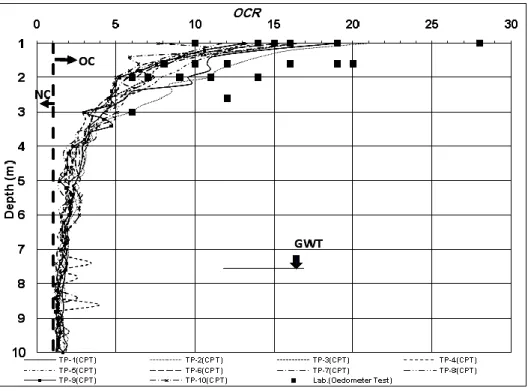
The CPT data has also been used to determine overconsolidation ratio (OCR) according to equation [24] given below:
OCR=[0.33(qc-σ΄vo)m(σatm/100)1-m ]/σ΄vo (1)
Where,
m = 0.65+1/(800 10-Ic +2.5)
Ic = [(3.47 – log Qt)
2
+ (log Fr + 1.22)
2
]0.5
Qt = (qc - σvo) / σ΄vo
Fr = Fs / (qc - σ΄vo) in %age
qc = The CPT cone tip resistance in kPa
σvo = Total overburden stress in kPa
σvo΄ = Effective overburden stress in kPa
σatm = Atmospheric stress = 100 kPa
Fs = The CPT cone sleeve friction in kPa
Profiles of OCR from the CPT data and those based on Oedometer tests are shown in Figure 7.
The typical trends of some of the NDMT pressure and displacement curves observed in various soils are shown in Figure 8. The profiles of ID are shown in
Figure 9. Soil descriptions based on Marchetti and Crapps (1981) chart [19] are given in Table 3. Figure 10 presents the ID and ED data plotted on Marchetti
and Crapps (1981) chart.
Based on the data from all sources, following discussion can be made:
The soil classification tests results indicate that the top 2.0 m to 3.0 m thick deposit comprises cohesive soils consisting of lean clay (CL) and silty clay (CL-ML) followed by non plastic sandy silt (ML), silty sand (SM) to poorly graded sand (SP/SP-SM). The liquid limit and plasticity index values for the cohesive soils vary between 24 & 34 and 3 & 12 respectively. The cohesive soils contain traces of cementation also and are nearly dry with natural moisture content varying between 0.25% and 2.08 %. The liquidity index of cohesive soils varies between -7.38 & -1.62 indicating highly overconsolidated soil deposit. The SM, SP/SP-SM soils are mainly passing sieve # 40 with variable amount of non plastic silt. The natural moisture content in these soils varies between 0.28% and 7.25 % up to the ground water table.
Figure 6:CPT soil behavior type chart [23]
Figure 8: The typical NDMT curves at the site
Figure 10: The NDMT based ID and ED plotted on Marchetti and Crapps (1981) chart OCR
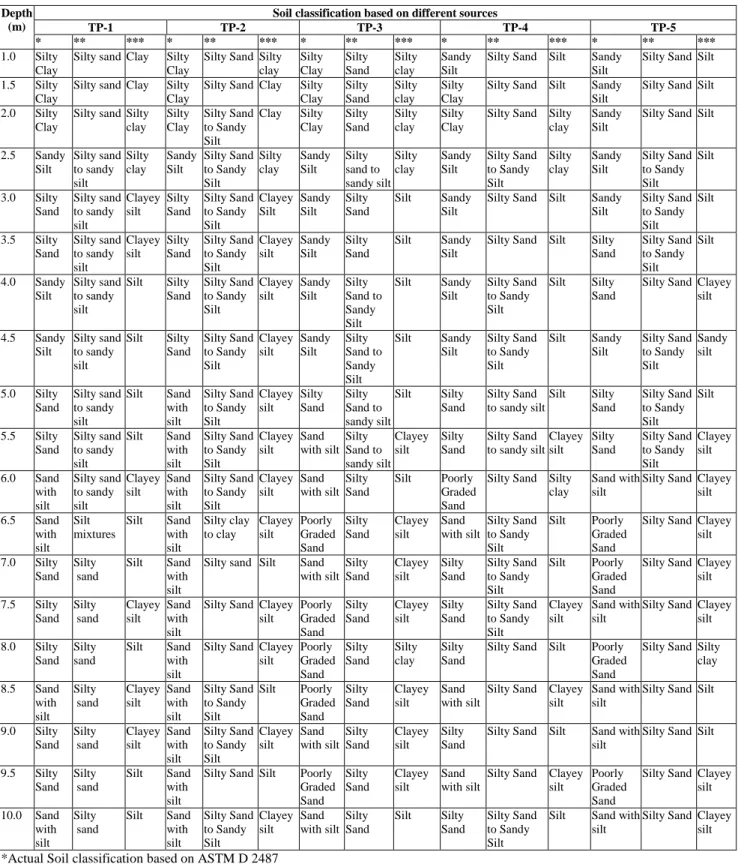
Table 3: A comparison of actual soil classification with the CPT and the NDMT (Sheet 1 of 2) Depth
(m)
Soil classification based on different sources
TP-1 TP-2 TP-3 TP-4 TP-5
* ** *** * ** *** * ** *** * ** *** * ** ***
1.0 Silty
Clay
Silty sand Clay Silty
Clay
Silty Sand Silty clay Silty Clay Silty Sand Silty clay Sandy Silt
Silty Sand Silt Sandy
Silt
Silty Sand Silt
1.5 Silty
Clay
Silty sand Clay Silty
Clay
Silty Sand Clay Silty
Clay Silty Sand Silty clay Silty Clay
Silty Sand Silt Sandy
Silt
Silty Sand Silt
2.0 Silty
Clay
Silty sand Silty clay Silty Clay Silty Sand to Sandy Silt
Clay Silty
Clay Silty Sand Silty clay Silty Clay
Silty Sand Silty clay
Sandy Silt
Silty Sand Silt
2.5 Sandy
Silt Silty sand to sandy silt Silty clay Sandy Silt Silty Sand to Sandy Silt Silty clay Sandy Silt Silty sand to sandy silt Silty clay Sandy Silt Silty Sand to Sandy Silt Silty clay Sandy Silt Silty Sand to Sandy Silt Silt
3.0 Silty
Sand Silty sand to sandy silt Clayey silt Silty Sand Silty Sand to Sandy Silt Clayey Silt Sandy Silt Silty Sand
Silt Sandy
Silt
Silty Sand Silt Sandy
Silt
Silty Sand to Sandy Silt
Silt
3.5 Silty
Sand Silty sand to sandy silt Clayey silt Silty Sand Silty Sand to Sandy Silt Clayey silt Sandy Silt Silty Sand
Silt Sandy
Silt
Silty Sand Silt Silty
Sand
Silty Sand to Sandy Silt
Silt
4.0 Sandy
Silt
Silty sand to sandy silt
Silt Silty
Sand Silty Sand to Sandy Silt Clayey silt Sandy Silt Silty Sand to Sandy Silt
Silt Sandy
Silt
Silty Sand to Sandy Silt
Silt Silty
Sand
Silty Sand Clayey silt
4.5 Sandy
Silt
Silty sand to sandy silt
Silt Silty
Sand Silty Sand to Sandy Silt Clayey silt Sandy Silt Silty Sand to Sandy Silt
Silt Sandy
Silt
Silty Sand to Sandy Silt
Silt Sandy
Silt Silty Sand to Sandy Silt Sandy silt
5.0 Silty
Sand
Silty sand to sandy silt
Silt Sand
with silt Silty Sand to Sandy Silt Clayey silt Silty Sand Silty Sand to sandy silt
Silt Silty
Sand
Silty Sand to sandy silt
Silt Silty
Sand
Silty Sand to Sandy Silt
Silt
5.5 Silty
Sand
Silty sand to sandy silt
Silt Sand
with silt Silty Sand to Sandy Silt Clayey silt Sand with silt Silty Sand to sandy silt Clayey silt Silty Sand Silty Sand to sandy silt
Clayey silt Silty Sand Silty Sand to Sandy Silt Clayey silt
6.0 Sand
with silt Silty sand to sandy silt Clayey silt Sand with silt Silty Sand to Sandy Silt Clayey silt Sand with silt Silty Sand
Silt Poorly
Graded Sand
Silty Sand Silty clay
Sand with silt
Silty Sand Clayey silt
6.5 Sand
with silt
Silt mixtures
Silt Sand
with silt Silty clay to clay Clayey silt Poorly Graded Sand Silty Sand Clayey silt Sand with silt Silty Sand to Sandy Silt
Silt Poorly
Graded Sand
Silty Sand Clayey silt
7.0 Silty
Sand Silty sand
Silt Sand
with silt
Silty sand Silt Sand
with silt Silty Sand Clayey silt Silty Sand Silty Sand to Sandy Silt
Silt Poorly
Graded Sand
Silty Sand Clayey silt
7.5 Silty
Sand Silty sand Clayey silt Sand with silt
Silty Sand Clayey silt Poorly Graded Sand Silty Sand Clayey silt Silty Sand Silty Sand to Sandy Silt Clayey silt Sand with silt
Silty Sand Clayey silt
8.0 Silty
Sand Silty sand
Silt Sand
with silt
Silty Sand Clayey silt Poorly Graded Sand Silty Sand Silty clay Silty Sand
Silty Sand Silt Poorly
Graded Sand
Silty Sand Silty clay
8.5 Sand
with silt Silty sand Clayey silt Sand with silt Silty Sand to Sandy Silt
Silt Poorly
Graded Sand Silty Sand Clayey silt Sand with silt
Silty Sand Clayey silt
Sand with silt
Silty Sand Silt
9.0 Silty
Sand Silty sand Clayey silt Sand with silt Silty Sand to Sandy Silt Clayey silt Sand with silt Silty Sand Clayey silt Silty Sand
Silty Sand Silt Sand with
silt
Silty Sand Silt
9.5 Silty
Sand Silty sand
Silt Sand
with silt
Silty Sand Silt Poorly
Graded Sand Silty Sand Clayey silt Sand with silt
Silty Sand Clayey silt
Poorly Graded Sand
Silty Sand Clayey silt 10.0 Sand
with silt
Silty sand
Silt Sand
with silt Silty Sand to Sandy Silt Clayey silt Sand with silt Silty Sand
Silt Silty
Sand
Silty Sand to Sandy Silt
Silt Sand with
silt
Silty Sand Clayey silt
*Actual Soil classification based on ASTM D 2487 **Soil classification based on the CPT [23] ***Soil classification based on the NDMT [19]
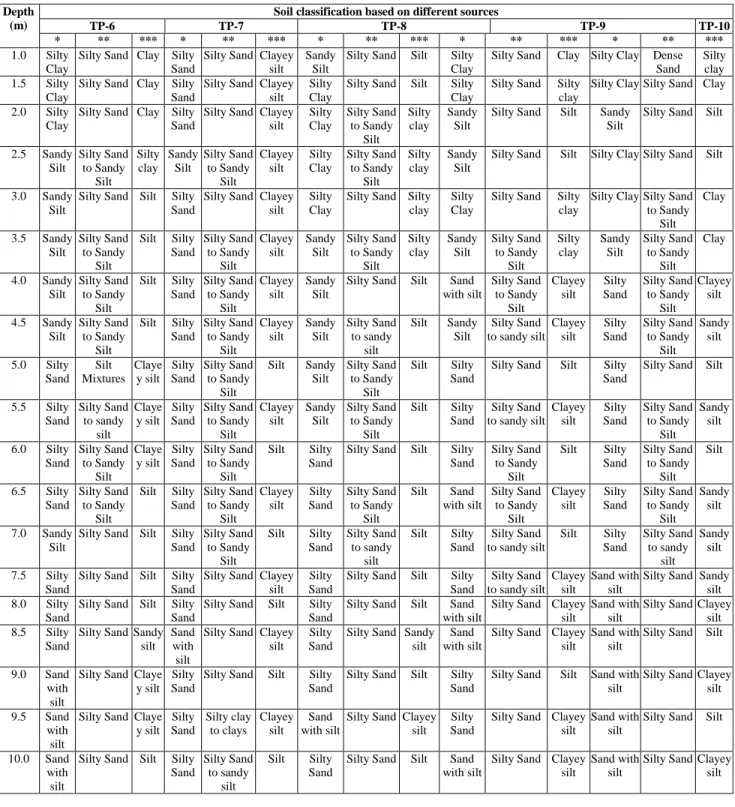
Table 3: A comparison of actual soil classification with the CPT and the NDMT (Sheet 2 of 2) Depth
(m)
Soil classification based on different sources
TP-6 TP-7 TP-8 TP-9 TP-10
* ** *** * ** *** * ** *** * ** *** * ** ***
1.0 Silty
Clay
Silty Sand Clay Silty Sand
Silty Sand Clayey silt
Sandy Silt
Silty Sand Silt Silty
Clay
Silty Sand Clay Silty Clay Dense
Sand Silty clay
1.5 Silty
Clay
Silty Sand Clay Silty Sand
Silty Sand Clayey silt
Silty Clay
Silty Sand Silt Silty
Clay
Silty Sand Silty
clay
Silty Clay Silty Sand Clay
2.0 Silty
Clay
Silty Sand Clay Silty Sand
Silty Sand Clayey silt Silty Clay Silty Sand to Sandy Silt Silty clay Sandy Silt
Silty Sand Silt Sandy
Silt
Silty Sand Silt
2.5 Sandy
Silt Silty Sand to Sandy Silt Silty clay Sandy Silt Silty Sand to Sandy Silt Clayey silt Silty Clay Silty Sand to Sandy Silt Silty clay Sandy Silt
Silty Sand Silt Silty Clay Silty Sand Silt
3.0 Sandy
Silt
Silty Sand Silt Silty
Sand
Silty Sand Clayey silt
Silty Clay
Silty Sand Silty clay
Silty Clay
Silty Sand Silty
clay
Silty Clay Silty Sand to Sandy
Silt Clay
3.5 Sandy
Silt
Silty Sand to Sandy
Silt
Silt Silty
Sand Silty Sand to Sandy Silt Clayey silt Sandy Silt Silty Sand to Sandy Silt Silty clay Sandy Silt Silty Sand to Sandy Silt Silty clay Sandy Silt Silty Sand to Sandy Silt Clay
4.0 Sandy
Silt
Silty Sand to Sandy
Silt
Silt Silty
Sand Silty Sand to Sandy Silt Clayey silt Sandy Silt
Silty Sand Silt Sand
with silt Silty Sand to Sandy Silt Clayey silt Silty Sand Silty Sand to Sandy Silt Clayey silt
4.5 Sandy
Silt
Silty Sand to Sandy
Silt
Silt Silty
Sand Silty Sand to Sandy Silt Clayey silt Sandy Silt Silty Sand to sandy silt
Silt Sandy
Silt
Silty Sand to sandy silt
Clayey silt Silty Sand Silty Sand to Sandy Silt Sandy silt
5.0 Silty
Sand Silt Mixtures Claye y silt Silty Sand Silty Sand to Sandy Silt
Silt Sandy
Silt
Silty Sand to Sandy
Silt
Silt Silty
Sand
Silty Sand Silt Silty
Sand
Silty Sand Silt
5.5 Silty
Sand Silty Sand to sandy silt Claye y silt Silty Sand Silty Sand to Sandy Silt Clayey silt Sandy Silt Silty Sand to Sandy Silt
Silt Silty
Sand
Silty Sand to sandy silt
Clayey silt Silty Sand Silty Sand to Sandy Silt Sandy silt
6.0 Silty
Sand Silty Sand to Sandy Silt Claye y silt Silty Sand Silty Sand to Sandy Silt
Silt Silty
Sand
Silty Sand Silt Silty
Sand
Silty Sand to Sandy
Silt
Silt Silty
Sand
Silty Sand to Sandy
Silt Silt
6.5 Silty
Sand
Silty Sand to Sandy
Silt
Silt Silty
Sand Silty Sand to Sandy Silt Clayey silt Silty Sand Silty Sand to Sandy Silt
Silt Sand
with silt Silty Sand to Sandy Silt Clayey silt Silty Sand Silty Sand to Sandy Silt Sandy silt
7.0 Sandy
Silt
Silty Sand Silt Silty
Sand
Silty Sand to Sandy
Silt
Silt Silty
Sand
Silty Sand to sandy
silt
Silt Silty
Sand
Silty Sand to sandy silt
Silt Silty
Sand Silty Sand to sandy silt Sandy silt
7.5 Silty
Sand
Silty Sand Silt Silty
Sand
Silty Sand Clayey silt
Silty Sand
Silty Sand Silt Silty
Sand
Silty Sand to sandy silt
Clayey silt
Sand with silt
Silty Sand Sandy silt
8.0 Silty
Sand
Silty Sand Silt Silty
Sand
Silty Sand Silt Silty
Sand
Silty Sand Silt Sand
with silt
Silty Sand Clayey silt
Sand with silt
Silty Sand Clayey silt
8.5 Silty
Sand
Silty Sand Sandy silt
Sand with silt
Silty Sand Clayey silt
Silty Sand
Silty Sand Sandy silt
Sand with silt
Silty Sand Clayey silt
Sand with silt
Silty Sand Silt
9.0 Sand
with silt
Silty Sand Claye y silt
Silty Sand
Silty Sand Silt Silty
Sand
Silty Sand Silt Silty
Sand
Silty Sand Silt Sand with
silt
Silty Sand Clayey silt
9.5 Sand
with silt
Silty Sand Claye y silt Silty Sand Silty clay to clays Clayey silt Sand with silt
Silty Sand Clayey silt
Silty Sand
Silty Sand Clayey silt
Sand with silt
Silty Sand Silt
10.0 Sand
with silt
Silty Sand Silt Silty
Sand
Silty Sand to sandy
silt
Silt Silty
Sand
Silty Sand Silt Sand
with silt
Silty Sand Clayey silt
Sand with silt
Silty Sand Clayey silt
*Actual Soil classification based on ASTM D 2487 **Soil classification based on the CPT [23] ***Soil classification based on the NDMT [19]
The OCR values from the Oedometer and the
CPT are about 20% near the surface and decrease with depth. The high values near the surface are probably due to desiccation effects. However, the values remain more than 1.0 up to 10.0 m depth indicating that the deposit to 10 m depth as overconsolidated.
The soil classification based on the CPT data indicates the soil deposit comprising silty sand to sandy silt from the ground surface to 10.0 m depth.
The soil classification based on the NDMT data and using Marchetti and Crapps (1981) chart shows soil deposit up to about 3.0 m depth comprising mainly clay and silty clay. From about 3.0 m down to 10.0 m depth, the soil deposit is categorised as silt and clayey silt with sandy silt at places.
A comparison of soil classification by different sources is presented in Table 3. It can be observed that the NDMT based classification compare well with actual in the top cohesive layer of about 3.0 m thickness. From 3.0 m down to 10.0 m depth, the NDMT data describe the silty sand and sand as silt or clayey silt due to lesser values of ID. In overconsolidated soils, the
ID values decrease. As a result the data points on
the Marchetti and Crapps (1981) chart are shifted towards left resulting in disagreement with the actual soil type. The possible reason for this disagreement is that all these soils (silty sand, sand, silt and clayey silt) have very narrow range of particle size distribution and the NDMT
loading is unable to distinguish between them. Another reason for lesser values of ID is the
increase in yield pressure values which could be due to overconsolidated condition of the deposit. The disagreement of the CPT based classification with the actual is more pronounced in the top 2.0 to 3.0 m (CL and CL-ML layers) which is highly overconsolidated. Below this depth, classification from the CPT data compare reasonably well with the actual.
The dissimilarity in the prediction of soil type from the NDMT or the CPT is probably not due to the limitation in the in-situ testing instruments or soil classification methodology. It indicates the mechanical response of soil which is the function of OCR and natural moisture content.
5. Conclusions
The actual soil classification has been compared with that from the CPT and the NDMT data. The following conclusions have been drawn from the comparison:
1. The mechanical response of soils during penetration tests is function of OCR and natural moisture content. It also depends on whether soil is containing any cementation or not.
2. The NDMT is unable to differentiate between fine sands and silt. Fine sands are usually mis-described as silts based on Marchetti classification system.
3. When soils are highly overconsolidated and dry, the CPT data interpretation may describe clays as silty sand to sandy silt.
4. The comparison between various soil classification methods presented in this paper is based on soil samples at the same level but from different locations. These locations, though kept close to each other, do not guarantee of exactly similar soils. A comparison of actual soil classification from different locations indicates horizontal as well as vertical variation of soil types.
References
[1] ASTM D 6635; Standard Test Method for Performing the Flat Plate Dilatometer Test
(2003).
[2] S. Marchetti, P. Monaca, G. Totani, and M. Calabrese; The Flat Dilatometer Test (DMT) in Soil Investigation, Report of the ISSMGE TC-16 on Ground Property Characterization from In-situ Testing(2001).
[3] A. Akbar; Development of Low Cost In-Situ Testing Devices, PhD Thesis, University of Newcastle Upon Tyne, UK(2001).
[4] M. Arshad; Development of Correlations among Various Site Characterization Methods, M. Engg. Thesis, UET, Lahore, Pakistan (2008). [5] M. Aziz; Calibration of Newcastle Dilatometer
in Cohesive Soils, M. Engg. Thesis, UET, Lahore, Pakistan (2006).
[6] A. Bashir; Compressibility Characteristics of Southern Lahore Alluvium Using Newcastle
Dilatometer, M. Engg. Thesis, UET, Lahore, Pakistan (2005).
[7] S. Kibria; Evaluation of In-situ Characteristics of Southern Lahore Alluvium using Newcastle Dilatometer”, M. Engg. Thesis, UET, Lahore,
Pakistan (2004).
[8] H. Nawaz; Analysis of Newcastle Dilatometer Testing Data for Jaranwala Sandy Subsoils”, M.
Engg. Thesis, UET, Lahore, Pakistan (2005). [9] A. Akbar and B. G. Clarke; A Flat Dilatometer to
Operate in Glacial Tills, ASTM-Geotechnical Testing Journal, (2001) 24(1): 51-60.
[10] A. Akbar and B. G. Clarke; In-Situ Pore Pressure Measurement Using Newcastle Research Dilatometer.” Research Journal UET,
Lahore, Pakistan (2002) Volume - 13: 133-151. [11] A. Akbar, S. Kibria and B. G. Clarke; The
Newcastle Dilatometer Testing in Lahore Cohesive Soils, 16th ICSMGE International Conference, Osaka, Japan (2005).
[12] A. Akbar, H. Nawaz, and B. G. Clarke; The Newcastle Dilatometer Testing in Pakistani Sandy Subsoils, 2nd International Conference on the Flat Dilatometer, April 2-5, 2006, Washington, D.C, USA (2006).
[13] A. Akbar, M. Aziz, K. Farooq and B. G. Clarke;
Characterisation of a Cohesive Soil Test Bed Using Akbar Newcastle Dilatometer, 13th Asian Regional Conference on Soil Mechanics & Geotechnical Engineering, Kolkata, India (2007). [14] A. Akbar, M. Arshad and B. G. Clarke; Site
Characterisation using CPT, DMT, SPT and Laboratory Testing Results, 3rd International Conference on Site Characterization, April 1-4, 2008, Taipei, Taiwan (2008).
[15] S. Marchetti; In Situ Tests by Flat Dilatometer,
Journal of Geotechnical Engineering – ASCE (1980) Vol. 106, No. GT 3, pp 299-321.
[16] A. J. Lutenegger; Current Status of the Marchetti Dilatometer Test, Proceedings of 1st International Symposium on Penetration Testing, ISOPT-1, Florida, USA (1988) Vol.1, pp 137-155.
[17] S. Lacasse and T. Lunne; Calibration of Dilatometer Correlations, Proceedings of the 1st International Symposium on Penetration Testing, ISOPT-1, Florida USA (1988) Vol. 1, pp 539-548.
[18] J. H. Schmertmann; A Method for Determining the Friction Angle in Sands from the Marchetti Dilatometer Tests, Proc. 2nd European Symposium on Penetration Testing, ESOPT-II, Amsterdam, Holland (1982) Vol. 2, pp. 853-861. [19] S. Marchetti and D. K. Crapps; Flat Dilatometer
Manual, GPE Inc., USA (1981).
[20] ASTM D 5778; Standard Test Method for Performing Cone Penetration Test in Soils
(1995).
[21] ASTM D 2435; Standard Test Methods for One Dimensional Consolidation Properties of Soils using Incremental Loading (2004).
[22] P. W. Mayne; Cone Penetration Test – State of Practice, NCHRP Synthesis, Transportation Research Board, Washington DC, USA (2007). [23] P. K. Robertson; Soil classification using the
cone penetration test, Canadian Geotechnical Journal (1990), 27 (1), 151-8.