M.R. Soltani
a;, A. Daliri
aand J. Sepahi Younsi
ba. Department of Aerospace Engineering, Sharif University of Technology, Tehran, P.O. Box 1458889694, Iran. b. Faculty of Mechanical & Aerospace Engineering, Ferdowsi University of Mashhad, Mashhad, Iran.
Received 24 January 2015; received in revised form 8 May 2015; accepted 26 October 2015
KEYWORDS Supersonic inlet; Shock
wave/Boundary-Layer Interaction (SBLI); Pseudo-shock; Shock train; Buzz.
Abstract. Experiments were conducted to study various kinds of Shock wave/Boundary Layer Interaction (SBLI) in an axisymmetric mixed-compression inlet. Experimental ndings were compared and veried by numerical solutions where possible. Dierent types of SBLI relevant to the mixed-compression inlets are classied. Interactions of normal shock wave/boundary-layer at subcritical condition and in buzz condition are investigated using Schlieren and shadowgraph ow visualization as well as unsteady pressure recordings. The data is compared with the CFD predictions. Interactions of cowl lip reected oblique shock and the terminal normal shock with the spike boundary-layer at both critical and supercritical operations, which lead to pseudo-shock phenomena, are also studied. Experimental pressure recordings are used for validation and discussion. For near-critical throttling values, interaction of internal compression oblique shocks with boundary-layer and pseudo-shock phenomenon is dominant. Formation of lambda shock due to interaction of separated boundary-layer with normal shock wave is investigated. Each type of ow interaction phenomena has dierent eects on the stability and performance of the inlet. Interaction of terminal normal shock with internal duct boundary-layer causes pseudo-shock phenomenon that increases ow distortion and reduces total pressure recovery. Interaction of normal shock with cone boundary-layer causes buzz instability and degrades inlet performance.
© 2016 Sharif University of Technology. All rights reserved.
1. Introduction
For supersonic vehicles, the inlet must decelerate the incoming ow to subsonic speeds before delivering it to the combustion chamber. The compression could be done by a normal shock or by a series of oblique shocks. The latter case produces lower entropy changes and is frequently used. Depending on whether the oblique shock waves are generated inside or outside the inlet duct, such designs are referred to as internal and external compression inlets, respectively. Both external and internal types of compression are also used
*. Corresponding author.
E-mail address: [email protected] (M.R. Soltani)
in appropriate degrees to reduce their deciencies in an-other design known as mixed compression. In all cases, interaction of shock wave with inlet surface boundary-layer is inevitable. Oblique shock waves interact with boundary-layer and cause adverse pressure gradient that makes the boundary-layer ready for separation. A nal near-normal shock wave (or an oblique shock wave of strong-shock solution) turns the ow from supersonic to subsonic through a strong transonic SBLI and will usually separate the ow. Flow separation greatly impacts the inlet performance by means of reducing the total pressure recovery and by adding ow distortion. As the ow is typically separated at the entrance of subsonic diuser, it becomes non-uniform at the engine face [1]. This ow distortion
disturbs inlet performance and harms the engine. The terminal normal shock can be expelled out of the inlet duct by reducing the inlet mass ow ratio (at subcritical operating condition); however, the progress will result in the shock interaction with the boundary-layer of the external compression surface that will lead to sudden high-amplitude ow oscillations called buzz. In addition to degrading the inlet performance, buzz can lead to trust loss, engine surge, or even aircraft structural damages [2].
Numerous studies have been carried out on su-personic inlet performance and stability since 1940. Much information could be found in the literature on dierent aspects of various types of supersonic inlet models [3-14]. Performance characteristics of inlet in cases of extensive maneuvering range [3,4], unstart [5], buzz phenomenon, and application of boundary-layer bleed [6-14] have recently been investigated. In addition to these experiments, many computational studies have been accomplished on the supersonic inlet ow and buzz phenomenon as well as ow control methods [15-19].
Shock wave boundary-layer interaction as a fun-damental gas dynamics phenomenon can be found in many practical aerospace related problems ranging from transonic aircraft wings to hypersonic vehicles and engines. A comprehensive survey of the interac-tion of shock wave and turbulent boundary layer was published by Viswanath in 1988 [20]. In his paper, an overview of some developments in understanding, prediction, and control of two-dimensional SBLI at high speeds was presented. A general review of dierent aspects of SBLI along the wall surface of internal compressible ows was presented by Matsuo et al. [21]. In this study, the fundamental feature of shock train and pseudo-shock, several prediction methods, and control methods of pseudo-shock were described. Also, understandings related to self-excited oscillations of pseudo-shock were reviewed. A summary of the Computational Fluid Dynamics (CFD) simu-lations of SBLI was also presented in a review paper and methods of DNS, LES, and RANS were compared with experiments and the capabilities and limitations of each turbulent model were described [22]. Also, application of LES method for simulation of shock wave interactions in nozzles was performed [23,24]. Recently, comprehensive study on the advances of SBLI with emphasis on ow unsteadiness, heat transfer predic-tion, multi-shock boundary-layer interacpredic-tion, and ow control techniques has been performed [25]. Other recent studies have been carried out on unsteadiness of SBLI [26,27] and control methods such as bleed, vortex generator, and micro actuators [28-30]. Also, some recent experiments and theoretical eorts have been made to investigate the eect of ow control methods such as bleed on SBLI for supersonic and hypersonic
inlets [31-35]. The main idea of these notable papers is to discuss the most general aspects of shock wave boundary-layer interactions relevant to supersonic air inlets.
Studying the physics of complicated ow cor-responding to SBLI in order to employ the results for designing inlets and related ow control devices is useful. Although several studies have been per-formed on SBLI and its control means, some of the complicated aspects of SBLI are not discovered yet and it is needed to perform more experiments and simulations to perceive the physics of ow interactions. On the other hand, generalization and application of the fundamental SBLI ows for practical ow devices such as inlets are very useful and could hardly be founded in the literature. Along with classication of SBLI ows relevant to mixed-compression inlets, this paper aims to present a novel analysis to relate SBLI phenomena to inlet performance and stability through evaluation of experimental and numerical evi-dences.
2. Experimental setup 2.1. Wind tunnel
The experiments are conducted in a continuous suction-type wind tunnel with a rectangular test sec-tion of 60 60 cm2. The tunnel is equipped with
a exible nozzle that can be adjusted during the tests. The turbulence intensity of the ow in the test section ranges from 0.4% to 1.4%, depending on the free-stream Mach number [12]. There exist porous bleed holes on the upper and lower walls of the test section which can stabilize and control wind tunnel shock and other reected waves. Side wall windows of the test section have been made up of optical glasses which allow the ow and shock pattern observation by means of Schlieren and shadowgraph ow visualization systems. The tunnel is indraft; thus, total pressure and total temperature in the test section are constant and atmospheric.
2.2. Model
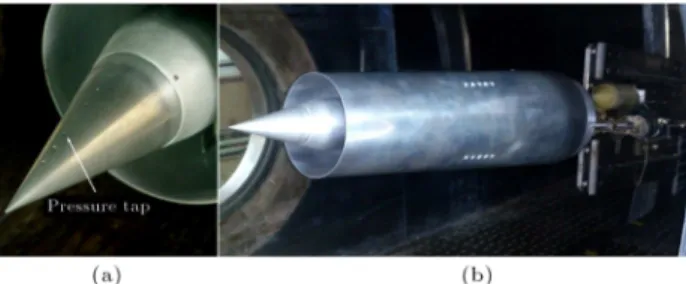
Figure 1(a) shows the inlet model used in the ex-periments. It is an axisymmetric mixed-compression
Figure 1. (a) Inlet model in wind tunnel. (b) Tip cone and pressure taps.
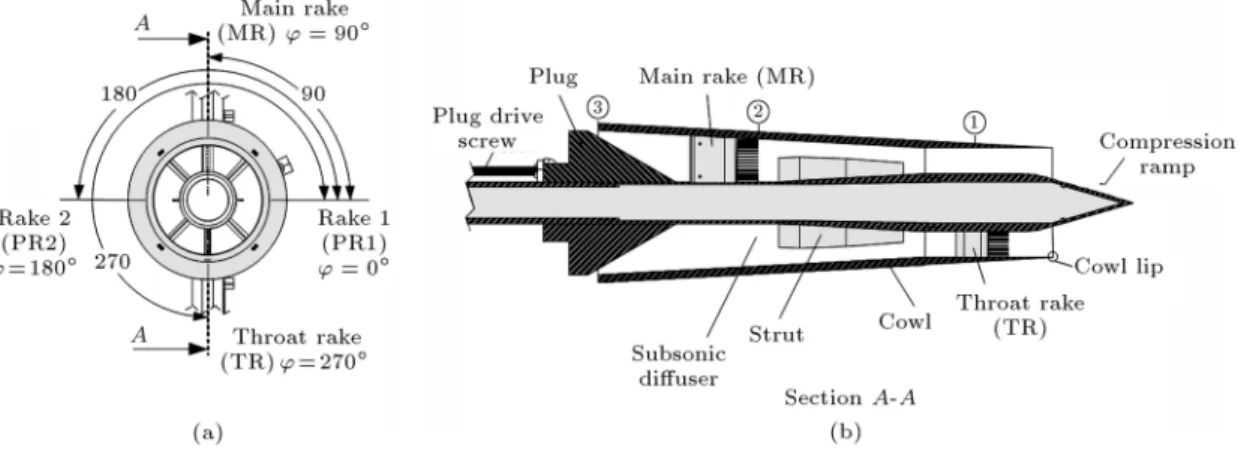
Figure 2. Schematic of the intake model and its instruments. Table 1. Measurement inaccuracies (%).
M1=M1 P01=P1 Re=Re P=P "=" =
1.458 0.012 1.982 0.929, 1.421 2.418 1.421
inlet with design Mach number of 2.0 and L=d = 3:4. Bleed could be added or removed by replacing tip cones (Figure 1(b)). However, in this study, no bleed is applied. A conical plug is located at the end of the model to change the exit area of the inlet during the tests. The plug translates along the intake centerbody via a DC motor and a ball screw (Figure 2(b)). The inlet mass ow rate and back pressure ratio are controlled through changing the exit area. Note that the back pressure determines the normal shock position and consequently design and o-design conditions of the intake can be obtained.
2.3. Pressure transducers and test procedure Sixty two sensitive pressure transducers have been used to measure static and total pressures on the model and wind tunnel walls. Several pressure taps have been located on dierent positions of the spike surface to measure the static pressure distribution. Two multi-probe rakes, TR (Throat Rake) and MR (Main Rake) as shown schematically in Figure 2, have been located at the throat (x=d = 0:8 and = 270) and at the exit (x=d = 2:4 and = 90)
sections of the intake with blockage ratios of 2% and 4.3%, respectively. Rake TR has 12 probes and is used to measure the boundary-layer prole and ow behavior at the throat section. Rake MR has 17 probes and is used to measure the boundary-layer prole, inlet total pressure recovery, mass ow rate, and ow distortion at the exit face of the model. Two single-probe rakes (PR1 and PR2) are also located at x=d = 1:4 = 0 and at x=d = 1:8 =
180, respectively, for total pressure losses
measure-ment. All sensors have accuracy of 0:1% of full scale and a corresponding natural frequency response of 150 KHz. An accurate industrial data acquisition
board is used. The frequency of measurement is 2800 Hz.
The intake has been tested at a free-stream Mach number of 2.0 without implementation of the bleed. All tests were conducted at zero-degree angle of attack. At the beginning of each test, the plug was in the rear position (fully open exit). Then, the plug was translated forward to reduce the exit area. For every free-stream Mach number, a similar set of eight exit areas was adjusted during the tests and pressures at sixty two points were obtained.
Measurement inaccuracies of some important val-ues are listed in Table 1. Two valval-ues have been reported for static pressure since two dierent types of pressure transducers have been used in this work. 2.4. Flow visualization setup
In this experiment, both Schlieren and shadowgraph optical techniques were used to visualize shock pattern and ow structure on the external region of the inlet. Mirrors and light source were arranged in a Z-type conguration [36] and an accurate table with two degrees of freedom was used to locate the knife-edge (razor blade in this case) at the focal of the receiving part. A CCD camera with a recording speed of 1000 frames per second (fps) was also used for taking the pictures.
3. Numerical method
A Computational Fluid Dynamics (CFD) solver devel-oped by authors was used to simulate the ow inside the inlet at its design free-stream Mach number, M1= 2:0,
in all operating conditions. In this code, Reynolds-Averaged Navier-Stocks (RANS) equations are solved numerically. Neglecting body forces, these equations,
in two-dimensional conservative forms, are: @Q @t + @T @x + @U
@y + V = @T
@x + @U
@y + V+ S;(1)
Q = 2 6 6 6 6 6 6 4 u E k ! 3 7 7 7 7 7 7 5
; T = 2 6 6 6 6 6 6 4 u P + u2
u uH uk u! 3 7 7 7 7 7 7 5 ; U = 2 6 6 6 6 6 6 4 v uv P + 2
vH vk v! 3 7 7 7 7 7 7 5
; V = 1y 2 6 6 6 6 6 6 4 v uv 2 vH vk v! 3 7 7 7 7 7 7 5 ;
Tv =
2 6 6 6 6 6 6 4 0 xx xy
uxx+ vxy qx
(L+ kt)@k@x
(L+ !t)@!@x
3 7 7 7 7 7 7 5 ;
Tv =
2 6 6 6 6 6 6 4 0 xx xy
uxy+ vyy qy
(L+ kt)@k@x
(L+ !t)@!@x
3 7 7 7 7 7 7 5 ;
Tv =
2 6 6 6 6 6 6 4 0 xr rr
uxy+ vyy qy
(L+ kt)@k@x
(L+ !t)@!@x
3 7 7 7 7 7 7 5 ; (2)
where Q denotes the conservative variable vector, T and U are inviscid ux vectors, Tv and Uv are the
viscous ux vectors in each spatial direction, V and Vv
are the source terms associated with the asymmetry, and S is the source term due to the turbulence model equations.
For a 2D axisymmetric problem, let = 1. Using explicit nite volume discretization, Eq. (1) becomes:
Qn+1i;j =Qn
i;j tAi;j i;j
" 4 X
k=1
(Fc)ksk
#
ti;jVi;j
+tAi;j
i;j
" 4 X
k=1
(Fv)ksk
#
+ ti;jVvi;j;
(3) where:
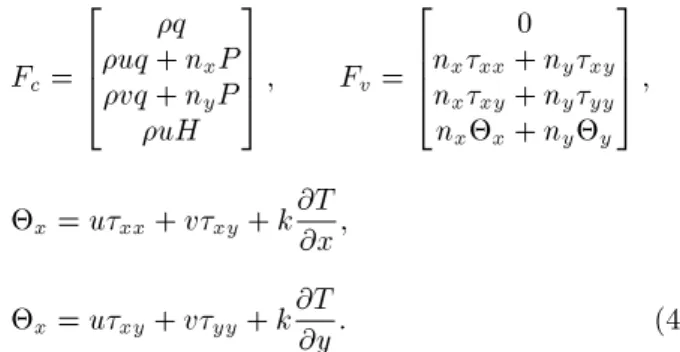
Fc =
2 6 6 4
q uq + nxP
vq + nyP
uH 3 7 7
5 ; Fv=
2 6 6 4
0 nxxx+ nyxy
nxxy+ nyyy
nxx+ nyy
3 7 7 5 ;
x= uxx+ vxy+ k@T@x;
x= uxy+ vyy+ k@T@y: (4)
In the above equations, H is the total enthalpy, A is the area of the cell, s is the length of the cell face, and q is the velocity component normal to the cell face. The convective uxes are computed by the second-order accurate Roe scheme. Also, a nite volume method, consistent with the overall discretization method, is used to calculate viscous uxes. Further descriptions of the governing equations and the numerical consider-ations could be found in [37,38].
Viscosity coecient is calculated using the lin-ear interpolation of laminar and turbulent viscosity coecients. Laminar viscosity coecient is molecular viscosity and it has been calculated using Sutherland relation. The turbulent viscosity coecient, however, has been calculated by the Menter's two-equation eddy viscosity k ! SST turbulence model [38]. The eddy viscosity of SST model is dened by [39]:
T = (a1k)= max(a1!; F2): (5)
With a1being a constant, equals the term @u=@y and
F2is a function that is one for boundary-layer ows and
zero for free shear layers [39].
The grid used for the simulations is shown in Figure 3. This grid was generated by an elliptic grid generator and could be rened or stretched in all or part of the physical domain. This structured grid is rened at the cowl lip and at the internal walls in order to capture physics of the boundary layer ow.
An intensive grid resolution study was performed to ensure the independence of the numerical solution from the grid size. Finally, a ne grid with about 90000
Figure 3. Elliptic grid around the inlet of study and boundary conditions.
Figure 4. Comparison of the present numerical prediction with experimental pressure recordings, M1= 2:0, = 0, and
EBR = 60%: (a) Static pressure ratio distribution on the spike; and (b) radial distribution for total pressure ratio at x=d = 2:4.
cells was chosen as the most optimum one. Further, near the wall, turbulent ow behavior is considered and the rst node (or cell centroid) is chosen at y+ equal
to unity.
Figure 4(a) compares the numerical and exper-imental static pressure distributions on the spike for Exit Blockage Ratio (EBR) of 60% and at a free-stream Mach number of 2.0 at zero-degree angle of attack. It could be seen that relatively good agreement between numerical prediction and experimental data exists. The error seen in the region of throat may be due to the eect of rake TR and struts blockage that have not been taken into account in the numerical prediction. However, maximum error in this region does not exceed 25%. Total pressure ratio at the subsonic diuser is measured by the rake MR at x=d = 2:4 and is compared with the numerical prediction in Figure 4(b). Again, good agreement between the experimental and numerical data is achieved. The prole of Figure 4(b) further ensures that the extent of ow separation has been simulated with acceptable accuracy.
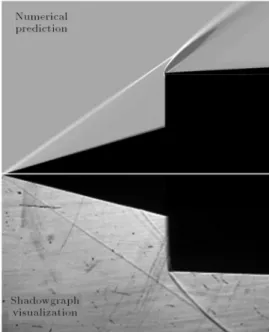
Figure 5 compares the axial density gradient contour together with shadowgraph shock structure visualization for a free-stream Mach number of 2.0 at zero-degree angle of attack for a supercritical condition to be dened in the next section. It can be seen that the location and inclination of shock waves have been simulated precisely. It also veries good performance of the numerical solver.
4. Inlet operating regimes
This section will remind dierent operating regimes of mixed-compression inlet under study and the corre-sponding shock patterns. Characteristic curve of an inlet, as shown in Figure 6, demonstrates variation of total pressure recovery of inlet versus inlet mass ow ratio. Total pressure recovery of inlet, , is dened as
Figure 5. Comparison of numerical axial density gradient contour with experimental shadowgraph image, M1= 2:0
and = 0.
the ratio of the mean total pressure at the end of the inlet duct to the free-stream total pressure. For the current inlet, mean total pressure at the end of the inlet duct is measured by the rake MR. Mass ow ratio, ", is the ratio of captured mass ow rate to the mass ow rate in the case of full ow operation (no spillage) [2]. It is also dened as the ratio of free-stream to full ow captured streamtube area.
" = _m_m1
c =
A1
Ac : (6)
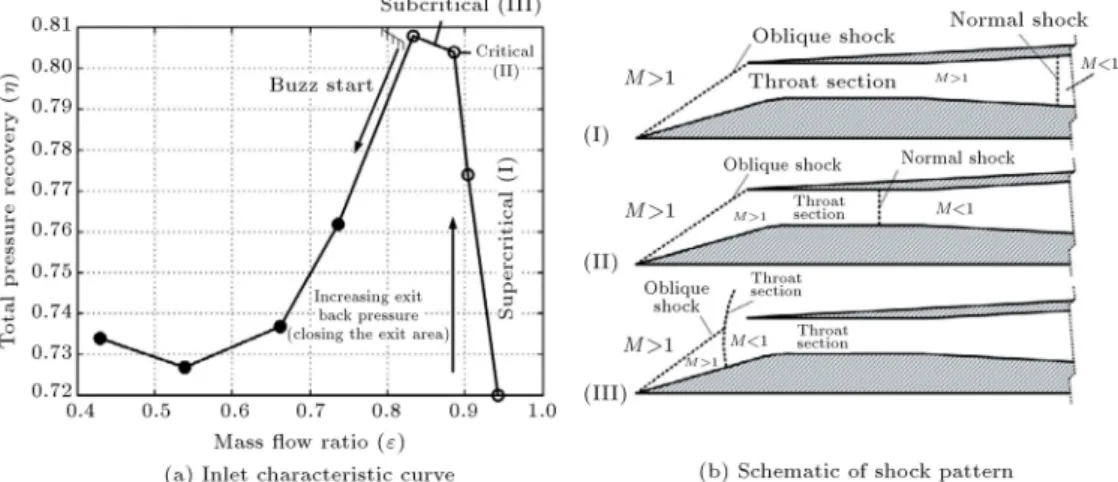
Characteristic curve of the inlet under study at a free-stream Mach number of 2.0, achieved by experimental pressure recordings, is shown in the left-hand side of Figure 6. As shown in this curve, three main operating
Figure 6. Experimental characteristic curve and operating regimes of mixed-compression inlet of this study and corresponding shock pattern at M1= 2:0.
regimes can be found for the inlet. These regimes were obtained through changing the inlet exit area by means of plug during the experiments. When the inlet exit area (Ae) is open and the back pressure is low
enough, the inlet operates at supercritical condition. Mass ow ratio is almost constant while back pressure ratio increases in this operating condition. The vertical region in the characteristic curve and the schematic (I) corresponds to this condition. According to schematic (I), normal shock is located in the divergent part of the diuser for this operating region.
The terminal shock location is forced by applying the backpressure to the inlet (by combustion chamber in the real engine). In this case, increase in the surface pressure in the divergent part together with the adverse pressure gradient due to the shock makes the ow prone to separation and, consequently, low pressure recovery; also, high ow distortion occurs. As the exit area is further decreased, normal shock wave moves toward the throat until it stands in the throat and the critical operating regime happens. The best operating point of the inlet is the critical point as maximum MFR and TPR are achievable. Schematic (II) in Figure 6 shows the shock pattern relevant to this case. The nearly horizontal part in the curve, Figure 6(a), shows the critical operating condition. As seen in the curve, maximum amounts for both mass ow ratio and total pressure recovery are obtained in this case. By closing the inlet exit area further beyond the critical point, nor-mal shock expels out of the inlet duct and ow spillage would happen; as a result, the inlet mass ow ratio deteriorates. In this case, interaction of the oblique and the normal shock is inevitable (schematic (III), Figure 6(b). The ow would become unstable if the exit area is further decreased and the buzz phenomenon would be triggered. In this case, inlet performance decreases as it can be seen in characteristic curve of the inlet, Figure 6(a).
In all operating conditions of the inlet, interaction
of shock with boundary-layer would greatly aect the ow eld as well as the inlet performance. Physical aspects of SBLI in each operating region highly depend on the location of shock waves. According to this fact, types of ow separation in a mixed-compression inlet can be categorized. This task will be accomplished in the following section and the ow eld corresponding to each category will be studied in the proceeding sections.
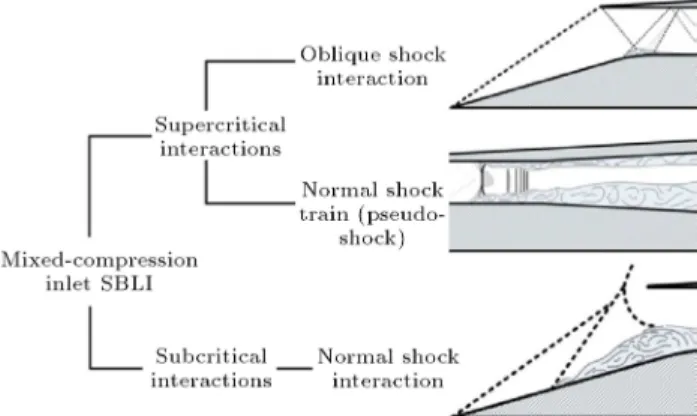
5. Classication of SBLI for mixed-compression inlets
For the mixed-compression inlets, compression is ac-complished by a series of oblique shocks and a ter-minal normal shock. When operating in supercritical condition, a portion of supersonic compression occurs inside the inlet duct via an oblique shock train and a near-normal shock while in subcritical condition, all contraction takes place out of the inlet duct via one or several oblique shocks (depending on the ramp design) and terminates with a normal shock. There exist dierent types of ow interactions relevant to these dierent shock structures.
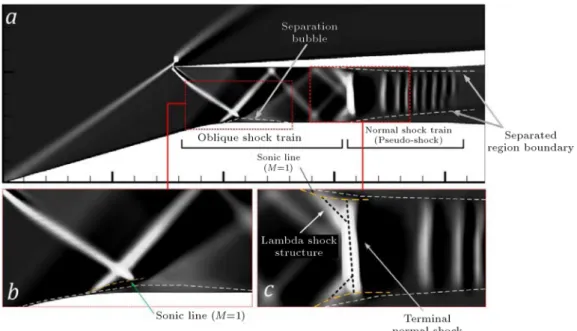
Figure 7 shows the grey-scale contour of axial derivative of density for the Exit Blockage Ratio (EBR) of 61% at a free-stream Mach number of 2.0 and at zero-degree angle of attack. It could be considered as the numerical Schlieren image of ow that is useful for understanding the shock structures inside the duct where experimental visualization of the ow is impos-sible. Comparing with schematics of Figure 6, it could be found that this gure is related to a supercritical operating condition. As Figure 7(a) demonstrates, the ow is compressed by an oblique shock before entering the duct. The external compression for the case study is done by a single conical shock due to the single-cone ramp. The external oblique shock in the case of full ow (critical and supercritical operating conditions at the design Mach number) impinges with the cowl lip
Figure 7. Numerical grey-scale contour of axial density gradient, M1= 2:0, = 0, and EBR = 61%.
and is then reected towards the spike surface. This incident shock separates the ow on the spike surface. Due to the formation of separated region, a separation shock forms and interacts with the reected oblique shock.
Figure 7(b) depicts the enlarged picture of this oblique shock wave boundary-layer interaction zone. Separated ow reattaches downstream and a separation bubble is formed. An expansion fan and a reattachment shock wave are also produced to change the ow direction and to expand it. The ow then passes through consecutive reections of oblique shock from both upper and lower walls of the duct and forms an oblique shock train. In the present paper, interactions of reected oblique shocks with the boundary-layer together with the interactions of oblique shocks with each other are called oblique shock interactions. Details on the physical phenomena related to these interactions will be presented in the subsequent sections.
The ow passes terminal normal shock after passing the oblique shock train. If no boundary layer exists, the pressure would increase discontinuously by a single normal shock. However, in the real ow, adverse pressure gradient due to the shock separates the ow at normal shock foot and the shock structure gets the shape of lambda. Figure 7(c) illustrates the enlarged image of ow at the normal shock location. The ow becomes subsonic downstream of the normal shock, but the extent of separation increases. Flow is retarded in the separation region and the major part of the mass ow passes through the upper and lower separation zones (core region). As the eective ow area decreases, the ow accelerates again and becomes supersonic in the core region. In this case, ow acts like passing through a supersonic diuser and a weaker normal
shock is generated. This process continues; however, the generated shocks become weaker and the distance between them decreases. Finally, the ow becomes fully subsonic. The region of successive normal shocks, which is caused by the interaction of normal shock with boundary-layer, is called normal shock train in the literature [20].
The subsonic ow then goes through a mixing region where there is no shock; but pressure gradually increases to some extent. Static pressure in this region does not change along the vertical axis. The details for the ow in this region will be presented later in Section 7. The term pseudo-shock is used for the whole region of normal shock train and mixing region. Depending on the location of normal shock, or better say the inlet backpressure, the length of pseudo-shock may be dierent.
For the subcritical operating condition where the normal shock expels out of the inlet duct, interaction of normal shock with boundary-layer can be found as well. This interaction may or may not cause ow separation. Figure 8 shows the ow visualization
Figure 8. (a) Shadowgraph ow visualization for: M1= 2:0, = 0, and EBR = 65%. (b) Schlieren ow
Figure 9. Classication of dierent SBLI ows related to a mixed-compression inlet.
images for 2 subcritical operation points. Figure 8(a) depicts the shock structure for the inlet at a free-stream Mach number of 2.0 and an exit blockage ratio of 65%. As shown in the gure, the normal shock is not strong enough to separate the ow, but there exist weak interactions and normal shock foot bifurcates. Yet, the ow in this case is stable. By further increasing the EBR, shock becomes stronger and the scale of separation grows. This causes the self-induced oscillations of shock. The phenomenon is called Buzz. Figure 8(b) illustrates the shock structure of ow in this case using a Schlieren image. Due to a greater ow separation, the angle of separation-shock and its strength increase; consequently, separation-shock bifurcation increases and normal shock gets the shape of lambda. Further study of ow physics in this case is considered in Section 8.
Therefore, interactions of shock with boundary-layers relevant to mixed-compression inlets can be classied into three major groups. Figure 9 indicates the classication chart for a mixed-compression inlet SBLI ow according to the operating conditions. Fur-ther discussion on each ow interaction phenomenon relevant to mixed-compression inlet on the basis of numerical and experimental results will be brought in the upcoming sections.
6. Oblique shock interactions
Figure 10 depicts variations of the wall static pressure ratio along the interaction zone together with the contour of Mach number for the present inlet at a free-stream Mach number of 2.0 and for an Exit Blockage ratio of 60%. The level of ood contour is bounded in order that the region of subsonic and supersonic ow can be divided and the sonic line becomes rec-ognizable. As shown in this gure, a separation bubble forms downstream of the separation point S. A dividing streamline between points S and R can be seen that separates the recirculating bubble from the ow streaming from upstream to downstream. An energy
Figure 10. Wall pressure distribution in a shock-induced separated ow together with contour of Mach number for M1= 2:0, = 0, and EBR = 60%.
Figure 11. Sketch of ow induced by a shock reection with separation.
transfer takes place from high-speed ow outside the bubble towards the separated inner region. This fact causes the ow velocity to increase as they approach downstream and reattaches the streamline [1]. Due to the strong interaction of shock with boundary-layer, this inner region is highly aected by the viscosity. As it is illustrated in Figure 10, specic shock patterns are shaped by this interaction.
Figure 11 shows a schematic of the ow induced by a shock reection with separation. A separation shock is located upstream of point S and deects the ow direction upward. This separation shock interacts with the incident shock. The slope of the separation bubble is smooth; hence, the compression near the surface is performed by several compression waves. In the reattachment part, the direction of ow should be changed downward; therefore, an expansion fan is formed. Downstream of the separation bubble, the ow
tion, Figure 10. The reason is that in the strong shock interactions, the viscosity plays a key role in the ow structure. Subsequent oblique shocks, reected from upper and lower walls of the inlet duct, also interact with boundary-layer when impinging with the opposite surface; but the interactions become weaker and no separation would occur.
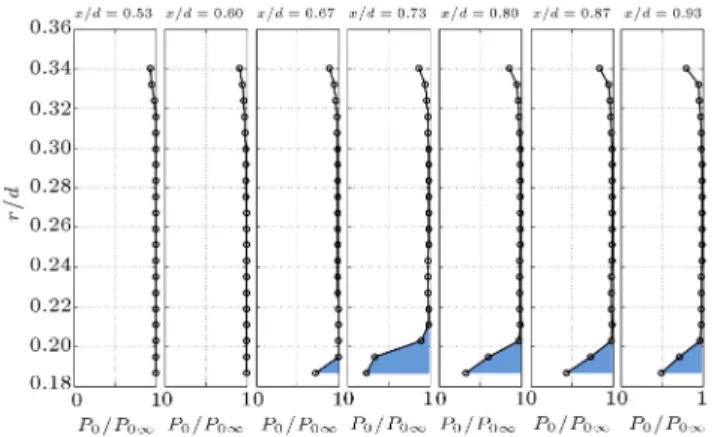
However, the question is that how such an inter-action aects the inlet performance? Figure 12 shows numerical results for the radial distribution of total pressure ratio across the separation zone for EBR = 61%. Shaded region indicates the total pressure losses in comparison with the inviscid shock reection. It is found from this gure that interaction of oblique shock with spike boundary-layer creates a region of dead ow and reduces the total pressure of the inlet. At the end of the rst pressure rise zone, total pressure loss is maximum due to the extent of the ow separation in that position. Also, interactions of shock waves with the boundary-layer of the internal surface of inlet cowl result in some total pressure losses, Figure 12. Using some means of boundary-layer removal would help avoiding the total pressure losses.
7. Normal shock train and pseudo-shock Figure 13 shows contour of the axial density derivative together with the static pressure distribution on the
Figure 12. Numerical results for radial distribution of total pressure ratio across the interaction zone, EBR = 61%.
Figure 13. Numerical wall pressure distribution and pressure distribution across a horizontal line together with the corresponding contour of axial density derivative, M1= 2:0, = 0, and EBR = 60%.
wall and in the middle line of the duct for the present mixed-compression inlet at a free-stream Mach number of 2.0 and for Exit blockage ratio of 60%. A normal shock train inside the duct appears. Dark regions behind the shocks demonstrate subsonic region. It could be found that the ow behind the shock goes through subsonic to supersonic isentropically and again decelerates to subsonic speed through a subsequent normal shock. Pressure increases sharply through each shock and then decreases behind the shock until it reaches the downstream normal shock. It is found from either the pressure distribution or the contour that the strength of shocks decreases as they approach downstream. The region in which the shocks are located is called the shock train region. After the last shock, the ow becomes subsonic, but there exists velocity dierence between the core ow and the near-wall region. As a result, a momentum exchange process between the core and the inner region ow takes place that makes the ow fully developed at the end of the region. The static pressure becomes constant along the radial direction, as seen in Figure 13, but the velocity prole changes continuously until the ow becomes uniform.
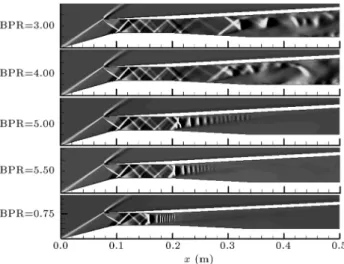
Figure 14 depicts axial density derivative for the mixed-compression inlet at dierent back pressure ratios for a free-stream Mach number of 2.0. For low back pressure ratios, most of the compression is done by oblique shock train and a single normal shock is seen. In this case, separated ow at the engine face highly aects the ow distortion. Increasing the backpressure ratio pushes the terminal normal shock upstream and the normal shock train forms. For moderate EBRs, the length of normal shock train and
Figure 14. Eect of back pressure ratio on the numerical contour of axial density derivative, M1= 2:0.
the mixing region as well as the number of consecutive shocks is large. As EBR further increases, the length of pseudo-shock decreases. If the length of pseudo-shock becomes smaller in comparison with the throat length, the amount of total pressure loss decreases.
Figures 15 demonstrates experimental measure-ments for total pressure recovery and ow distortion, respectively, at rake MR for dierent exit blockage ratios at free-stream Mach number of 2.0 and at zero-degree angle of attack. For cases with buzz, the time average of pressure signal is used. For EBR = 50%, variation of the total pressure across the radial direction is high since the terminal shock is located aft and the separated ow region is thicker. As the blockage ratio increases, the terminal shock moves upstream and the separated region becomes thinner and total pressure increases. For EBR = 62:5%, it is seen that a near-constant total pressure distribution is achieved, Figure 15(a). The ow distortion for this blockage ratio is also lower; however, a small deviation from the uniform distribution near the upper wall
occurs. Having performance curve of Figure 6 and shadowgraph image of Figure 8(a) in mind, we know that at EBR = 65:0%, the present inlet performs in the subcritical condition. Therefore, the separation due to the terminal normal shock is completely eliminated at the engine face and as a result, a more uniform stagnation pressure distribution is achieved as shown in Figure 15(a) for EBR = 65%. For the subsequent subcritical operating conditions, the ow distortion remains rather low. Losses due to buzz phenomenon and ow separation on the compression surface cause the amount of stagnation pressure to reduce as the inlet mass ow ratio decreases.
Figure 16 shows the pressure spectra at x=d = 2:4 measured by rake MR for dierent exit block-age ratios before buzz onset at a free-stream Mach number of 2.0 and at zero-degree angle of attack. For EBRs equal to 55.0% and 60.0% at measured pressure spectra, this gure indicates high magnitude at almost all frequencies, which is a typical behavior of separated ow. An important point is that the amplitude of pressure signal at dierent frequencies for EBR = 60:0% is lower than the one for EBR = 55:0%. As the terminal normal shock moves upstream through increasing the back pressure, the pseudo-shock approaches upstream and its length decreases. As a result, the momentum exchange between central core ow and low-speed dissipative ow starts earlier for greater EBRs and because of this oscillations of ow near the wall, it decreases. For higher exit blockage ratios, one cannot nd any considerable magnitudes at high and at moderate frequencies. This is another reason for the trend of ow distortion that is illustrated in Figure 15(b).
Therefore, it is seen that the pseudo-shock highly aects inlet performance parameters, especially ow distortion, at the engine face. On the other hand, pseudo-shock has some dynamic distortion eects that stem from the self-excited oscillations of shock-train.
Figure 15. (a) Experimental radial total pressure distributions at rake MR at dierent EBRs, M1= 2:0 and = 0. (b)
Figure 16. Spectra of measured wall pressure for dierent exit blockage ratios at x=d = 2:4, M1= 2:0, and = 0.
Figure 17. Spectra of measured total pressure for two EBRs at r=d = 0:27, x=d = 2:4, M1= 2:0, and = 0.
When shock interacts with boundary-layer, the loca-tion of shock cannot be determined easily since it uctuates with time, even if boundary conditions are held constant upstream and downstream of the shock. Figure 17 shows spectra of total pressure mea-sured at x=d = 2:4 and in the centreline of inlet duct (r=d = 0:27) for a free-stream Mach number of 2.0. Wall pressure spectra for EBR = 62:5% and EBR = 65:0%, as shown in Figure 16, has no considerable oscillation frequencies. Furthermore, total pressure distribution of Figure 15(a) conrms that the width of retarded ow region is far less than the lower exit blockage ratios. Therefore, the ow in the core region at these exit blockage ratios is expected to be uniform while the upstream and downstream bound-ary conditions are constant. However, as Figure 17 illustrates, several active frequencies can be found in
the total pressure spectra of stagnation pressures. The reason may be oscillations of the pseudo-shock that cause the downstream total pressure to uctuate. The strength of normal shock trains may dier as they move upstream and downstream. In correlation with the shock strength, total pressure loss due to shock diers and makes the total pressure at the end of the inlet duct change. Meanwhile, no distinct frequency can be detected to assign for the pseudo-shock oscillations.
Total pressure tap of Figure 17 is located nearly at the end of inlet duct. At EBR = 62:5% and 65.0%, pressure tap is located at the end of mixing region of pseudo-shock and in the separated ow of spike surface. Thus, oscillations of pseudo-shock structure do not lead to an alternating total pressure change in this region, but inject some oscillatory perturbations into the mixing region. This leads to a set of random
oscillations and in this way, a set of frequencies with considerable magnitude can be found in the pressure spectra. The spectra of EBR = 65:0% involve more frequencies with considerable magnitude in comparison with the EBR = 62:5%, while the ow is expected to be less oscillatory due to elimination of the pseudo-shock at EBR = 65:0%. The expelled normal pseudo-shock for EBR = 65:0% interacts with the boundary-layer of external compression cone that leads to little buzz oscillations. This ow phenomenon is discussed in the next section.
8. Subcritical interactions
As the inlet back pressure increases, the upstream normal shock is pushed until it expels out of the inlet duct. In this case, interaction of normal shock with boundary-layer occurs. For moderate back pressure ratios, the interaction is weak (Figure 8(a)). Further reduction of exit area strengthens the normal shock and the boundary-layer becomes prone to separation.
Figure 18 shows schematic of the normal SBLI together with a Schlieren image of ow eld for the present mixed-compression inlet. Separation zone acts like a viscous wedge and a separation shock forms. This shock interacts with normal shock in a point known as triple point and a slip line emits from the point of interaction across which the ow velocity changes sharply. Shock foot declines near the separation zone and creates a lambda-like structure. The separation zone grows inside the duct and results in ow spillage. In this way, separation blocks the ow direction and increases the inlet back pressure. It is found to be one of the mechanisms of Buzz initiation known as Dailey criterion [40]. This mechanism results in high amplitude oscillations of normal shock and aects the inlet ow stability.
Another buzz mechanism was found by Ferri and Nucci in 1951 [41]. They concluded that buzz starts when vortex sheet, which stems from interaction of
Figure 18. (a) Schlieren image of ow eld. (b) Schematic of normal SBLI of mixed-compression inlet.
Figure 19. Power spectral density of sensor S7 at dierent EBR values, x=d = 0:374, M1= 2:0, and = 0.
shock waves, collides with the cowl inner surface. Velocity discontinuity across the vortex sheet causes the ow on internal surfaces of the duct to separate and diuser chocking results. This mechanism leads to low-amplitude high-frequency oscillations of normal shock wave.
For the present inlet, the dominant mechanism is Dailey criterion. Figure 19 shows the power spectral density of pressure recording for a tap on the external compression cone surface. It is seen that signicant frequencies are detectable in relation with buzz for various EBRs. The fundamental frequency of buzz increases as the exit blockage ratio increases. Note that as the mass ow ratio reduces the strength of the shock, interaction increases. To better realize the behavior of boundary-layer during a buzz cycle, Schlieren images of the ow eld are provided in Figure 20. This gure shows four consecutive instants in a big buzz cycle (high-amplitude oscillation). The time interval between each image is 1ms. It is seen that as the time interval increases, the separation zone grows and pushes the upstream normal shock towards the incoming ow. Extent of the separation region is seen
Figure 20. Schlieren images of four consecutive instants of buzz: M1= 2:0, = 0 and EBR = 75:0%.
inlets. Results show that these ow interaction phe-nomena have dierent eects on the stability and on the performance of the inlet. Interaction of terminal normal shock with internal duct boundary-layer causes pseudo-shock phenomenon that leads to increase in ow distortion and reduction of total pressure recovery. In addition, interaction of normal shock wave with external cone boundary-layer causes buzz instability and degrades inlet performance. The unsteady nature of ow due to shock boundary-layer interactions is also detected by means of experimental measurements. In supercritical operating condition, pseudo-shock has an oscillatory nature that may cause dynamic distortion at the engine face. In subcritical operating condition that normal shock resides on the external compression cone, normal shock interacts with boundary-layer in that region. This interaction, if the back pressure ratio is high enough, leads to ow separation and may even chock the inlet. It causes self-excited ow oscillations, called buzz, and specic frequencies can be found for oscillations in the measured pressure spectra. Flow stability of inlet highly depends on the buzz characteristics. In order to avoid harmful eects of such interactions, ow control devices such as boundary-layer bleed should be applied.
Consequently, behavior of SBLI ow phenomena should be understood carefully in order to consider the corresponding eects of interactions during the inlet design process and for designing ow control devices.
Acknowledgement
The authors gratefully acknowledge the supports of the Mesbah Research Institute.
Nomenclature
Latin letter
Ac Inlet capture area (m2)
A1 Captured free stream area (m2)
d Intake maximum outer diameter (m) L Intake length (m)
Subscripts
0 Total conditions 1 Free stream conditions
References
1. Babinsky, H. and Harvey, J.K., Shock Wave-Boundary-Layer Interactions, Cambridge University Press, New York, USA (2011).
2. Seddon, J. and Goldsmith, E.L., Intake Aerodynamics, AIAA Education Series, 2nd Edn., pp. 268-292, AIAA, Reston, VA, USA (1999).
3. Trapier, S., Duveau, P. and Deck, S. \Experimental study of supersonic inlet buzz", AIAA Journal, 44(10), pp. 2354-2356 (2006).
4. Trapier, S., Deck, S. and Duveau, P. \Time-frequency analysis and detection of supersonic inlet buzz", AIAA Journal, 45(9), pp. 2273-2284 (2007).
5. Herrmann, D. and Triesch, K. \Experimental inves-tigation of isolated inlets for high agile missiles", Aerospace Science and Technology, 10(8), pp. 659-667 (2006).
6. Hirschen, C., Herrmann, D. and Gulhan, A. \Experi-mental investigations of the performance and unsteady behavior of a supersonic intake", Journal of Propulsion and Power, 23(3), pp. 566-574 (2007).
7. Herrmann, D., Triesch, K. and Gulhan, A. \experi-mental study of chin intakes for airbreathing missiles with high agility", Journal of Propulsion and Power, 24(2), pp. 236-244 (2008).
8. Das, S. and Prasad, J.K. \Unstart suppression and performance analysis of supersonic air-intake adopting bleed and cowl bending", Journal of the Institution of Engineers (India)-Aerospace Engineering, 9(1), pp. 27-35 (2010).
9. Soltani, M.R., Farahani, M. and Asgari Kaji, M.H. \An experimental study of buzz instability in an ax-isymmetric supersonic inlet", Scientia Iranica, 18(2), pp. 241-249 (2011).
10. Herrmann, D., Blem, S. and Gulhan, A. \Experimen-tal study of boundary-layer bleed impact on ramjet inlet performance", Journal of Propulsion and Power, 27(6), pp. 1186-1195 (2011).
11. Soltani, M.R. and Farahani, M. \Experimental investi-gation of eects of Mach number on the ow instability in a supersonic inlet", Experimental Techniques, 37(3), pp. 46-54 (2013).
12. Soltani, M.R. and Farahani, M. \Eects of angle of attack on the inlet buzz", Journal of Propulsion and Power, 28(4), pp. 747-757 (2012).
13. Herrmann, D., Siebe, F. and Gulhan, A. \Pressure uctuations (buzzing) and inlet performance of an air-breathing missile", Journal of Propulsion and Power, 29(4), pp. 839-848 (2013).
14. Soltani, M.R., Sepahi Younsi, J. and Daliri, A. \Per-formance investigation of a supersonic air intake in the presence of the boundary-layer suction", Proc. IMechE Part G: J. Aerospace Engineering, 229(8), pp. 1495-1509 (2015).
15. Lu, P.J. and Jain, L.T. \Numerical investigation of inlet buzz ow", Journal of Propulsion and Power, 14(1), pp. 90-100 (1998).
16. Oh, J.Y., Ma, F., Hsieh, S.Y. and Yan V. \Interactions between shock and acoustic waves in a supersonic inlet diuser", Journal of Propulsion and Power, 21(3), pp. 486-495 (2005).
17. Trapier, S., Deck, S. and Duveau, P. \Delayed detached-eddy simulation and analysis of supersonic inlet buzz", AIAA Journal, 46(1), pp. 118-131 (2008). 18. Vivek, P. and Mittal, S. \Buzz instability in a mixed-compression air intake", Journal of Propulsion and Power, 25(3), pp. 819-822 (2009).
19. Kotteda, V.M.K. and Mittal, S. \Viscous ow in a mixed compression intake", Int. J. Numer. Meth. Fluids, 67(11), pp. 1393-1417 (2011).
20. Viswanath, P.R. \Shock-wave turbulent boundary-layer interaction and its control: a survey of recent development", Sadhana, 12(1), pp. 45-104 (1988). 21. Matsuo, K., Miyazato, Y. and Kim, H.D. \Shock
train and pseudo-shock phenomena in internal gas ows", Progress in Aerospace Sciences, 35(1), pp. 33-100 (1999).
22. Knight, D., Yan, H., Panaras, A.G. and Zheltovodov, A. \Advances in CFD prediction of shock wave turbulent boundary layer interactions", Progress in Aerospace Sciences, 39(2-3), pp. 121-184 (2003). 23. Mousavi, S.M. and Roohi, E. \Large eddy simulation
of shock train in a convergent-divergent nozzle", In-ternational Journal of Modern Physics C, 25(4), p. 1450003 (2014).
24. Mousavi, S.M. and Roohi, E. \Three dimensional in-vestigation of the shock train structure in a convergent-divergent nozzle", Acta Aeronautica, 105(1), pp. 117-127 (2014).
25. Gaitonde, D.V. \Progress in shock wave/boundary layer interactions", AIAA 43rd Fluid Dynamics Con-ference, San Diego, CA, AIAA Paper 2013-2607 (2013).
26. Dussauge, J.P., Dupont, P. and Debieve, J.F. \Un-steadiness in shock wave boundary layer interactions with separation", Aerospace Science and Technology, 10(2), pp. 85-91 (2006).
27. Aubard, G., Gloerfelt, X. and Robinet, J.C. \Large-eddy simulation of broadband unsteadiness in a shock/boundary-layer interaction", AIAA Journal, 51(10), pp. 2395-2409 (2013).
28. Galli, A., Corbel, B. and Bur, R. \Control of forced shock-wave oscillations and separated boundary layer interaction", Aerospace Science and Technology, 9(8), pp. 653-660 (2005).
29. Titchener, N. and Babinsky, H. \Shock wave/boundary-layer interaction control using a combination of vortex generators and bleed", AIAA Journal, 51(5), pp. 1221-1233 (2013).
30. Ali, Y.M., Alvi, F.S. and Kumar, R. \Studies on the inuence of steady microactuators on shock-wave/boundary-layer interaction", AIAA Journal, 51(12), pp. 2753-2762 (2013).
31. Hamed, A. and Shang, J.S. \Survey of validation data base for shockwave boundary-layer interactions in supersonic inlets", Journal of Propulsion and Power, 7(4), pp. 617-625 (1991).
32. Sajben, M., Donovan, J.F. and Morris, M.J. \Ex-perimental investigation of terminal shock sensors for mixed-compression inlets", Journal of Propulsion and Power, 8(1), pp. 168-174 (1992).
33. Fischer, C. and Olivier, H. \Experimental investigation of the shock train in an isolator of a scramjet inlet", 17th AIAA International Space Planes and Hypersonic Systems and Technologies Conference, San Francisco, CA, AIAA 2011-2220 (2011).
34. Troia, T.J., Patel, A.A., Crouse, D. and Hall, G.R. \Passive device ow control for normal shock/boundary layer interactions in external com-pression inlets", 41st AIAA Fluid Dynamics Confer-ence and Exhibit, Hawaii, Honolulu, AIAA 2011-3911 (2011).
35. Loth, E., Titchener, N., Babinsky, H. and Povinelli, L. \Canonical normal shock wave/boundary-layer in-teraction ow relevant to external compression inlets", AIAA Journal, 51(9), pp. 2208-2217 (2013).
36. Settles, G.S., Schlieren and Shadowgraph Techniques, Springer-Verlag, New York, USA (2001).
37. Soltani, M.R., Sepahi Younsi, J. and Farahani, M. \Investigation of new ux scheme for the numeri-cal simulation of the supersonic intake ow", Proc. IMechE Part G: J. Aerospace Engineering, 226(11), pp. 1445-1454 (2011).
38. Kwak, E. and Lee, S. \Convergence study of in-let buzz frequency with computational parameters", 29th AIAA Applied Aerodynamics Conference, Hawaii, Honolulu, AIAA 2011-3362 (2011).
in Aerodynamics from the University of Illinois at Urbana-Champaign, USA, and is now Professor in the Aerospace Engineering Department at Sharif Univer-sity of Technology, Tehran. His research interests include applied aerodynamics, unsteady aerodynamics, wind tunnel testing, wind tunnel design, and data processing.
in Aerodynamics from the Aerospace Engineering De-partment at Sharif University of Technology, Tehran, Iran. He is now Assistant Professor in the Mechanical and Aerospace Engineering Department at Ferdowsi University of Mashhad, Mashhad, Iran. He works in the eld of numerical and experimental aerodynam-ics.