Cover Page
The handle
http://hdl.handle.net/1887/25784
holds various files of this Leiden University
dissertation.
Author
: Nicolardi, Simone
Title
: Development of ultrahigh resolution FTICR mass spectrometry methods for
clinical proteomics
Development of ultrahigh resolution
FTICR mass spectrometry methods
for clinical proteomics
ISBN: 978-94-6182-435-6
The research described in this thesis was financially supported by the
Center for Translational Molecular Medicine (CTMM).
Printing: OffPage, Amsterdam
Copyright © 2014 by S. Nicolardi. All rights reserved. No part of
Development of ultrahigh resolution
FTICR mass spectrometry methods
for clinical proteomics
proefschrift
ter verkrijging van de graad van Doctor aan de Universiteit Leiden, op
gezag van Rector Magnificus prof.mr. C.J.J.M. Stolker,
volgens besluit van het College voor Promoties te verdedigen op
dinsdag 20 mei 2014, klokke 15.00 uur
door
Simone Nicolardi
PROMOTIECOMMISSIE
Promotores:
Prof.dr. A.M. Deelder
Prof.dr. R.A.E.M. Tollenaar
Co-promotor:
Dr. Y.E.M. van der Burgt
Overige Leden:
Prof.dr. G.A. Meijer
Dept.of Pathology, VU University Medical Center (VUMC), The Netherlands
Prof.dr. R. Cramer
Dept. of Chemistry, University of Reading, United Kingdom
Prof.dr. H.J. Tanke
Prof.dr. F. Koning
TABLE OF CONTENTS
Introduction
7
Chapter 1
Standardized and automated solid-phase extractionprocedures for high-throughput proteomics of body fluids
29
Chapter 2
Precision profiling and identification of human serumpeptides using Fourier transform ion cyclotron resonance mass spectrometry
51
Chapter 3
Quality control based on isotopic distributions forhigh-throughput MALDI-TOF and MALDI-FTICR serum peptide profiling
69
Chapter 4
Identification of human serum peptides in Fourier transform ion cyclotron resonance precision profiles95
Chapter 5
Mapping O-glycosylation of apolipoprotein C-III inMALDI-FT-ICR protein profiles
109
Chapter 6
Identification of new Apolipoprotein-CIII glycoforms with ultrahigh resolution MALDI-FTICR mass spectrometry of human sera131
Chapter 7
Serum biomarker signatures of pancreatic cancer usingMALDI-FTICR peptide and protein profiles
161
General Discussion
191
Summary
205
Samenvatting
210
Acknowledgements
214
Curriculum vitae
216
8
A myriad of scientists have been fascinated from multiple perspectives by the
complexity of blood. This biological fluid is known for a variety of functions such as
transportation of oxygen and carbon dioxide through the lungs, transport and removal of
nutrients, and heat transport and immunity. Blood collects products of the human
metabolism throughout the entire body. The first studies on the blood circulation system
can be dated back to 1260 when the Arabic scholar, mathematician and physician Ibn
al-Nafis described the “minor circulation” of the human body [1]. Later, with the invention
of the microscope, the Dutch naturalist Jan Swammerdam was the first one to observe red
blood cells (1658) [2]. These cells have remained the only blood constituents observable
with a microscope until 1842 when Alfred Donné, a French physician discovered platelets
[3]. One year later, leukocytes were simultaneously described by Gabriel Andral, a French
professor of medicine, and William Addison, an English country practitioner [4,5].
Nowadays we know that blood is a complex mixture of electrolytes and various
biomolecules, such as lipids, carbohydrates, and proteins. Often, blood cells and
fibrinogen are removed through centrifugation, yielding serum or plasma. The wealth of
bioinformatic information, which can be derived from analysis of blood, in combination
with the minimally invasive way to obtain blood by antecubital venipuncture have led to
the availability of many (clinical) tests to routinely analyse specific serum or plasma
components. The levels of biomolecules change according to the physiological condition
of the body, although to a lesser extent than in the case of urine. One of the best known
examples is the glucose concentration in blood, but there are many more species that can
change in concentration or even identity over time. It is often hypothesized that such
Introduction
9 pathological state. To that end human serum or plasma samples have been studied
extensively in relation to various diseases.
Like for other serum components, since a few decades abnormal proteins levels
have been found to be associated with certain pathological conditions [6,7]. The variety of
human serum proteins is vast, with over 10,500 gene products described
(http://www.plasmaproteomedatabase.org/ y2013). Protein concentrations in serum range
over ten orders of magnitude [8]; these proteins all have different structures, amino acid
compositions, molecular weights, chemical-physical properties and functionalities.
Albumin is the most abundant serum protein (34-54 mg/ml in humans) and constitutes
approximately 95% of the total serum protein content together with immunoglobulins,
transferrin, macroglobulin, and apolipoproteins. This phenomenon severely hampers the
analysis of the proteins present at much lower concentrations and although several
analytical approaches can be used to decrease serum complexity, the investigation of these
so-called low-abundant proteins remains challenging [8,9]. Serum complexity is
furthermore increased by the fact that proteins can be cleaved by (endogenous) enzymes
into smaller peptides or proteins. Specific enzymes are activated as a consequence of a
change of the physiological condition cleaving specific peptide bonds and producing
functional peptides or proteins. For example, angiotensinogen is cleaved by renin to form
angiotensin I peptide, a ten amino acid long peptide that is further cleaved by
angiotensin-converting enzyme to form angiotensin II peptide. This peptide is a hormone that
increases blood pressure. Furthermore, many unspecific cleavages of proteins are
observed in blood-related samples: peptides derived from such degradation are often
10
Methods for the determination of the elemental composition of proteins have
been developed since the middle 1910s [10]. For this purpose, two-dimensional gel
electrophoresis has been a widely applied technology to separate proteins [11]. It is
commonly agreed that the identification of a protein from a gel by mass spectrometry
(MS) through peptide sequencing was first reported by Matthias Mann [12]. However,
several other scientists have pioneered in the field of peptide- and protein identifications
by means of MS, like Sundqvist, Heerma, Roepstorff, Hunt and Yates [13-17]. It was only
in the middle 1990s, at the same time that the Human Genome Project received great
attention, that mass spectrometry for protein identification grew to its current size. It was
clear that the identification and characterization of all human proteins would provide
biologically relevant information complementary to genomic studies, however it would
take a few more years before technology was in place. To make an analogy with the term
genomics, this new discipline was called proteomics [18]. Consequently, new
technologies were developed to provide innovative methods for the separation, the
detection and the characterization of proteins, and MS has evolved from an early,
laborious protein analysis tool [19,20] into a high-throughput highly automated method.
Nowadays, MS is the method of choice in proteomics for the analysis of complex protein
samples (e.g. human serum) [21]. However, its application requires proper and
standardized sample preparation. There is an enormous variety of techniques that can be
employed to clean up, separate or fractionate peptides and proteins from biological
sources [22]. Reversed-phase (RP), ion exchange, size exclusion and affinity
chromatography have been applied using different technologies including ZipTip pipette
tips, cartridges and magnetic beads for solid-phase extraction (SPE) and columns for
Introduction
11 of these techniques, it is ready for mass spectrometric analysis. MS-analysis requires an
ionization source, a mass analyzer and a detector, usually integrated in a commercially
available mass spectrometer or MS-system.
In a mass spectrometer, ions are generated in an ionization source and then
transferred to the detector following a decrease of potential energy; during this path, ions
can be trapped, focused, “cooled”, excited, accelerated, and fragmented. The technology
behind all these processes is diverse and is used in different configuration to create mass
spectrometers with different characteristics, resulting in different performance and
capability. MS is sensitive, allows the detection of as little as a few hundred molecules
and the identification of protein amino acid sequence including post-translational
modifications (PTMs) such as glycosylation or phosphorylation. Despite this, the direct
analysis of complex protein mixtures (e.g. human serum) by MS, with some exceptions
(e.g. dried blood analysis, identification of bacteria), requires procedures that result in a
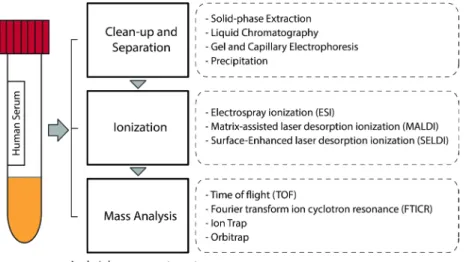
reduced complexity of the sample (see Figure 1). The combination of these procedures
with different ionization techniques and mass analysers allows the in-depth investigation
of the human serum proteome.
The two most common ionization sources for biomolecules are based on
matrix-assisted laser desorption/ionization (MALDI) or electrospray ionization (ESI). It is fair to
state that at least in part MALDI and ESI provide complementary information, and that
the method of choice depends on the application. The latter ionization is generally used to
analyse compounds present in solution and has the advantage of on-line coupling with
chromatography systems. ESI of peptides and proteins produces a broad distribution of
multiply-charged ions in the gas phase resulting in multiple peaks in the mass spectrum
12
Figure 1. General workflow for the MS analysis of human serum peptides and proteins.
The charge state depends on both the composition of the liquid in which peptides
and proteins are dissolved and their amino acid composition and structure. These
multiply-charged ions are suitable for further MS identification experiments (i.e. MS/MS)
that are based on the isolation and fragmentation of a particular ionized species
(i.e. precursor ion). The preferred ions for MS/MS-analysis are (de)protonated species
(i.e. [M+nH]n+ or [M-nH]n-), but also other precursor ions have been used for
identification studies. The MS analysis of the fragment ions allows the identification of
the primary sequence of the isolated peptide or protein. In so-called bottom-up proteomics
studies, proteins are identified by digesting protein(s) into peptides with a proteolytic
enzyme such as trypsin, followed by separation of the resulting peptides by RP-LC with
continuous MS/MS “read-out” for each eluting peptide precursor. Peptide sequences are
obtained from the corresponding MS/MS-spectrum with a database search tool, such as
Introduction
13 Proteins identities (IDs) are then inferred from unique peptide sequence
identifications. The utility of protein identification by database search depends upon the
existence of a reference database that contains ideally all peptides of interest. This
approach allows the identification of thousands of proteins in a single experiment [24].
However, it should be borne in mind that the presence of PTMs may affect the proteolytic
efficiency of the enzyme, the recoveries from a clean-up procedure, retention time of the
LC, and both the ESI the MS/MS efficiency. Thus, the identification of modified peptides
by a bottom-up approach is not trivial. As an alternative approach and to overcome (some
of) these problems, the interest for the analysis of proteins without any enzymatic
digestion has tremendously grown the last few years [25]. This approach, referred to as
top-down proteomics, allows the characterization of intact proteins from their MS/MS
spectra [26,27]. Different proteoforms – all the different molecular forms in which the
protein product of a single gene can be found, including changes due to genetic variations,
alternatively spliced RNA transcripts and PTMs [28] – can be identified localizing
differences in their amino acid sequences or PTMs. Top-down analysis requires mass
spectrometers with very high resolving powers and mass accuracy (e.g. Orbitrap,
Fourier transform ion cyclotron resonance (FTICR)). Unfortunately, ultrahigh resolution
comes at the cost of longer analysis times, thus hampering application in traditional
LC/MS/MS experiments. In general, ESI of an intact protein leads to highly charged ions
with large isotopic distribution and different charge states. The fragmentation of intact
proteins in an MS/MS experiment yields a large number of fragment ions, the isotopic
distributions of which may overlap each other, thereby increasing the complexity of the
spectra. In order to tackle this complexity, very high resolution measurements and
14
characterization of intact proteins is mainly performed by direct infusion- (DI)
ESI-MS/MS analysis after off-line clean-up and/or fractionation procedures. However, the last
generation Orbitrap and high resolution time-of-flight (TOF) mass analysers offer the
sensitivity, the mass resolution and the acquisition speed needed for top-down proteomics
on a LC time-scale [29].
Tandem-MS or MS/MS of peptides and proteins can be performed in various
ways using different fragmentation techniques [30]. Fragmentation by collision-induced
dissociation (CID) occurs after acceleration of the ionized molecules by an electric field
and collision with neutral gasses (e.g. helium, nitrogen or argon). Upon collision, part of
the translational energy of the ionized molecules is converted into internal energy leading
to the breakage of the peptide bonds and fragmentation of the precursor ion into smaller
fragments. In a second and increasingly used dissociation process, electron-transfer
dissociation (ETD) [31], low energy electrons are transferred from radical anions to
multiply protonated molecules in the gas phase (i.e. [M+nH]n+) inducing random
cleavages along the polypeptide backbone. Reactive radical anions are generated by
reaction of neutral molecules of reagent (e.g. fluoranthene) and low energy electrons
(i.e. lower than 1 eV) produced in a chemical ionization source after bombardment of a
mediator gas (e.g. methane) with high energy electrons (i.e. 60-80 eV). The types of
fragment ions obtained by CID and ETD depend on many factors including the amino
acid sequence, the amount of internal energy, the charge state, the amount of radical
anions, the reaction time, etc. As depicted in Figure 2, CID predominantly generates
Introduction
15 Figure 2. Peptide fragment ions observed in MS/MS spectra. The type of fragments
generated in a MS/MS experiments depend on used fragmentation technique.
Collision-induced dissociation predominantly yields b- and y-type ions while electron transfer
dissociation results in c- and z-type ions.
One of major advantages of ETD in MS-based proteomics is the ability to
localize the exact site of PTMs that can be missed by CID [33]. For example, CID of
glycosylated peptides/proteins primarily leads to the fragmentation of the glycan structure
with very low efficiency in the fragmentation of the polypeptide backbone. Instead, ETD
16
property allows a better characterization of protein isoforms and PTMs, especially in
top-down experiments [34]. It has been shown that CID and ETD provide complementary
information in terms of the primary sequence coverage of unmodified peptides and that
the combination of these two methods in bottom-up experiments improves the total
number of identified species [35]. In electron-capture dissociation (ECD) the multiply
protonated ions overlap with “free” high energy electrons (released from a cathode) that
results in a type of fragmentation that is similar to ETD experiments [36,37]. This
technique has been developed in FTICR-MS and is often applied for the characterization
of intact proteins by top-down MS/MS.
The generation of multiply charged ions using ESI facilitates
MS/MS-experiments, but on the other hand complicates the mass spectrum and thus limits the
analysis of complex mixtures. On the contrary, MALDI of peptides and proteins generates
mainly singly charged ions (i.e. mainly [M+H]+ or [M-H]-) thus yielding MS spectra with
a reduced number of overlapping species that are relatively easy to interpret [38].
In MALDI, the analyte is co-crystallized with an excess of a small, organic chemical
compound (i.e. chemical matrix) that adsorbs laser energy and distributes this energy to
the sample. This process induces a very rapid heating of the sample generating the
vaporization of both the matrix and the analyte with as a consequence the removal of a
certain amount of the sample (the so-called ablation). In conjunction with the ablation
process the ionization of a minor fraction of matrix and analyte occurs. With high-end
MALDI sources proteins in the concentration range of as low as attomoles can be
detected. Apart from other factors the ionization efficiency depends on the used chemical
matrix. Alpha-cyano-4-hydroxycinnamic acid (CHCA) is a small aromatic acid
Introduction
17 CHCA crystallizes in a homogeneous manner and provides MALDI-spots that allow
automated MS acquisitions. Surface enhanced laser desorption/ionization (SELDI) is a
variation of MALDI that is based on a chemically modified surface to selectively capture
peptides and proteins from a complex mixture [39]. The sample preparation procedure
(i.e. capture and washing) is performed directly on a modified target plate improving the
throughput of the analysis.
Time-of-flight mass spectrometers. In a TOF mass analyser, ions with different
mass-to-charge (m/z) ratios are separated in a flight tube based on their different flight times.
To this end, all ions are accelerated to a defined kinetic energy (i.e. ½mv2) and introduced
into the flight tube simultaneously (delayed extraction). The accelerated ions then travel in
a field-free region to a multichannel plate (MCP) detector. The “heavier ions” travel
slower than the “lighter ions” and thus will be detected sequentially. By also measuring
ions (molecules) with a known m/z-value the instrument can be calibrated through simple
correlation of the flight time with the m/z-value. The mass resolution (i.e. ∆mass/mass) of
a linear TOF mass analyser depends on the time interval in which ions with identical m/z
-values reach the MCP detector. Factors that determine this interval are temporal
distribution, spatial distribution and energy distribution of the ions. In modern mass
analysers these factors are reduced through the implementation of specific technologies or
configurations. For example, in reflectron TOF analysers the effect of the initial kinetic
energy distribution on the mass resolution is counter-balanced using an electrostatic field
for ion reflection. The reflectron, or ion mirror, thus allows compensating small ion
energy differences by adjusting voltages. As a result, ions are more focused in time and
-18
values, because in the reflectron configuration the transmission efficiency is decreased.
Reflectron mode spectra are often referred to as high resolution profiles, with typical
resolving powers of between 7,000 and 10,000 [40]. TOF instruments are “no scanning”
and fast (i.e. low duty cycle) mass analysers that allow high-throughput measurements
when combined with MALDI- or ESI sources. TOF analysers have been used in
combination with both MALDI and ESI sources to analyse human serum peptides and
proteins [41,42]. Linear MALDI-TOF MS allows the analysis of large intact proteins
while reflectron MALDI-TOF MS is usually employed to analyse endogenous serum
peptides or proteolytic fragments from larger proteins.
Fourier Transform Ion Cyclotron Resonance (FTICR) mass spectrometers. The basis
of an FTICR mass spectrometer consists of an analyzer (ICR) cell that resides in a strong,
homogeneous magnetic field. At present, for MS-purposes magnets are commercially
available with field strength up to 15 tesla, and development of 21T systems is on-going
[43]. In an FTICR experiment, ions are trapped in an ICR cell using a front- and
back-trapping electrode, followed by detection of their cyclotron frequency by two opposite
detection electrodes in combination with two opposite excitation electrodes.
Time schedules are crucial for proper control of any FTICR-MS or MS-MS experiment,
consisting of ion quench/ion introduction, ion selection, ion dissociation, ion excitation,
and ion detection [44,45].
Ion cyclotron movement, as a result of Lorentz force, is measured as a frequency that
correlates with ion mass-to-charge ratio (i.e.,m/z) and the field strength according to the
Introduction
19
ϖc= (qB0) / m
In this initial condition, the ion cyclotron orbital phases are random and the cyclotron
radius is too small to induce a detectable image current on the detection plates. Thus, the
ions are accelerated to wider cyclotron orbits applying a uniform electric field
(excitation), directed perpendicular to the magnetic field direction, and rotating at the
cyclotron frequency (typically >10 kHz) of ions of a particular m/z-value (i.e. resonant).
The final cyclotron radius is directly proportional to both the electric field strength and the
time of the irradiation and is inversely proportional to the magnetic field strength.
The excitation process leads to the spatial coherency of the ions making their detection
possible. Ions of a wide m/z-range can be simultaneously excited using a broadband
waveform. The image current generated after the excitation of the ions, decays in time and
is generally referred to free induction decay (FID) transient. The FID resulting from the
detection of ions with different m/z-values is a superposition of sine waves. At this point,
Fourier transform is applied to resolve the FID and generate a frequency-domain spectrum
that is further converted into a mass spectrum. The strength of the magnetic field affects
many spectral characteristics. For example, the mass resolving power and mass
measurement accuracy increase linearly with increasing field strength while the maximum
number of ions that can be confined without coalescence of their FTICR signals increases
quadratically.
FTICR analysers have been used in combination with both MALDI and ESI
sources to analyse human serum peptides and proteins [46,47]. The main benefits of using
this technology are (a) the ultrahigh mass resolving power that allows the analysis of large
20
precision that allow a more reliable identification of the detected species; (c) a wide
dynamic range that is favourable for the detection of low abundant components.
Peptide and protein profiling of human serum samples. Like other components in
human serum, proteins may be used for the prognosis, diagnosis and monitoring of a
certain disease (e.g. cancer, diabetes, atherosclerosis). In this context, both automated and
high-throughput sample preparation methods and MS approaches have been developed to
measure protein levels in biological samples with the analytical robustness required for
clinical application [48]. Driven by the urgent need of biomarkers for the early detection
of severe diseases such as cancer, MS is on its way to mature into a clinical diagnostic
tool [49]. Numerous peptide and protein profiling studies by either SELDI- or
MALDI-TOF-MS approaches have been reported for the discovery of disease-specific human
serum signatures aiming for clinical diagnostics. Many of these studies were motivated by
the early success published by Petricoin and co-workers in 2002. These investigators
reported a serum proteomics pattern generated by RPC16 SELDI-TOF-MS that allowed
the detection of ovarian cancer and the discrimination between healthy women and
patients [50]. And indeed, over the last ten years, more disease-specific peptide and
protein profiles related to other diseases could be identified through similar SELDI- or
MALDI-TOF-MS methods [51,52]. However, also drawbacks of this approach became
clear. First, only high-abundance serum proteins and their proteolytic fragments
(i.e. peptides) were identified in the profiles [41]. Second, the identified discriminant
proteins were not cancer-specific and in many cases appeared to be involved in the acute
phase and inflammatory response [53,54]. Third, the standardization of sample collection
Introduction
21 As a consequence, none of proposed serum peptide signatures has been approved for
routine diagnostics yet.
Due to the biological variability in human serum samples and the resulting
proteomics profiles profiling studies require a high number of samples for analysis and
evaluation to obtain reliable statistical results. Time-consuming or tedious sample
preparation procedures (e.g. gel electrophoresis) and MS methods (e.g. LC-MS/MS) are
not suitable for high-throughput analysis. Therefore, a robotic platform for sample
clean-up and separation of complex protein mixtures is needed that provides a high degree of
standardization and consequently low analytical variation. Solid-phase extraction (SPE)
has been successfully implemented using ZipTip pipette tips, cartridges or magnetic
beads in automated sample preparation protocols for MS-based proteomics. In particular,
the use of (disposable) magnetic beads (MBs)-based procedures leads to a fast and robust
fractionation of human serum proteins. Proteins can be separated with high selectivity
using different chemically functionalized beads such as reversed-phase material (RPC4,
RPC8, RPC18). As an alternative, functionalized cartridges can be applied: these have a
higher loadability (i.e. quantity of proteins that can be processed) thus providing larger
fraction volumes suitable for further protein separation or (additional) direct infusion
experiments.
Proteomic profiling studies are based on the comparison of hundreds (or even
thousands) of signatures detected in hundreds of samples obtained from different
individuals. After the acquisition of the MS profiles a series of data processing steps is
required to extract the information needed for statistical analysis. These steps include a
baseline correction, smoothing, peak-picking, internal calibration or peak alignment, and
22
Data processing becomes more robust with improved quality of the profiles. Moreover,
high quality data lead to a more reliable statistical analysis. In this context, resolving
power, dynamic range, mass measurement accuracy and precision of the mass analyser are
parameters that define the quality of the MS spectrum. The first proteomic profiling
studies were performed on low resolution linear TOF mass analysers that detected
peptides and proteins as broad peaks in a wide m/z-range. Later, high resolution reflectron
mode TOF analysers were used to achieve isotopic resolution, however at a narrower
m/z-range. Furthermore, the accuracy of SELDI/MALDI-TOF mass measurements is
affected by the heterogeneity of the crystalized sample (i.e. chemical matrix and analytes)
and both an external and an internal calibration (or alignment) are needed for robust
comparisons of the profiles. Such differences in “height” of the sample on the MALDI
target plate are less of a problem when applying MALDI-FTICR MS. Nevertheless,
probably primarily due to the costs of this high-end platform, it has been rarely used for
profiling of human serum peptides and proteins. However, following the latest
developments of FTICR-MS (e.g. magnet production, more efficient ion transmission, cell
improvements), the use of this technology has grown and the beneficial aspects have also
become clear in clinical proteomics. Especially the ultrahigh resolution and the sub-ppm
mass accuracy that are achieved with FTICR mass analysers have shown to be particularly
useful for the identification of intact proteins and the localization of PTMs.
Aim of this thesis. In this thesis, the development and application of novel
MALDI-FTICR-MS methods are described. These methods were used for the acquisition of
ultrahigh resolution profiles containing (highly) abundant endogenous serum peptides and
MALDI-Introduction
23 FTICR-MS results in a more robust and comprehensive analysis of the human serum
degradome. This allows the identification of for instance cancer-related biomarker
signatures, as is exemplified with serum samples from a pancreatic cancer cohort.
The thus obtained proteomic signatures could be used for the accurate discrimination of
healthy from diseased individuals. The developed MALDI-FTICR-MS methods were
further applied to characterize small proteins fractionated by high-throughput and
automated sample preparation protocols. Finally, identification of (large) polypeptides is
24
REFERENCES
1. Haddad, S. I.; Khairallah, A. A. A forgotten chapter in the history of the circulatioin of the blood. Ann. Surg. 1936, 104 (1), 1-8.
2. Hajdu, S. I. A note from history: The discovery of blood cells. Ann. Clin Lab Sci. 2003, 33 (2), 237-238.
3. Alfred Donné De l'origine des globules du sang de leur mode de formation et leur fin. Comptes rendus de l'Académie des Sciences 1842, (14), 366-368.
4. Gabriel Andral Essai d'Hématologie Pathologique. Fortin,Masson & Cie, Paris 1843.
5. William Addison Experimental and Practical Researches on Inflammation and on the Origin and Nature of Tubercles of the Lung. J Churchill, London 1843.
6. Zini, R.; Riant, P.; Barre, J.; Tillement, J. P. Disease-induced variations in plasma protein levels. Implications for drug dosage regimens (Part I). Clin Pharmacokinet. 1990, 19 (2), 147-159.
7. Zini, R.; Riant, P.; Barre, J.; Tillement, J. P. Disease-induced variations in plasma protein levels. Implications for drug dosage regimens (Part II). Clin Pharmacokinet. 1990, 19 (3), 218-229.
8. Zubarev, R. A. The challenge of the proteome dynamic range and its implications for in-depth proteomics. PROTEOMICS 2013, 13 (5), 723-726.
9. Tu, C.; Rudnick, P. A.; Martinez, M. Y.; Cheek, K. L.; Stein, S. E.; Slebos, R. J. C.; Liebler, D. C. Depletion of Abundant Plasma Proteins and
Limitations of Plasma Proteomics. J. Proteome Res. 2010, 9 (10), 4982-4991.
10. Hartley, P. The Determination of the Composition of the Different Proteins of Ox and Horse Serum by the Method of Van Slyke. Biochem. J. 1914, 8 (5), 541-552.
11. Rabilloud, T.; Carpentier, G.; Tarroux, P. Improvement and simplification of low-background silver staining of proteins by using sodium dithionite. ELECTROPHORESIS 1988, 9 (6), 288-291.
12. Shevchenko, A.; Wilm, M.; Vorm, O.; Mann, M. Mass Spectrometric Sequencing of Proteins from Silver-Stained Polyacrylamide Gels. Anal. Chem. 1996, 68 (5), 850-858.
13. Håkansson, P.; Kamensky, I.; Sundqvist, B.; Fohlman, J.; Peterson, P.; McNeal, C. J.; Macfarlane, R. D. Iodine-127-plasma desorption mass spectrometry of insulin. J. Am. Chem. Soc. 1982, 104 (10), 2948-2949.
14. Heerma, W.; Kamerling, J. P.; Slotboom, A. J.; van Scharrenburg, G. J. M.; Green, B. N.; Lewis, I. A. S. Fast atom bombardment and collisional activation mass spectrometry of a heptapeptide. Biol. Mass Spectrom. 1983, 10 (1), 13-16.
15. Roepstorff, P.; Fohlman, J. Proposal for a common nomenclature for sequence ions in mass spectra of peptides. Biomed. Mass Spectrom. 1984, 11 (11), 601.
16. Hunt, D. F.; Yates, J. R.; Shabanowitz, J.; Winston, S.; Hauer, C. R. Protein sequencing by tandem mass spectrometry. Proc. Natl. Acad. Sci. 1986, 83 (17), 6233-6237.
Introduction
25
18. James, P. Protein identification in the post-genome era: the rapid rise of proteomics. Q. Rev Biophys. 1997, 30 (4), 279-331.
19. Ferguson, P. L.; Smith, R. D. Proteome analysis by mass spectrometry. Annu. Rev Biophys. Biomol. Struct. 2003, 32, 399-424.
20. Pappin, D. J. C.; Hojrup, P.; Bleasby, A. J. Rapid identification of proteins by peptide-mass fingerprinting. Curr. Biol. 1993, 3 (6), 327-332.
21. Doerr, A. Mass spectrometry-based targeted proteomics. Nat. Methods 2013, 10 (1), 23.
22. Jmeian, Y.; El, R. Z. Liquid-phase-based separation systems for depletion, prefractionation and enrichment of proteins in biological fluids for in-depth proteomics analysis. Electrophoresis 2009, 30 (1), 249-261.
23. Smith, R. D.; Loo, J. A.; Loo, R. R. O.; Busman, M.; Udseth, H. R. Principles and practice of electrospray ionization-mass spectrometry for large polypeptides and proteins. Mass Spectrom. Rev. 1991, 10 (5), 359-452.
24. Thakur, S. S.; Geiger, T.; Chatterjee, B.; Bandilla, P.; Fröhlich, F.; Cox, J.; Mann, M. Deep and Highly Sensitive Proteome Coverage by LC-MS/MS Without Prefractionation. Mol. Cell. Proteomics 2011, 10 (8).
25. Whitelegge, J. Intact protein mass spectrometry and top-down proteomics. Expert. Rev Proteomics 2013, 10 (2), 127-129.
26. Tran, J. C.; Zamdborg, L.; Ahlf, D. R.; Lee, J. E.; Catherman, A. D.; Durbin, K. R.; Tipton, J. D.; Vellaichamy, A.; Kellie, J. F.; Li, M.; Wu, C.; Sweet, S. M.; Early, B. P.; Siuti, N.; LeDuc, R. D.; Compton, P. D.; Thomas, P. M.; Kelleher, N. L. Mapping intact protein isoforms in discovery mode using top-down proteomics. Nature 2011, 480 (7376), 254-258.
27. Ansong, C.; Wu, S.; Meng, D.; Liu, X.; Brewer, H. M.; Deatherage Kaiser, B. L.; Nakayasu, E. S.; Cort, J. R.; Pevzner, P.; Smith, R. D.; Heffron, F.; Adkins, J. N.; Pasa-Tolic, L. Top-down proteomics reveals a unique protein S-thiolation switch in Salmonella Typhimurium in response to infection-like conditions. Proc. Natl. Acad. Sci. USA 2013, 110 (25), 10153-10158.
28. Smith, L. M.; Kelleher, N. L. Proteoform: a single term describing protein complexity. Nat. Methods 2013, 10 (3), 186-187.
29. Michalski, A.; Damoc, E.; Lange, O.; Denisov, E.; Nolting, D.; Müller, M.; Viner, R.; Schwartz, J.; Remes, P.; Belford, M.; Dunyach, J. J.; Cox, J.; Horning, S.; Mann, M.; Makarov, A. Ultra High Resolution Linear Ion Trap Orbitrap Mass Spectrometer (Orbitrap Elite) Facilitates Top Down LC MS/MS and Versatile Peptide Fragmentation Modes. Mol. Cell. Proteomics 2012, 11 (3).
30. Jones, A. W.; Cooper, H. J. Dissociation techniques in mass spectrometry-based proteomics. Analyst 2011, 136 (17), 3419-3429.
31. Kim, M. S.; Pandey, A. Electron transfer dissociation mass spectrometry in proteomics. PROTEOMICS 2012, 12 (4-5), 530-542.
32. Steen, H.; Mann, M. The abc's (and xyz's) of peptide sequencing. Nat. Rev. Mol. Cell Biol. 2004, 5 (9), 699-711.
33. Mikesh, L. M.; Ueberheide, B.; Chi, A.; Coon, J. J.; Syka, J. E.; Shabanowitz, J.; Hunt, D. F. The utility of ETD mass spectrometry in proteomic analysis. Biochim. Biophys. Acta 2006, 1764 (12), 1811-1822.
26
Dissociation Mass Spectrometry. Anal. Chem. 2011, 83 (23), 8919-8927.
35. Frese, C. K.; Altelaar, A. F. M.; Hennrich, M. L.; Nolting, D.; Zeller, M.; Griep-Raming, J.; Heck, A. J. R.; Mohammed, S. Improved Peptide Identification by Targeted Fragmentation Using CID, HCD and ETD on an LTQ-Orbitrap Velos. J. Proteome Res. 2011, 10 (5), 2377-2388.
36. Shaw, J.; Madsen, J.; Xu, H.; Brodbelt, J. Systematic Comparison of Ultraviolet Photodissociation and Electron Transfer Dissociation for Peptide Anion Characterization. J. Am. Soc. Mass Spectrom. 2012, 23 (10), 1707-1715.
37. Cooper, H. J.; Håkansson, K.; Marshall, A. G. The role of electron capture dissociation in biomolecular analysis. Mass Spectrom. Rev. 2005, 24 (2), 201-222.
38. Hillenkamp, F.; Karas, M. Mass spectrometry of peptides and proteins by matrix-assisted ultraviolet laser desorption/ionization. In Methods in Enzymology Mass Spectrometry, Volume 193 ed.; James, A. M., Ed.; Academic Press: 1990; pp 280-295.
39. Merchant, M.; Weinberger, S. R. Recent advancements in surface-enhanced laser desorption/ionization-time of flight-mass spectrometry. Electrophoresis 2000, 21 (6), 1164-1177.
40. Nicolardi, S.; Palmblad, M.; Dalebout, H.; Bladergroen, M.; Tollenaar, R. A. E. M.; Deelder, A. M.; van der Burgt, Y. E. M. Quality control based on isotopic distributions for high-throughput
MALDI-TOF and MALDI-FTICR serum peptide profiling. J. Am. Soc. Mass Spectrom. 2010, 21 (9), 1515-1525.
41. Hortin, G. L. The MALDI-TOF mass spectrometric view of the plasma proteome and peptidome. Clin. Chem. 2006, 52 (7), 1223-1237.
42. Tucholska, M.; Florentinus, A.; Williams, D.; Marshall, J. G. The endogenous peptides of normal human serum extracted from the acetonitrile-insoluble precipitate using modified aqueous buffer with analysis by LC-ESI-Paul ion trap and Qq-TOF. J. Proteomics 2010, 73 (6), 1254-1269.
43. Kelleher, N.; Pa+ía-Toli-ç, L. 25th ASMS Sanibel Conference on Top Down Mass Spectrometry. J. Am. Soc. Mass Spectrom. 2013, 24 (7), 983-985.
44. Amster, I. J. Fourier Transform Mass Spectrometry. J. Mass Spectrom. 1996, 31 (12), 1325-1337.
45. Marshall, A. G.; Hendrickson, C. L.; Jackson, G. S. Fourier transform ion cyclotron resonance mass spectrometry: A primer. Mass Spectrom. Rev. 1998, 17 (1), 1-35.
46. Palmblad, M.; van der Burgt, Y. E. M.; Mostovenko, E.; Dalebout, H.; Deelder, A. M. A novel mass spectrometry cluster for high-throughput quantitative proteomics. J. Am. Soc. Mass Spectrom. 2010, 21 (6), 1002-1011.
47. Nicolardi, S.; Palmblad, M.; Hensbergen, P. J.; Tollenaar, R. A. E. M.; Deelder, A. M.; van der Burgt, Y. E. M. Precision profiling and
identification of human
serum peptides using Fourier transform ion cyclotron resonance mass spectrometry. Rapid Commun. Mass Spectrom. 2011, 25 (23), 3457-3463.
Introduction
27
49. Palmblad, M.; Tiss, A.; Cramer, R. Mass spectrometry in clinical proteomics - from the present to the future. PROTEOMICS - Clinical Applications 2009, 3 (1), 6-17.
50. Petricoin III, E. F.; Ardekani, A. M.; Hitt, B. A.; Levine, P. J.; Fusaro, V. A.; Steinberg, S. M.; Mills, G. B.; Simone, C.; Fishman, D. A.; Kohn, E. C.; Liotta, L. A. Use of proteomic patterns in serum to identify ovarian cancer. The Lancet 2002, 359 (9306), 572-577.
51. Albrethsen, J. The first decade of MALDI protein profiling: a lesson in translational biomarker research. J. Proteomics 2011, 74 (6), 765-773.
52. Karpova, M. A.; Moshkovskii, S. A.; Toropygin, I. Y.; Archakov, A. I. Cancer-specific
MALDI-TOF profiles of blood serum and plasma: Biological meaning and perspectives. J. Proteomics 2010, 73 (3), 537-551.
53. Le, L.; Chi, K.; Tyldesley, S.; Flibotte, S.; Diamond, D. L.; Kuzyk, M. A.; Sadar, M. D. Identification of Serum Amyloid A as a Biomarker to Distinguish Prostate Cancer Patients with Bone Lesions. Clin. Chem. 2005, 51 (4), 695-707.
Chapter
1
Standardized and automated solid-phase
extraction procedures for high-throughput
proteomics of body fluids
Bladergroen M. R., Derks R. J.E.,
Nicolardi S., de Visser B., van Berloo S.,
van der Burgt Y. E. M., Deelder A. M.
30
ABSTRACT
Chapter 1
31
INTRODUCTION
Proteomics has matured into a standard technology and with that interest has broadened from studying fundamental biological processes to screening large patient cohorts in clinical research [1]. Improved and more detailed genetic knowledge of various biological processes or organisms is now widely used in proteomics research [2;3]. The last decade sample throughput in MS-based proteomics has increased enormously due to the development of highly automated and robust mass spectrometers and improved speed in data handling and -processing. As a consequence, the analytical methods that involve peptide- and protein profiling of body fluids require high-throughput approaches. It should be stressed that sample workup is an essential part in all proteomics workflows because of the large complexity of any biological material [4-6]. In order to handle sample complexity and obtain full coverage multidimensional separations have been reported [7;8]. However, such approaches are not feasible for large screening studies taking into account time, costs and robustness. Most biomarker discovery studies that have reported on candidate peptides and proteins that were found to correlate with the presence and/or a stage of a certain disease were based on relatively small numbers of samples. Not surprisingly, a large majority of these discoveries could not be validated and did not make it into a diagnostic clinical assay [9;10]. Thus a high-capacity pipeline is needed to perform screening studies of clinical cohorts containing at least 1,000 different individuals [11]. Such a high-throughput workflow consists of robust and relatively fast sample processing and preparation (resulting in a reduced complexity) as well as automated MS [1;12]. Moreover, high-end MS in combination with specific sample workup allows mapping of modifications such as glycosylation and phosphorylation [13;14].
32
of these profiles allows the classification of individuals into groups (e.g. healthy versus diseased). In general, these methods consist of incubation-, washing- and elution steps. In addition, a protocol is described that involves spotting of samples onto a MALDI-target plate for analysis on for instance a MALDI time-of-flight (TOF) or MALDI Fourier Transform Ion Cyclotron Resonance (FTICR) system. We have chosen to implement the first application on a Hamilton liquid-handling workstation. Advantages of this robotic system are the flexibility in deck layout, user-friendly programming software and the possibility to include in-house developed and third party consumables or equipment. The second application has been implemented on a SPARK Symbiosis SPE system, specifically adapted to increase sample throughput. The advantages of this system are the availability of a wide range of different cartridges and the ability to keep the samples at 4°C during sample storage and after elution.
The general availability of functionalized magnetic beads for peptide- or protein profiling is decreasing, or has even been discontinued in the case of (polymeric) reversed-phase (RP) C18-beads. Other players have entered the market by supplying magnetic beads based on silica material that are currently under investigation in our group. Furthermore, the magnetic bead protocol results in peptide- or protein eluates that are “optimized” for MALDI-MS measurements while in some instances direct infusion ESI-MS is the preferred ESI-MS method, e.g. to obtain multiply charged species that are more suitable for MS/MS-fragmentation. For these reasons an alternative SPE system was considered. This paper describes the implementation and comparison of both systems.
MATERIALS AND METHODS
Chapter 1
33 acetone:ethanol 1:2. Magnets were purchased from Webcraft GmbH (http://www.supermagnete.de/; Gottmadingen, Germany).
Serum samples. Serum samples were obtained from healthy volunteers at the Leiden University Medical Center (LUMC). Samples were collected, anonymized and processed according to a standardized protocol: all blood samples were drawn by antecubital venapuncture while the individuals were seated and had not been fasting. The samples were drawn in an 8.5 cc Serum Separator Vacutainer Tube (BD Diagnostics, Plymouth, UK) and within maximally 4 hours centrifuged at room temperature at 1000 g for 10
minutes. The samples were kept in sterile 500 μl barcode labeled polypropylene tubes
(TrakMate, Matrix TechCorp.) at -80ºC until further use.
SPE using magnetic beads. For each (biological) sample fresh magnetic beads were used. The RPC18-beads were first activated by a three-step washing with a 0.1% TFA solution. Then, the samples were added to the activated beads and incubated for 5 minutes at room temperature. The beads were washed again three times with 0.1% TFA and peptides were eluted with a 1:1 mixture of water and acetonitrile.
For the application of WCX-beads, the samples were added directly to the beads together with binding buffer since no activation was needed. The beads were washed three times with washing buffer and eluted with a high pH elution buffer, which was prepared as described in ‘Consumables and reagents’. Thus obtained eluates were mixed with stabilization buffer to acidify the sample.
Two microliters of each (stabilized) eluate were mixed with 15 microliters of a MALDI matrix solution in a 384-well PCR plate. Then, 1 microliter of this mixture was spotted in quadruplicate onto a MALDI-target plate (Bruker Daltonics).
34
with 100 µL 50% acetonitrile / 0.1% acetic acid. After elution the tubing was rinsed with 500 µL wash solvent before proceeding to the next sample.
Target plate spotting and mass spectrometry. The protocol for spotting onto a MALDI-target plate is part of the other two procedures described above. The implementation will be described in the Results and Discussion section. MALDI-TOF experiments were performed on an UltraFlex II (Bruker Daltonics) either operating in positive reflectron mode in the m/z-range of 600–4,000 or in positive linear mode in the m/z-range of 1000-11000. The spectra were acquired using FlexControl software ver. 3.0 (Bruker Daltonics). A Smartbeam 200 Hz solidstate laser, set at a frequency of 100 Hz, was used for ionization. A profile, or summed spectrum, was obtained for each MALDI-spot by adding 20 spectra of 60 laser shots each at different rasters. To this end, FlexControl software decided on-the-fly whether or not a scan was used for the summed spectrum. For reflectron mode acquisitions, a resolution higher than 2,000 was required. Peaks were detected using the SNAP centroid peak detection algorithm with signal-to-noise threshold of 1 and a “TopHat” baseline subtraction. All mass scans not fitting these criteria were excluded. For linear mode acquisitions, a resolution higher than 100 was required and peaks were detected using the centroid peak detection algorithm with signal-to-noise threshold of 2 and a “TopHat” baseline subtraction. The measurement of a MALDI spot was finished when 1200 laser shots had been summed in one profile. FlexAnalysis Software 3.0 (Bruker Daltonics) was used for visualisation and data processing.
Chapter 1
35 excitation power was 28% with a pulse time of 20.0 µs. MALDI-FTICR profiles were obtained from the same target plate that had been used for the MALDI-TOF acquisitions.
RESULTS AND DISCUSSIONS
Implementation of SPE using magnetic beads on the robotic liquid handling system. The robotic system for automated liquid handling is built up from three units (Figure 1A). Currently, this system is used for (1) in-gel and in-solution digestions, (2) desalting of samples using ziptips, and (3) magnetic bead based SPE for peptide- and protein profiling. In this study data is reported from the third application, which involves the unit depicted on the right-hand side of Figure 1A. This unit consists of a two-arm Hamilton STARplus robotic workstation that is equipped with eight independently controlled 1 ml pipetting channels, a 300 µL 96 channel pipetting head, an 8+1 channel nanospotter, a 96-well magnet, a vacuum system, a heated/cooled shaker, a temperature controlled carrier and a plate CORE-gripper. Description of the second and third unit (left-hand side and middle of Figure 1A) is outside the scope of this work.
For the application of magnetic bead based SPE it was necessary to develop specific labware that was not readily available from the supplier. For example, to prevent evaporation of volatile solvents from the supplied open reagent containers, special containers have been implemented with automated sliding lids to open and close on demand. In addition, a wireless and non-fixed mini-camera that can be picked-up by one of the eight 1 ml pipetting channels has been implemented for quality control purposes. Finally, a specific magnet plate incorporating 96 individual magnets to accommodate 96-well plates was in-house developed. With this magnet different sample workup steps can be performed as will be described in the following paragraph.
36
The various protocols for the different bead types have an identical workflow in terms of “order of events”, however slightly differ with regard to the number of activation cycles, wash cycles and incubation times and the specific buffers used. All protocols for the extraction procedures provided by the manufacturer for manual processing were adapted and further optimized to allow implementation on the robotic system. Initially, these optimizations have been described on a previous 8-channel liquid handling platform (http://www.hamiltonrobotics.com/fileadmin/user_upload/prodb/app_notes/Proteomics/B R-0504-01_PeptideExtraction_for_ProteinProfiling_01.pdf). However, for the current platform these protocols were further adjusted to obtain an even higher throughput. In short, each protocol consists of a binding step, several washing steps and an elution step. Optionally there might be an activation and/or equilibration step, and a stabilization step of the eluate. All eluates are collected in a fresh PCR-plate and then spotted in quadruplicate onto a target plate for further analysis by TOF-MS and/or MALDI-FTICR-MS. In order to reduce loss of magnetic beads to a minimum PCR-plates were used throughout the protocol. These plates allow for maximum aspiration of solvents with a minimal residual volume in the wells and minimal disturbance of the magnetic bead pellet through a smaller surface to height ratio in comparison with other types of microtitration plates.
Chapter 1
37 The here described SPE-protocols based on magnetic bead fractionation were implemented in the year 2008. Since then, more than 15,000 different serum samples have been processed in biomarker screening studies [17-23]. These studies included statistical validation tests. From the results of the 96-channel system it was concluded that the reproducibility of the peptide- and protein profiles obtained from MALDI-TOF-MS was better than in the case of manual sample processing.
Typically, the coefficient of variation (CV) of the peak areas in the profiles was on average 15% when processing biological serum sample replicates, and for some specific peptides even below 5%. Note that this value results from a combination of variation in the SPE-procedure itself, the MALDI-spotting and MALDI-TOF measurement. This aspect is further discussed in the last paragraph of this section (comparison of beads and cartridges).
Implementation of online SPE using cartridges on the Symbiosis. Basically, a Symbiosis system consists of one autosampler (Reliance), one High Pressure Dispenser (HPD) and one Automated Cartridge Exchange (ACE) unit. In Figure 1C, the setup of our customized Symbiosis system is shown. In this setup three Reliance systems are combined with two HPD units, each equipped with two syringes, and two ACE units. Two Reliance systems are used as an autosampler (left- and right-hand side of Figure 1C) and the third Reliance acts as a fraction collector (middle of Figure 1C). The fraction collector is reached by both systems in an alternating way: when one system is in the “load position”,
Chapter 1
39 Figure 1. Systems setup. Picture of both sample preparation systems, consisting of a Hamilton Microlab® STAR, a Hamilton SWAP, an automated CHRIST vacuum centrifuge and a Hamilton Microlab® STARplus (A), a photo and schematic representation (B) of the Microlab® STARplus deck layout used for magnetic bead based protein profiling and a photo with flow-scheme (C) of the Symbiosis system. To carry out a protocol on the Microlab® STARplus with optimal use of deck space and without user-intervention stacks of pipette tips are needed. This storage of tips on the deck is further indicated as “Tip-stacking” (Ts) positions. To allow for tip pickup within a certain protocol one rack of tips is initially transferred to a so-called “Tip-working” (Tw) position. TCC: Temperature Controlled Carrier; Tw10: tip work sequence 10 microliter tips; Tw50: tip work sequence 50 microliter tips; Tw300: tip work sequence 300 microliter tips; Tw1000: tip work sequence 1000 microliter tips; Ts10: tip stack 10 microliter tips; Ts50: tip stack 50 microliter tips; Ts300: tip stack 300 microliter Tips; Tmix: spare position for all tip types to be used by 96-channel head; Tr1, Tr2, Tr3: empty racks for tips to be re-used; MB: Magnetic beads; WP: working plate; MP: mixing plate for mixing sample and MALDI-matrix; SP: sample plate; StP: eluent storage plate; SLC: Sliding Lid Containers for volatile solvents; MALDI: MALDI-target plate; RV: reagent vessels; WT: waste and tool carrier. Tools include CORE-gripper and CORE-camera (CAM); SN: service carrier nano-head for washing and waste.
40
Figure 2 (inset) shows a typical FTICR-MS profile of SPE eluates, such as obtained with samples processed with the nine cartridges mentioned above. Based on the number of features (peaks) in the spectrum and the total signal intensity in both the low- and the high-mass range, the C8 EC-SE, C18-HD and C18-EC cartridges performed best and to a lesser extent also the C2-SE in the high-mass range. Preliminary results also indicated that the eluates from the C18-EC cartridges performed best in direct infusion FTICR-MS experiments, making these cartridges the type of choice for future experiments.
Chapter 1
41 Figure 2. Repeatability and Reprocucibility of the cartridge-based SPE method. Peptides used for this analysis are observed as [M+H]+ at monoisotopic m/z values: 1206.6 =
42
Implementation of a MALDI-target plate spotting protocol on the robotic liquid handling system. A spotting protocol for MALDI plates has been developed previously (http://www.hamiltonrobotics.com/fileadmin/user_upload/prodb/app_notes/
Proteomics/BR-0302-01_MALDITargetSpot.pdf); however this protocol included a washing step on the MALDI target. Since our procedures result in purified samples such a washing step was not needed anymore. To this end, we compared two methods of matrix and sample deposition on the MALDI-target: 1) Premixing sample with matrix in a 384-well plate and 2) deposition of sample on a MALDI target plate followed by application of matrix with the nanospotter. The two methods differ in sample to matrix ratio and the final concentration of organic solvent. For the first method the sample to matrix ratio was 2:15 and the organic solvent concentration was 94% while for the second method the sample to matrix ratio was 10:4 and the organic solvent concentration was 64%, when calculated for a sample composition containing 50% acetonitrile as is the case for most of the applications described in this paper. This ratio is of influence on the drying speed and crystal formation. The premixing method was found to perform consistently better than the nanospotter method. In principle it would be possible to reverse the second method (apply sample instead of matrix with the nanospotter). This would change the sample to matrix ratio and the final organic solvent concentration, but processing times would increase dramatically. Moreover, to prevent sample carry-over disposable tips are to be preferred over washable tips. Depending on the method applied before spotting, using only a single spot for each sample will not always result in a good spectrum.
Using α-cyanohydroxycinnamic acid (CHCA) as the MALDI matrix and a
Bruker AnchorchipTM an optimal spot is a very thin uniform layer which is slightly larger
Chapter 1
43 Figure 3. Examples of MALDI spots. (A) Optimal spot: thin homogeneous matrix layer, which is larger than anchor. (B) Small spots almost the size of the anchor, due to absence or (very) low concentration of analytes. (C) Brown spots: presence of magnetic beads due to incomplete separation of magnetic beads from eluate. (D) One very large spot due to the presence of a droplet on the tip during spotting. Also visible are magnetic beads (brown color) and an inhomogeneous matrix layer due to changed evaporation conditions (lower organic solvent concentration).
44
Theoretically it would be possible to check the quality of the spots and the envisaged quality of the spectra by imaging and automated evaluation of the images. For this purpose it would be possible to use a camera mounted on the Hamilton STARplus, as described in an application note on the Hamilton website (http://www.hamiltonrobotics.com/fileadmin/user_upload/prodb/app_notes/Genomics/BR -0506-01-EasyPick_ColonyPicking.pdf). However, this is a serious investment. Therefore, an affordable system was developed which, in addition, is not fixed to the robot, but is placed on the deck as separate labware. To implement this, a commercially available wireless mini camera was mounted in a frame, together with a battery and LEDs for illumination. To grab the camera the Hamilton’s CORE technology was used. For this purpose a CORE head, similar to a tip-head, was also included in the frame. Furthermore, a switch was integrated which activates the camera when this is picked up and stops it when placed back on the deck (Figure 4). So far, no software is available which allows automated image evaluation, but we foresee that general software for this purpose will become available in the future.
Chapter 1
45 Figure 5. Comparison of magnetic bead-based SPE with cartridge-based SPE. Spectra (A) and average normalized intensities (B). Peptides used for this analysis are the same as in Figure 2.
extent by the cartridges, while m/z 2021.2 and 3156.7 were isolated in higher amounts by the magnetic beads. Similarly, in the high mass region differences were observed for the signal at m/z 5905.4. From Figure 5b it becomes clear that the peak area CVs are often similar for both the magnetic beads and the cartridges. Note that for some of the peptides the two workup protocols yield results with different efficiency and reproducibility. For these peptides the less efficient method usually exhibits the largest variation. It is obvious that biologically relevant differences should be considered with regard to the determined CV of each specific peptide.
46
magnetic beads. Nevertheless, for some species large differences in the absolute amounts (ratios) are observed. Whether or not these intensity differences have an effect on classification of samples of specific patient cohorts is currently under investigation.
CONCLUSIONS
The implementation of the sample preparation processes on automated liquid handling platforms, as described in this paper, allows to both speed up the analysis of a large number of samples but also to eliminate errors. Apart from the throughput, the latter aspect is essential for application in clinical diagnosis where standardization and quality control (QC) are pivotal in meeting good laboratory practice (GLP) requirements [25]. In combination with the previously described automated MALDI-target loading and the high-throughput MS-based methods developed in our group this workflow is a next step towards implementation of proteomics in a clinical setting [26;27].
Chapter 1
47
SUPPLEMENTAL INFORMATION
A movie of the CORE-Camera in action can be found on http://www.lumc.nl/con/1040, then navigate to ‘biomolecular mass spectrometry/Mass spectrometry-based clinical proteomics/methods’.
ACKNOWLEDGEMENTS
48
REFERENCES
[1] Nilsson T, Mann M, Aebersold R, Yates JR, III, Bairoch A, Bergeron JJ. Mass spectrometry in high-throughput proteomics: ready for the big time. Nat Methods 2010;7:681-5.
[2] Brunner E, Ahrens CH, Mohanty S, Baetschmann H, Loevenich S, Potthast F, Deutsch EW, Panse C, de LU, Rinner O, Lee H, Pedrioli PG, Malmstrom J, Koehler K, Schrimpf S, Krijgsveld J, Kregenow F, Heck AJ, Hafen E, Schlapbach R, Aebersold R. A high-quality catalog of the Drosophila melanogaster proteome. Nat Biotechnol 2007;25:576-83.
[3] Nedelkov D, Kiernan UA, Niederkofler EE, Tubbs KA, Nelson RW. Investigating diversity in human plasma proteins. Proc Natl Acad Sci U S A 2005;102:10852-7.
[4] Anderson NL, Anderson NG. The human plasma proteome: history, character, and diagnostic prospects. Mol Cell Proteomics 2002;1:845-67.
[5] Domon B, Aebersold R. Mass spectrometry and protein analysis. Science 2006;312:212-7.
[6] Beretta L. Proteomics from the clinical perspective: many hopes and much debate. Nat Methods 2007;4:785-6.
[7] Jacobs JM, Adkins JN, Qian WJ, Liu T, Shen Y, Camp DG, Smith RD. Utilizing human blood plasma for proteomic biomarker discovery. Journal of Proteome Research 2005;4:1073-85.
[8] Washburn MP, Wolters D, Yates JR, III. Large-scale analysis of the yeast proteome by multidimensional protein identification technology. Nat Biotechnol 2001;19:242-7.
[9] Mitchell P. Proteomics retrenches. Nat Biotechnol 2010;28:665-70.
[10] Surinova S, Schiess R, Huttenhain R, Cerciello F, Wollscheid B, Aebersold R. On the development of plasma protein biomarkers. J Proteome Res 2011;10:5-16.
[11] Anderson NL. Counting the proteins in plasma. Clin Chem 2010;56:1775-6.
[12] Aebersold R, Mann M. Mass spectrometry-based proteomics. Nature 2003;422:198-207.
[13] Pinkse MW, Uitto PM, Hilhorst MJ, Ooms B, Heck AJ. Selective isolation at the femtomole level of phosphopeptides from proteolytic digests using 2D-NanoLC-ESI-MS/MS and titanium oxide precolumns. Anal Chem 2004;76:3935-43.
[14] Wuhrer M, Koeleman CA, Hokke CH, Deelder AM. Protein glycosylation analyzed by normal-phase nano-liquid chromatography--mass spectrometry of glycopeptides. Anal Chem 2005;77:886-94.
[15] Albrethsen J. The first decade of MALDI protein profiling: a lesson in translational biomarker research. J Proteomics 2011;74:765-73.
[16] Nicolardi S, Palmblad M, Hensbergen PJ, Tollenaar RA, Deelder AM, van der Burgt YE. Precision profiling and identification of human serum peptides using Fourier transform ion cyclotron resonance mass spectrometry. Rapid Commun Mass Spectrom 2011;25:3457-63.
[17] Alagaratnam S, Mertens BJ, Dalebout JC, Deelder AM, van Ommen GJ, den Dunnen JT, 't Hoen PA. Serum protein profiling in mice: identification of Factor XIIIa as a potential biomarker for muscular dystrophy. Proteomics 2008;8:1552-63.
Chapter 1
49
and MALDI-FTICR Serum Peptide Profiling. J Am Soc Mass Spectrom 2010.
[19] Huijbers A, Velstra B, Dekker TJ, Mesker WE, van der Burgt YE, Mertens BJ, Deelder AM, Tollenaar RA. Proteomic serum biomarkers and their potential application in cancer screening programs. Int J Mol Sci 2010;11:4175-93.
[20] Huijbers A, Mesker W, Velstra B, van Der Burgt Y, Mertens B, Deelder A, Tollenaar R. Early Detection of Colorectal Cancer Using Mass Spectrometry Based Serum Protein Profiling. Ann Oncol 2010;21:209.
[21] Velstra B, Mesker WE, van der Burgt YEM, Mertens BJ, Deelder AM, Tollenaar RAEM. Mass spectrometry based serum protein profiling for the early detection of breast cancer: Taking the steps towards clinical implementation. Brit J Surg 2010;97:S5.
[22] Mertens BJA, van der Burgt YEM, Velstra B, Mesker WE, Tollenaar RAEM, Deelder AM. On the use of double cross-validation for the combination of proteomic mass spectral data for enhanced diagnosis and prediction. Stat Probabil Lett 2011;81:759-66.
[23] Nadarajah VD, Mertens BJA, Dalebout H, Bladergroen MR, Alagaratnam S, Garrood P,
Bushby K, Straub V, Deelder AM, den Dunnen JT, van Ommen G-JB, 't Hoen PAC, van der Burgt YEM. Serum Peptide Profiles Of Duchenne Muscular Dystrophy (DMD) Patients Evaluated Using Data Handling Strategies For High Resolution Content. J Proteomics Bioinform 2012;4:96-103.
[24] Tiss A, Smith C, Menon U, Jacobs I, Timms JF, Cramer R. A well-characterised peak identification list of MALDI MS profile peaks for human blood serum. Proteomics 2010;10:3388-92.
[25] Lim MD, Dickherber A, Compton CC. Before you analyze a human specimen, think quality, variability, and bias. Anal Chem 2011;83:8-13.
[26] McDonnell LA, van Remoortere A., van Zeijl RJ, Dalebout H, Bladergroen MR, Deelder AM. Automated imaging MS: Toward high throughput imaging mass spectrometry. J Proteomics 2010;73:1279-82.
Chapter
2
Precision profiling and identification of
human serum peptides using Fourier transform
ion cyclotron resonance mass spectrometry
Simone Nicolardi, Magnus Palmblad,
Paul J. Hensbergen, Rob A. E. M. Tollenaar,
André M. Deelder and Yuri E. M. van der Burgt
52
ABSTRACT
Many biomarker discovery studies are based on matrix-assisted laser desorption/ionisation (MALDI) peptide profiles. In this study, 96 human serum samples were analysed on a Bruker solariXTM MALDI Fourier transform ion cyclotron resonance (FTICR) system
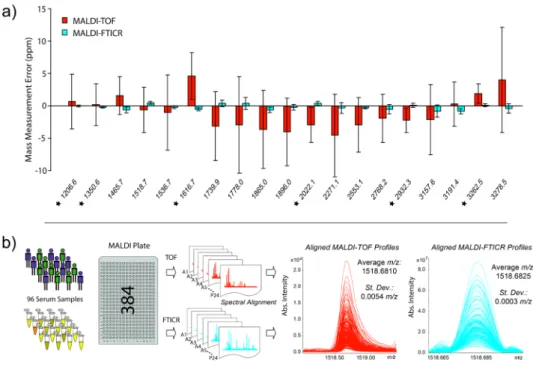
equipped with a 15 tesla magnet. Isotopically resolved peptides were observed in ultrahigh resolution FTICR profiles up to m/z 6500 with mass measurement errors (MMEs) of previously identified peptides at a sub-ppm level. For comparison with our previous platform for peptide profile mass analysis (i.e. Ultraflex II) the corresponding time-of-flight (TOF) spectra were obtained with isotopically resolved peptides up to
Chapter 2
53
INTRODUCTION
54
screening of hundreds to thousands of patient samples with high reproducibility in a realistic timeframe.