Sri Krishna International Research & Educational Consortium http://www.skirec.com
1
-The Journal of Sri Krishna Research & Educational Consortium
J O U R N A L O N B A N K I N G
F I N A N C I A L S E R V I C E S &
I N S U R A N C E R E S E A R C H
Internationally Indexed & Listed Referred e-Journal
PERFORMANCE OF BENCHMARK
MUTUAL FUNDS IN INDIA -AN ANALYSIS OF SELECT
EQUITY, DEBT AND BALANCED GROWTH FUNDS
DR. T. SATYANARAYANA CHARY*; SHAIK MASOOD**
*Associate Professor and Head, Department of Commerce, Telangana University, Nizamabad -503322.
**Assistant Professor, Department of Business Management, Alluri Institute of Management Sciences (AIMS), Warangal -506002.
ABSTRACT
Allocations of wealth across different asset classes and specific investments have become a challenging task for the investors, portfolio managers and fund managers. Essentially, investors participate in financial markets over time in order to share and diversify various risks, which arise in their investment decisions. Investors use financial markets not only to share risk but to make risk-return trade-off in a better way. Mutual funds help the investors make optimal trading strategies economically feasible to mitigate the risk and optimise the
return. The performance of mutual funds that depends on volatility of the market
and macro economy will play a pervasive role in deciding the fate of investment decisions of investors a lot. The present paper is a modest attempt to discuss on the performance of benchmark mutual funds in India through a select Equity, Debt and Balanced Growth Fund.
KEYWORDS: Mutual Funds, Performance appraisal, NAV, Return and Risk, Volatility.
1. INTRODUCTION
A mutual fund is a company that pools the money of many investors -- its shareholders -- to invest in a variety of different securities. Investments may be in stocks, bonds, money market securities or some combination of these. Those securities are professionally managed on behalf of the shareholders, and each investor holds a pro rata share of the portfolio entitled to any profits when the securities are sold, but subject to any losses in value as well.
Sri Krishna International Research & Educational Consortium http://www.skirec.com
2
-investors having not enough resources, time, knowledge, and expertise to participate in present complex and volatile investment markets to invest them in financial assets. A mutual fund will state its own investment objective and investors as a part of their own investment strategies will make the mutual funds choose the appropriate diversified portfolios during the market volatile, appropriate timing strategies and out performance of fund managers. Further, the mutual fund ensure its participants a professional management for portfolio selection, diversifies the investment in large number of companies and selects various forms of securities viz. shares, debentures and bonds.
1. LITERATURE REVIEW
The performance evaluation of mutual funds has been an enormous interest to researchers and investors all over the world, as it is a widely discussed issue in the field of finance. The investment performance of mutual funds has been so far extensively examined in the developed capital markets. The portfolio theory suggested by Harry Markowitz gave a new direction to the evaluation of portfolio performance, which has completely revolutionized the thinking on the issue. This theory was followed by Capital Asset Pricing Model (CAPM) developed by William S Sharpe. Several measures of performance of managed portfolio have been developed by taking risk and return characteristics into consideration. However, the credit of developing the measures for performance evaluation of managed portfolio goes to Sharpe (1966), Treynor (1966), Jensen M C (1968) and E. Fama (1970) whose contributions are widely acknowledged and accorded both by academicians and practitioners as well.
Jack Treynor (1965) developed a methodology for performance evaluation of a mutual fund that is referred to as reward to volatility measure, which is defined as average excess return on the portfolio. This is followed by Shape’s (1966) reward to variability measure that is average excess return on the portfolio divided by the standard deviation of the portfolio.
Sharpe (1966) the pioneering work on the performance evaluation of mutual funds was developed a composite measure that considers return and risk. He evaluated the performance of 34 open-ended mutual funds during the period 1944-63 by the measures developed by him. He concluded that the average mutual fund performance was distinctly inferior to an investment in the DJIA. It was also revealed in his study that good performance was associated with low expense ratio and only low relationship was discovered between fund size and performance
A study performed by Treynor & Mazuy (1966) found no statistical evidence that investment manager of any 57 funds were not able to guess the market movements in advance. This study suggests that an investor in mutual funds was totally dependent on fluctuations in the general market. The study revealed that the improvement in rate of return was due to the fund managers’ ability to identify under priced shares in the market
The next pioneering attempt in studying the performance of mutual funds was by
Sri Krishna International Research & Educational Consortium http://www.skirec.com
3
-further concluded that there is very little evidence that any individual fund was able to do significantly better than that which we expected from mere random chance.
E. Fama (1970) developed a methodology for evaluating investment performance of managed portfolios. He suggested that the over all performance of managed portfolios could be broken down into several components. He argued that the observed return of a fund could be due to ability of fund managers to pick up the best securities at a given level of risk (their selectivity ability). Some portion of this return could also arise due to the prediction of general market price movements (their timing ability) and also suggested that return on a portfolio could be subdivided into two parts. The return for security selection and return for bearing risk. Various finer subdivisions of both selectivity and risk were also suggested. The model developed by him combined concepts from modern theories of portfolio selection and capital market equilibrium with those of traditional concepts of what constitute good portfolio management.
Alexander et al., (1996) reported in his study that only 18.9% of respondents could provide an estimate of expenses for their largest MF holding. 57% stated that they did not know what the expenses were even at the time they made the MF purchase. This suggests insensitivity to costs and many investors do not use fund costs as an evaluative criterion in making investment decisions.
Gupta and Mittal (1991) studied the funds management pattern and managerial efficiency of UTI. They concluded that funds collection aspect, funds deployment and working capital management of UTI are satisfactory. But the utilization of operating assets has not been proper and in tact.
Mohinder N. Kaura and M. Jayadev (1995) evaluated five schemes of Indian Mutual Funds; two from UTI, one each from Can Bank Mutual Fund, Indian Bank Mutual Fund and SBI Mutual Fund. They analyzed the data for the years 1993-94 and concluded that of the two schemes selected from UTI, one has outperformed the market.
Sarkar and Majumdar (1995) evaluated financial performance of five close-ended growth funds for the period February 1991 to August 1993, concluded that the performance was below average in terms of alpha values (all negative and statistically not significant) and funds possessed high risk. No reference was provided about the timing parameters in their study.
Chakrabarti and Harsha Rungta (2000) their study attempts to identify and evaluate the performance of mutual funds with focus on private sector equity funds. It studies the risk-return characteristics of selected major equity-based private mutual fund companies. The inference of the study reveals that there is no one-to-one correspondence between performance by return and performance by risk-adjusted returns
Sri Krishna International Research & Educational Consortium http://www.skirec.com
4
-Amitabh Gupta (2003) evaluated a sample of 73 mutual fund schemes with different objectives for the period 1994-99. Funds from both the public and private sector have been selected for the purposes of evaluation in terms of testing the market timing abilities of the Indian fund managers. He concluded that out of the 73 schemes, 38 schemes earned higher returns in comparison to the market returns, while the remaining 35 schemes generated lower returns than that of the market.
Ramesh Chandra (2006) studied 80 sample investment schemes from public as well as private or five year period encompassing January 1998 through December 2002, to examine risk – return rationality across the measurement criteria and fund characteristics to investigate the presence of any performance bias.
Sathy.S.D. and Bishnupriya .M.(2006) examined the performance of 23 selected growth - oriented and open-ended mutual funds, from 1996-1997 to 2004-2005. On the basis of returns they found that UTI mutual fund schemes and Franklin Templeton schemes have performed exceedingly well in public and private domain respectively.
Kavitha. R. (2007) analyzed the fund selection behavior of individual investors towards Mutual Funds in Mumbai city during the period July 2004 – December 2004. She reported that there is a fair opportunity for mutual fund investments in future.
The literature review very clearly indicates that there is a need for undertaking a comprehensive study over performance appraisal of mutual funds through certain measures, taking into consideration different types of schemes launched by various funds, hence the present research paper attempted to fill the gap.
3. NEED FOR THE STUDY
The changing dimensions of economic reforms in terms of liberalization of financial markets gave free entry to foreign players in Indian capital market, such as, insurance ,mutual funds direct portfolio investments and FIIs has resulted in rapid restructuring of the free economy much in tune with the global trends. In such rapidly varying capital market, it is essential to respond positively and quickly to events that tend to move share prices. As a result, investment companies have become an effective conduit for current income generation, capital appreciation and the benefits derived through diversification. However, the performance of mutual funds was also very volatile and trends shown their impact on total returns. Hence the selection of superior performing funds is an essential issue that becomes a focal point all the time.
4. OBJECTIVE, DATA AND METHODOLOGY
Sri Krishna International Research & Educational Consortium http://www.skirec.com
5
-were obviously found in the constituents of capital markets. These improvements triggered a surge in the operations of the mutual funds a lot in India. The calculation Return, Net Asset Value and Performance Indicators of various select schemes are made through appropriate tools as discussed below.
THE RATE OF RETURN
The rate of return of the fund can be measured through the changes in net asset value of the fund over a period of time. The net asset value calculated in the form of dividend income, capital gain, bonus shares income from the investment in the securities by the funds. The following formula explains the above concept of return as
Where:
Rit = the total rate of return on fund i during month t
EPit = the ending price for fund i during month t
Divit = the dividend payments made by fund i during month t
Cap.Distit = the capital gain distributions made by fund i during month t
Bpit = the beginning price for fund i during month t
NET ASSET VALUE (NAV)
When the securities are held jointly, as they are in an investment company, the appropriate way to value a client’s investment is to multiply the number of shares in the fund he or she owns by the per-share value of the entire security fund. This per-share value is known as the Net Asset Value (NAV) of the investment company. It equals the total market value of all the firm’s assets divided by the total number of fund shares outstanding, or the NAV for an investment company is analogous to the share price of a corporation’s common stock. Hence, the NAV of the fund shares will increase as the value of the underlying assets increases. It can be expressed as follows:
Fund NAV = (Total Market Value of Fund Portfolio) - (Fund Expenses) / (Total Fund Shares Outstanding).
SHARPE’S PORTFOLIO PERFORMANCE MEASURE
Sri Krishna International Research & Educational Consortium http://www.skirec.com
6
-evaluate the performance of mutual funds.The Sharpe measure of portfolio performance
(designated S) is stated as follows:
Where:
Ri = the average rate of return for portfolio i during a specified time period
= the average rate of return on risk-free assets during the same time period
i = the standard deviation of the rate of return for portfolio i during the time period
TREYNOR’S PERFORMANCE MEASURE
Treynor developed the first composite measure of portfolio performance that includes risk. He postulated two components of risk: (1) risk produced by general market fluctuations and (2) risk resulting from unique fluctuations in the portfolio securities. To identify risk due to market fluctuations, he developed the characteristic line, which defines the relationship between the rate of return for a portfolio over time and the rates of return for an appropriate market portfolio. The characteristic line’s slope measures the relative volatility of the portfolio’s returns in relation to returns for the aggregate market. A higher slope (beta) characterizes a portfolio that is more sensitive to market returns and that has greater market risk. Deviations from the characteristic line indicate unique returns for the portfolio relative to the market. These differences arise from the returns on individual stocks in the portfolio. In a completely diversified portfolio, these unique returns for individual stocks should cancel out. As the correlation of the portfolio with the market increases, unique risk declines and diversification improves. He was interested in a measure of performance that would apply to all investors regardless of their risk preferences. Building on developments in capital market theory, he introduced a risk-free asset that could be combined with different portfolios to form a straight portfolio possibility line. He showed that rational, risk-averse investors would always prefer portfolio possibility lines with larger slopes as such high-slope lines would place investors on higher indifference curves. The slope of this portfolio possibility line is equal to
WHERE
Ri =the average rate of return for portfolio i during a specified time period
RFR =the average rate of return on a risk-free investment during the same time period
Sri Krishna International Research & Educational Consortium http://www.skirec.com
7
-JENSEN PORTFOLIO PERFORMANCE MEASURE
The Jensen measure is based on the capital asset pricing model (CAPM). All versions of the CAPM states that the realized rate of return on a security or portfolio during a given time period should be a linear function of the risk-free rate of return during the period, plus a risk premium that depends on the systematic risk of the security or portfolio during the period plus a random error term (ejt). It shows that risk premium earned on the jth portfolio is equal to ßj times a market risk premium plus a random error term.
E (Rj) = RFR + j [E (RM) – RFR]
Where:
E (Rj) = the expected return on security or portfolio j
RFR = the one-period risk-free interest rate
j = the systematic risk (beta) for security or portfolio j
E (RM) = the expected return on the market portfolio of risky assets
The authenticity of ranks of select mutual funds done through Sharpe, Treynor and Jensen are tested with spearman’s rank correlation. The Spearman's Rank Correlation Coefficient is used to discover the strength of a link between two sets of data. The formulae used for rank correlation, the mathematical notation of the Spearman Rank formula is
R = rank correlation
d = square of the rank differences
n = no. of samples
5. HYPOTHESIS OF THE STUDY
HO : There is no significance difference in performance of various select mutual funds under Sharpe, Jensen and Treynor’s portfolio performance indicators.
6. ANALYSIS AND FINDINGS
6.1 NET ASSET VALUE
Sri Krishna International Research & Educational Consortium http://www.skirec.com
8
Sri Krishna International Research & Educational Consortium http://www.skirec.com
9
-TABLE - 6.1
NAV ANALYSIS OF EQUITY GROWTH FUNDS (NAV IN RS)
Source: w.w.w.money control.com and compiled from AMFI reports
NAME OF THE FUND
Avg NAV from Inception
2000 2001 2002 2003 2004 2005 2006 2007 2008 2009 Avg NAV
for 10 years
RANK
UTI 7.17 10.12 7.41 7.49 6.94 14.68 18.95 32.12 30.7 38.22 26.47 19.31 14 LIC 7.4 10.07 5.7 6.11 5.68 11.88 12.77 19.83 19.16 22.44 14.45 12.81 16 BIRLA SUNLIFE 10.58 52.4 24.92 26.66 24.48 55.64 80.28 155.69 174.25 213.511 125.15 93.30 2 SBI 7.87 12.28 4.7 4.77 4.18 9.08 17.35 35.2 41.2 45.2 21 19.50 13 CAN REBECO 9.99 NA NA NA NA 12.87 17.63 29.6 28.6 36.6 23.7 24.83 11 HDFC 9.29 24.89 16.44 22.31 22.26 51.59 66.83 127.15 142.6 165.78 108.85 74.87 3 HSBC 10.36 NA NA NA 10.09 27.41 36.18 60.91 67.85 88.38 60.17 50.14 5 ICICI 10.01 NA NA NA 10.28 18.73 26.87 53.3 63.01 72.24 49.55 42.00 6 TATA 4.88 14.48 9.94 10.14 8.86 22.98 30.64 55.31 58.75 73.59 49.04 33.37 9 RELIANCE 13.35 39.37 19.4 24.1 28.2 75.41 119.49 229.7 259.7 333.74 207.1 133.62 1 DBS CHOLA 11.4 NA NA NA NA NA 15.01 21.31 25.93 37.31 19.79 23.87 12 DSP BLACK ROCK 10 NA NA NA NA NA 13.79 27.36 31.54 41.3 25.18 27.83 10 KOTAK 7.42 20.41 11.53 11.61 11.58 25.18 32.12 59.46 64.99 85.52 55.41 37.78 7 SUNDARAM BNP 7.96 17.98 11 12.31 12.06 26.35 33.58 61.65 62.75 80.3 44.6 36.26 8 FRAN
TEMPLETON
Sri Krishna International Research & Educational Consortium http://www.skirec.com
10
-It is vivid from table 6.2 that there are 15 debt (Short term) growth funds analysed as proxies of the industry. The average Net Asset Values of DSP BLOCK ROCK, LIC and KOTAK were found to be the funds having the average NAVs of Rs 21.99, 17.72 and 17.09 respectively. Whereas, SBI, ICICI, CANREBECO, BIRLA SUNLIFE HDFC, RELIANCE and SUNDARAM PNB’s average NAV found to move between Rs 13.87 to 10.33 over the study period, hence, under this segment, Mutual funds were found showing a marginal change in performance, except DSP BLOCK ROCK, LIC and KOTAK as they have demonstrated the top performance over the study period. This is due to the portfolios constructed based on corporate debt , Government Treasury Bills and securities that are highly safety and could provide regular income.
TABLE - 6.2
DEBT GROWTH FUNDS (SHORT TERM) (NAV IN RS)
The debt securities risk arises due to change in interest rate, inflation, price of securities and duration of maturity causes for performance of the mutual funds.
NAME OF THE FUND
Avg NAV from
Inception 2000 2001 2002 2003 2004 2005 2006 2007 2008 2009
Avg NAV for 10
years RANK
UTI 10.14 10.46 10.9 11.5 12.2 13.3 14.33 12.12 11.5
Sri Krishna International Research & Educational Consortium http://www.skirec.com
11
Source:w.w.w.money control.com and compiled from AMFI reports
It is evident from table 6.3 that the analyses of the balance growth funds from select 12 different funds, which were considered as industry giants. The averages NAV of BIRLA SUNLIFE, UTI, TATA, and LIC were reached the top NAV of Rs 107.77, 34.73, 29.96, and 29.63 respectively. Hence, the BIRLA SUNLIFE was found as top performer, followed by UTI, TATA, and LIC. On the other hand, DSP BLOCK ROCK, SBI, HDFC, ICICI and FT were moved with a marginal change in value and settled themselves at NAV of Rs23.53, 20.88, 20.56, 20.38 and 19.97 respectively. The other funds, namely ING INVESTMENT LIMITED, RELIANCE and KOTAK were found as least performers at an average NAV of 12.38, 11.44 and 11 respectively. It is also due to portfolio constructions based on equity a nd debt oriented securities without a logical weightage of allotment of total fund. Thus, the performance of the funds identified to depend on market risk, interest rate risk, inflation and price risk to possible extent.
TABLE - 6.3
BALANCE GROWTH FUND (NAV in RS)
NAME OF THE FUND
Avg NAV from
Inception 2000 2001 2002 2003 2004 2005 2006 2007 2008 2009
Avg NAV for 10
years
RANK
UTI 10.29 20.87 16.23 18 18.29 29.97 35.46 50.63 52.49 60.53 44.81 34.73 2 LIC 21.44 21 15.71 16.76 17.76 23.99 27.02 42.75 42.06 50.51 38.7 29.63 4
Sri Krishna International Research & Educational Consortium http://www.skirec.com
12
-BIRLA SUNLIFE 20.45 69.3 42.42 47.24 46.06 82.05 100.4 154.52 172.56 207.2 156 107.77 1 SBI 5.14 19.72 7.67 7.7 7.06 13.27 18.66 31.44 33.84 40.67 28.73 20.88 6
CAN ROBECO NA NA NA NA NA NA NA NA NA NA NA NA
HDFC 10 9.23 10.5 10.3 16.72 19.96 28.87 29.18 34.34 25.93 20.56 7
HSBC NA NA NA NA NA NA NA NA NA NA NA
ICICI 10 13.55 8.32 9.29 9.37 15.66 19.77 30.64 33.56 37.28 26.38 20.38 8 TATA 7.89 16.92 11.59 12.53 12.32 22.29 29.31 44.79 48.56 59.16 42.16 29.96 3 RELIANCE 10.04 NA NA NA NA NA NA 10.3 11.14 13.54 10.76 11.44 11
DBS CHOLA NA NA NA NA NA NA NA NA NA NA NA
DSP BLACK ROCK 10 12.81 9.15 9.82 10.06 18.1 22.1 34 37.15 45.89 36.2 23.53 5 KOTAK 4.64 5.63 4.14 4.67 4.79 7.58 10.4 17.47 17.85 21.69 15.74 11.00 12
SUNDARAM BNP NA NA NA NA NA NA NA NA NA NA NA
FRANK TEMPLETON 10.65 10.72 7.77 9.21 9.16 16.48 19.08 28.16 32.12 37.89 29.15 19.97 9 ING INVE MGT LTD 9.51 5.82 6.72 6.22 9.77 11.52 17.08 18.05 21.33 14.88 12.38 10 Source: w.w.w.money control.com and compiled from AMFI reports
6.2 AVG RATE OF RETURN
Besides NAVs, the rate of return is also an essential item to compile and comprehend the performance of mutual funds. The analysis of Equity (16), Debt (short term) (15) and Balance growth (12) funds have been exhibited very clearly through table 6.4 to 6.6
Sri Krishna International Research & Educational Consortium http://www.skirec.com
13
-2001,2003 and 2009, hence it could provide an average 40.61% over the study period. In the same way the RELAINCE also provided a good return at 39.85%, despite its declinement in 2001 and 2008. Whereas TATA’s average rate of return was very near to RELAINCE, which were 39.11% and even, HDFC could also provide the rate of return at par with others, i.e. 34.03%. On the other hand ICICI, SBI, LIC, UTI, CANREBOC, DBS CHOLA, DSP BLOCK ROCK, KOTAK, SUNDRAM BNP, FT and ING investment limited, moved between 12.35% and 31.32%. Hence, the returns provided by select mutual funds was very significant and having a good stability despite the declinement in returns at a regular intervals (see the graph 1)
TABLE – 6.4
RATE OF RETURN OF EQUITY GROWTH FUNDS (FIG IN PERCENTAGES)
NAME OF THE FUND 2000 2001 2002 2003 2004 2005 2006 2007 2008 2009 AVG (Rp) RANK
Sri Krishna International Research & Educational Consortium http://www.skirec.com
14
-FRANK TEMPLETON 101 -24.5 15.9 -3.4 132.1 16 74.6 7 24.6 -30.1 31.32 7 ING INV MGT LTD 200.2 -75.7 12.9 -17.2 55.2 24.1 82.7 2.7 29.4 -39.7 27.46 10
Source: compiled
*Returns are adjusted to dividends
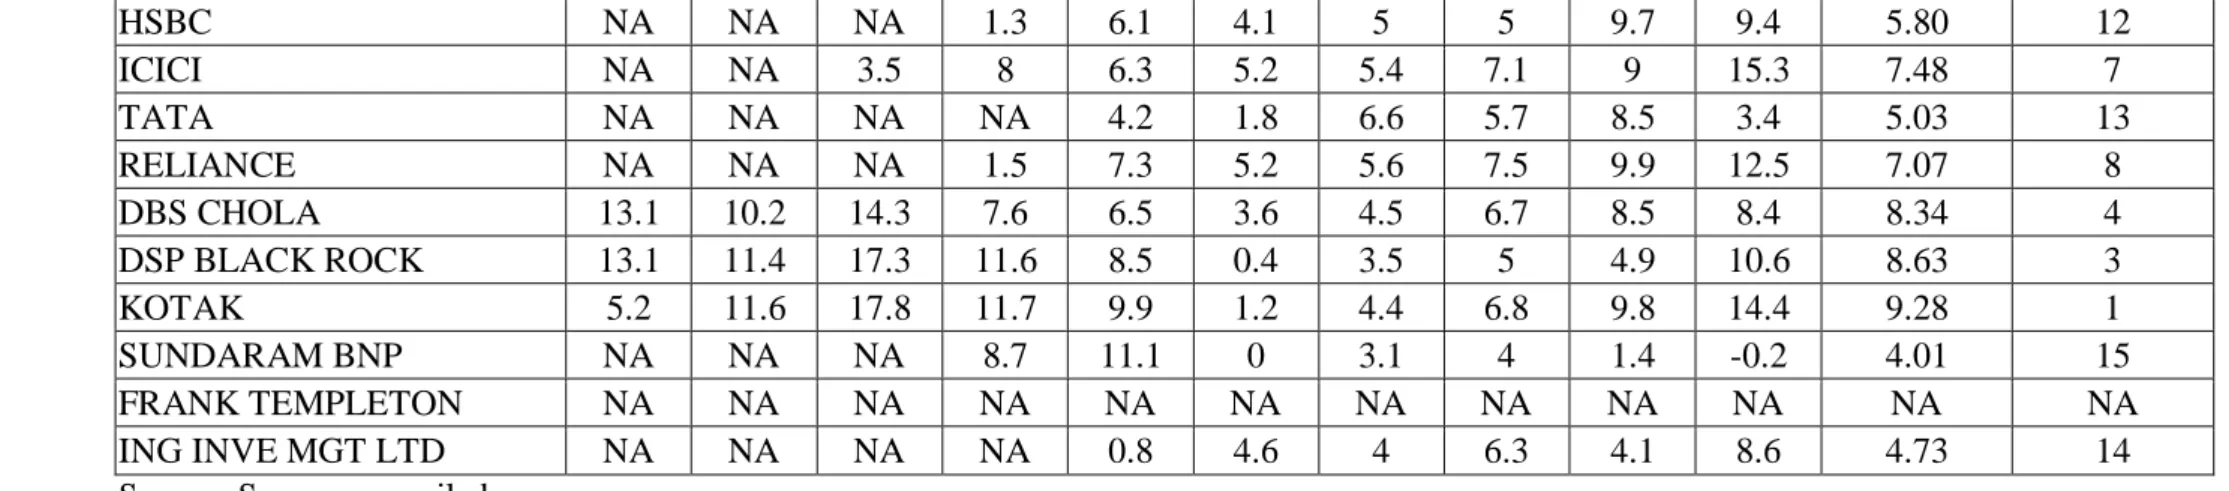
It is evident from table 6.5 that the analysis of rates of returns of various debt (Short term) growth funds. It is very clear that the performance of nearly 16 funds are considered to be the top performers and taken as proxies for industry. The KOTAK, LIC, DSP BLOCK ROCK, DBS CHOLA returns were 9.28, 9.14, 8.63, and 8.34 respectively. The KOTAK secured top performer position based on average returns followed by LIC, DSP BLOCK ROCK and DBS CHOLA with marginal changes over top performer. Whereas, CANREBOC, HDFC, ICICI, RELIANCE, BIRLA SUN LIFE, SBI and UTI’s average returns were found moving between 7.89% and 6.13% respectively. These funds provided the rate of return nearly equal to risk free rate (Govt Treasury Bill rate), hence, the funds were not paying any higher contribution to investors over their expectations when compared to risk free rate. HSBC, TATA ING investment limited, SUNDRAM BNP returns were found at 5.8, 5.03, 4.73 and 4.01 percent respectively. Hence they proved that they are least performers in debt growth funds when compared to industry leaders. It can be asserted that these funds returns were less or equal to term deposits or savings bank rate, or fo r that matter, equal to yield on Government Securities, hence, investor could not get any risk(see graph 1)
TABLE – 6.5
RATE OF RETURN OF DEBT GROWTH FUNDS (SHORT TERM) (FIG IN PERCENTAGES)
NAME OF THE FUND 2000 2001 2002 2003 2004 2005 2006 2007 2008 2009 AVG (Rp) RANK
UTI NA NA NA NA 3.9 4.6 5.9 5.7 8.7 8 6.13 11
LIC 12.6 11 15.9 12.1 8.7 0.8 4.7 4.5 9.6 11.5 9.14 2
BIRLA SUNLIFE NA NA NA 6.8 5.9 4.7 4.7 7.5 9.7 8.4 6.81 9
SBI NA 2.7 12.9 7 6.9 2.2 3.6 5.3 9.3 11 6.77 10
CAN REBECO NA NA NA 4.1 6.6 3.1 2.4 5 6.1 27.9 7.89 5
Sri Krishna International Research & Educational Consortium http://www.skirec.com
15
-HSBC NA NA NA 1.3 6.1 4.1 5 5 9.7 9.4 5.80 12
ICICI NA NA 3.5 8 6.3 5.2 5.4 7.1 9 15.3 7.48 7
TATA NA NA NA NA 4.2 1.8 6.6 5.7 8.5 3.4 5.03 13
RELIANCE NA NA NA 1.5 7.3 5.2 5.6 7.5 9.9 12.5 7.07 8
DBS CHOLA 13.1 10.2 14.3 7.6 6.5 3.6 4.5 6.7 8.5 8.4 8.34 4 DSP BLACK ROCK 13.1 11.4 17.3 11.6 8.5 0.4 3.5 5 4.9 10.6 8.63 3 KOTAK 5.2 11.6 17.8 11.7 9.9 1.2 4.4 6.8 9.8 14.4 9.28 1 SUNDARAM BNP NA NA NA 8.7 11.1 0 3.1 4 1.4 -0.2 4.01 15
FRANK TEMPLETON NA NA NA NA NA NA NA NA NA NA NA NA
ING INVE MGT LTD NA NA NA NA 0.8 4.6 4 6.3 4.1 8.6 4.73 14 Source:Source: compiled
*Returns are adjusted to dividends
Sri Krishna International Research & Educational Consortium http://www.skirec.com
16
-TABLE – 6.6
RATE OF RETURN OF BALANCE GROWTH FUND (FIG IN PERCENTAGES)
NAME OF THE FUND 2000 2001 2002 2003 2004 2005 2006 2007 2008 2009 AVG (Rp) RANK
UTI 83.1 -21.3 11.3 0.7 62.3 16.3 40.9 1.7 18.5 -25.5 18.80 4 LIC -2.5 -16.3 11.1 6.3 35.1 10.4 55.7 -2.6 23.6 -23.2 9.76 10 BIRLA LIFE 138.2 -36.5 12.8 -2.8 77.3 19.9 51.1 9.1 20.2 -22 26.73 2 SBI 182.8 -58.9 2.8 -9 86.5 36.7 66.3 5.6 23.5 -29 30.73 1 HDFC NA -7.6 15.3 -3.3 61.9 17 42.4 -0.6 20.6 -24 13.52 9 ICICI 35.5 -35.6 12.6 0.2 66.2 23.9 52 7.6 14.5 -28.8 14.81 7 TATA 68.2 -29.1 9.3 -2.4 76.9 28.4 50.5 6.5 25.6 -27 20.69 3
RELIANCE NA NA NA NA NA NA 2.5 7.8 22.8 -20.8 3.08 12
DSP BL ROCK 28 -28 8.9 1.4 79.2 20.5 52.1 7 28.4 -22.7 17.48 5 KOTAK 21.5 -24.9 13.2 2.3 57.8 34.3 65.3 0.9 24.8 -26.9 16.83 6 FRANTEMPLETON 0.7 -25.6 20.2 -2.3 76.3 13.4 45.2 11.8 20.5 -22.8 13.74 8 ING INVE LTD NA -38.8 17.1 -7.4 55.1 15.7 45.7 3.7 21.6 -29.7 9.22 11 Source: Source: compiled
* Returns are adjusted to dividends
6.3. THE PERFORMANCE EVALUATION OF MUTUAL FUNDS
Sri Krishna International Research & Educational Consortium http://www.skirec.com
17
-It is evident from table 6.7 that the performance of 16 mutual funds of equity growth segment based on Sharpe’s measure ICICI, RELIANCE, HSBC, HDFC, TATA, DSP BLOCK ROCK, BIRLA SUN LIFE, KOTAK, CANREBOC and SBI were adjudged as the top 10 funds. Whereas, the Treynor’s measure indicated that HSBC, RELIANCE, ICICI, BIRLA SUN LIFE, HDFC, FT, TATA, DSP BLOCK ROCK, KOTAK and CANREBOC are the top 10 performers. Similarly, the Jensen’s ranks also adjudged the performance of various select Mutual funds, which is similar to Treynor’s measure, hence HSBC, RELIANCE, ICICI, BIRLA SUN LIFE and HDFC are leading the market by maximizing return and minimizing the risk (see graph 2)
TABLE – 6.7
PERFORMANCE OF EQUITY GROWTH FUND
NAME OF THE FUND Rp- Rf Rm -Rf Alpha(α) SD Beta(β) SM Rank TM Rank JM Rank
UTI 11.27 6.13 4.51 43.36 1.10 0.26 13 10.21 15 4.08 15
LIC 4.85 6.13 -1.75 43.80 1.08 0.11 14 4.50 16 -1.63 16
BIRLA SUNLIFE 34.17 6.13 23.49 81.19 1.74 0.42 8 19.60 4 13.47 4
SBI 18.53 6.13 8.80 61.36 1.59 0.30 12 11.67 14 5.54 14
CAN REBECO 12.00 6.13 6.68 34.48 0.87 0.35 10.5 13.82 10 7.69 10
HDFC 26.53 6.13 18.08 54.92 1.38 0.48 4 19.25 5 13.12 5
HSBC 30.64 6.13 21.88 62.94 1.43 0.49 3 21.43 1 15.30 1
ICICI 24.07 6.13 16.60 44.28 1.22 0.54 1 19.75 3 13.62 3
TATA 31.61 6.13 20.60 68.46 1.80 0.46 5 17.60 7 11.47 7
RELIANCE 32.35 6.13 22.71 63.29 1.57 0.51 2 20.56 2 14.43 2 DBS CHOLA 11.00 6.13 5.63 38.30 0.88 0.29 12 12.55 13 6.42 13 DSP BLACK ROCK 21.02 6.13 12.83 48.11 1.34 0.44 6.5 15.73 8 9.60 8
KOTAK 21.05 6.13 12.53 53.40 1.39 0.39 9 15.14 9 9.01 9
Sri Krishna International Research & Educational Consortium http://www.skirec.com
18
-FRANK TEMPLETON 23.82 6.13 15.75 53.84 1.32 0.44 6.5 18.10 6 11.97 6 ING INVE MGT LTD 19.96 6.13 10.66 75.75 1.52 0.26 13 13.16 12 7.03 12
Source: compiled
Rp = Fund returns, Rm = Market Returns, Rf = Risk Free rate, Alpha (α) = Un systematic risk
Beta (β) = Co-efficient of systematic risk, SM = Sharpe Measure, TM = Treynor Measure and JM = Jensen’s Measure
It is vivid from table 6.8 that the performance evaluation of 15 mutual funds of Debt (short term) Growth segments, which are taken as proxies of industry (best performers). The performance evaluation done based on Sharpe measure, indicates that LIC, KOTAK, DBS CHOLA, DSP BLOCK ROCK, CANREBOC, HDFC, ICICI, RELIANCE, SBI, BIRLA SUN LIFE and HSBC are the top 10 performing funds. Whereas, the Treynor’s measure says that HSBC, UTI, ING investment limited, BIRLA SUN LIFE, SBI, RELIANCE and ICICI are the top performing funds. Similarly the Jensen’s rank also adjudged the performance of various select Mutual funds at par with Treynor’s measure. Hence, HSBC, UTI, ING investment limited, BIRLA SUN LIFE, SBI, RELIANCE and ICICI are found finally as leaders of the market (see the graph 3)
TABLE – 6.8
PERFORMANCE OF DEBT GROWTH FUND (SHORT TERM)
NAME OF THE FUND Rp- Rf Rm -Rf Alpha(α) SD Beta(β) SM Rank TM Rank JM Rank
UTI -1.37 6.13 -1.10 1.88 -0.04 -0.73 12 31.67 2 25.54 2
LIC 1.64 6.13 2.16 4.55 -0.09 0.36 1.5 -19.26 12 -25.39 13 BIRLA SUNLIFE -0.69 6.13 -0.42 1.87 -0.04 -0.37 10 15.61 4 9.48 4
SBI -0.73 6.13 -0.44 3.73 -0.05 -0.20 9 15.49 5 9.36 5
CAN REBECO 0.39 6.13 1.99 8.95 -0.26 0.04 5 -1.47 9 -7.60 9
HDFC 0.11 6.13 0.80 3.43 -0.11 0.03 6 -1.02 8 -7.15 8
HSBC -1.70 6.13 -1.61 2.96 -0.01 -0.57 11 113.98 1 107.86 1
Sri Krishna International Research & Educational Consortium http://www.skirec.com
19
-TATA -2.47 6.13 -2.70 2.40 0.04 -1.03 14 -65.49 15 -71.62 15 RELIANCE -0.43 6.13 -0.20 3.52 -0.04 -0.12 8 11.36 6 5.24 6 DBS CHOLA 0.84 6.13 1.16 3.42 -0.05 0.25 3 -16.17 11 -22.30 12 DSP BLACK ROCK 1.13 6.13 1.73 5.13 -0.10 0.22 4 -11.62 10 -17.75 10 KOTAK 1.78 6.13 2.56 4.97 -0.13 0.36 1.5 -14.06 13 -20.19 11 SUNDARAM BNP -3.49 6.13 -3.86 4.35 0.06 -0.80 12 -57.03 14 -63.16 14 ING INVE MGT LTD -2.77 6.13 -2.18 2.60 -0.09 -1.06 15 29.14 3 23.01 3 Source: compiled
Rp = Fund returns , Rm = Market Returns, Rf = Risk Free Rate, Alpha (α) = Un systematic risk,
Beta (β) = Co-efficient of systematic risk, SM = Sharpe Measure, TM = Treynor Measure and
JM = Jensen’s Measure
Sri Krishna International Research & Educational Consortium http://www.skirec.com
20
-TABLE – 6.9
PERFORMANCE OF BALANCE GROWTH FUND
NAME OF THE FUND Rp- Rf Rm -Rf Alpha(α) SD Beta(β) SM Rank TM Rank JM Rank
UTI 11.30 6.13 6.41 34.59 0.80 0.33 4 14.16 3 8.03 3
LIC 2.26 6.13 -1.32 23.63 0.58 0.10 9 3.87 10 -2.26 10
BIRLA SUNLIFE 19.23 6.13 12.76 51.01 1.06 0.38 1 18.21 1 12.08 1
SBI 23.23 6.13 14.66 68.46 1.40 0.34 3 16.61 2 10.48 2
HDFC 6.02 6.13 1.84 26.40 0.68 0.23 8 8.83 7 2.70 7
ICICI 7.31 6.13 2.06 32.06 0.86 0.23 7 8.53 8 2.40 8
TATA 13.19 6.13 7.47 36.52 0.93 0.36 2 14.13 4 8.00 4
RELIANCE -4.43 6.13 -6.17 18.09 0.28 -0.24 12 -15.55 12 -21.68 12 DSP BLACK ROCK 9.98 6.13 4.78 32.27 0.85 0.31 5 11.76 5 5.63 5
KOTAK 9.33 6.13 4.27 30.82 0.82 0.30 6 11.31 6 5.18 6
FRANK TEMPLETON 6.24 6.13 1.75 30.38 0.73 0.21 8 8.52 9 2.39 9 ING INVE MGT LTD 1.72 6.13 -3.36 31.27 0.83 0.06 11 2.08 11 -4.05 11 Source: compiled
Rp = Fund returns, Rm = Market Returns, Rf = Risk Free rate, Alpha (α) = Un systematic risk,
Beta (β) = Co-efficient of systematic risk, SM = Sharpe Measure, TM = Treynor Measure and
Sri Krishna International Research & Educational Consortium http://www.skirec.com
21
-8. CONCLUSION
It is found that the performance of Mutual funds through the Sharpe, Treynor and Jensen’s measures over the select Mutual funds of equity, Debt and Balance funds is well and good and very satisfactory towards the expectations of industry to the possible extent with some considerable fluctuations. Specifically the performance of 16 select mutual funds of equity (growth segment) found very positive based on their total risk and systematic risk in contributing to the return per unit of risk. This can be attributable to the efficiency of managers in portfolio through their skills and forecasting the market volatility to the possible extent to the reality. The performance evaluation of 15 mutual funds of Debt (short term) segment, taken as proxies of industry and best performers, revealed that they are not so good in managing the systematic risk and their contribution of return to per unit of risk was also not so significant over the study period. It was also observed that the performance of select 12 mutual funds of balanced growth segment is so significant per every unit of systematic risk and return contribution of such funds towards per unit of total risk
It is evident from annexure I that the performance of select mutual funds Equity, Balanced growth is same and one under Sharpe, Treynor and Jensen as the coefficient of correlation is highly positive. On the other hand, the performance of Debt growth mutual funds is distinguishing in the case of Jensen with Sharpe and Treynor as the coefficient of correlation is negative.
Sri Krishna International Research & Educational Consortium http://www.skirec.com
22
-GRAPH 1
AVERAGE RETURN (RP) ANALYSIS OF EQUITY, DEBT AND BALANCE GROWTH FUNDS
FOR A PERIOD OF 10 YEARS (2000-2009)
18.77 12.35 41.67 26.03 19.50 34.03 38.14 31.57 39.11 39.85 18.50 28.52 28.55 25.91 31.32 27.46 6.13 9.14
6.81 6.77 7.89 7.61
5.80 7.48 5.03
7.07 8.34 8.63 9.28 4.01 0.00 4.73 18.80 9.76 26.73 30.73 0.00 13.52 0.00 14.81 20.69 3.08 0.00 17.48 16.83 0.00 13.74 9.22 0.00 5.00 10.00 15.00 20.00 25.00 30.00 35.00 40.00 45.00
uti lic
birla sunli
fe sbi
can rebe
co hdfc
hsbc icici tata relia nce dbs chol a dsp black
rock kota k
sund aram
bnp
frank lin te
mplet on
ing inves
tmen ts m
gt ltd Fund
A
vg
R
p
Equity growth Debt growth Balance growth
GRAPH 2
PERFORMANCE APPRAISAL OF EQUITY GROWTH FUNDS BY SHARPE, TREYNOR AND JENSEN’S
10.21
4.50 19.60
11.67 13.82
19.25 21.43 19.75 17.60 20.56 12.55 15.73 15.14 13.45 18.10 13.16 4.08 -1.63 13.47 5.54 7.69
13.12 15.30 13.62 11.47 14.43 6.42 9.60 9.01 7.32 11.97 7.03 25.99 11.07 42.08 30.20 34.80 48.30 48.68 54.36 46.17 51.12 28.72 43.69 39.42 35.33 44.24 26.35 -10.00 0.00 10.00 20.00 30.00 40.00 50.00 60.00
uti lic
birla sun
life sbi
can rebe
co
hdfc hsbc icic i tata relia nce dbs chol a dsp blac
k ro ck kota k sund aram bnp frank lin te
mpl eton ing inve stm ents mgt ltd Fund P e rf orm a nc e v a lue
TM JM SM
GRAPH 3
PERFORMANCE APPRAISAL OF DEBT GROWTH FUNDS BY SHARPE, TREYNOR AND JENSEN’S
-150.00 -100.00 -50.00 0.00 50.00 100.00 150.00
uti lic
birla sunl
ife sbi can
rebe co
hdfc hsb
c
icici tata relia nce dbs chol a dsp bla
ck ro ck kota k sund aram bnp frankl in te
mpl eton ing inve stm ents mgt ltd Fund P e rf orm a nc e V a lue
Sri Krishna International Research & Educational Consortium http://www.skirec.com
23
-GRAPH 4
PERFORMANCE APPRAISAL OF BALANCE GROWTH FUNDS BY SHARPE, TREYNOR AND JENSEN’S
-30.00 -20.00 -10.00 0.00 10.00 20.00 30.00 40.00 50.00
uti lic birla
sun life sbi
can rebe
co
hdfc hsbc icic i tata relia nce dbs chol a dsp blac
k ro ck kota k sund aram bnp frank lin te
mpl eton ing inve stm ents mgt ltd Fund P e rf orm a nc e V a lue
TM JM SM
ANNEXURE I: TEST OF HYPOTHESIS
Ho: there is no significance difference between the performance of select mutual funds in Equity, Debt and Balanced growth segment under Sharpe, Treynor and Jensen’s measures.
1, Spearman rank correlation between Sharpe, Treynor and Jensen’s performance measure of Equity growth mutual funds.
SM TM JM
SM 1
TM 0.937 1
JM 0.937 1 1
** Correlation is significant at the 0.01 level (2-tailed).
2, Spearman rank correlation between Sharpe, Treynor and Jensen’s performance measure of Debt growth mutual funds
SM TM JM
SM 1
TM 0.989 1
JM -0.366 -0.361 1
Sri Krishna International Research & Educational Consortium http://www.skirec.com
24
-3, Spearman rank correlation between Sharpe, Treynor and Jensen’s performance measure of balanced growth mutual funds
SM TM JM
SM 1
TM 0.967 1
JM 0.967 1 1
** Correlation is significant at the 0.01 level (2-tailed).