Open Access
Review
Control of blood glucose in type 2 diabetes without weight loss by
modification of diet composition
Mary C Gannon*
†1,2,3and Frank Q Nuttall
†1,3Address: 1Metabolic Research Laboratory and Section of Endocrinology, Metabolism & Nutrition, VA Medical Center, Minneapolis, MN, USA, 2Department of Food Science & Nutrition, University of Minnesota, USA and 3Department of Medicine, University of Minnesota, USA
Email: Mary C Gannon* - [email protected]; Frank Q Nuttall - [email protected] * Corresponding author †Equal contributors
Abstract
Background: Over the past several years our research group has taken a systematic, comprehensive approach to determining the effects on body function (hormonal and non-hormonal) of varying the amounts and types of proteins, carbohydrates and fats in the diet. We have been particularly interested in the dietary management of type 2 diabetes. Our objective has been to develop a diet for people with type 2 diabetes that does not require weight loss, oral agents, or insulin, but that still controls the blood glucose concentration. Our overall goal is to enable the person with type 2 diabetes to control their blood glucose by adjustment in the composition rather than the amount of food in their diet.
Methods: This paper is a brief summary and review of our recent diet-related research, and the rationale used in the development of diets that potentially are useful in the treatment of diabetes.
Results: We determined that, of the carbohydrates present in the diet, absorbed glucose is largely responsible for the food-induced increase in blood glucose concentration. We also determined that dietary protein increases insulin secretion and lowers blood glucose. Fat does not significantly affect blood glucose, but can affect insulin secretion and modify the absorption of carbohydrates. Based on these data, we tested the efficacy of diets with various protein:carbohydrate:fat ratios for 5 weeks on blood glucose control in people with untreated type 2 diabetes. The results were compared to those obtained in the same subjects after 5 weeks on a control diet with a protein:carbohydrate:fat ratio of 15:55:30. A 30:40:30 ratio diet resulted in a moderate but significant decrease in 24-hour integrated glucose area and % total glycohemoglobin (%tGHb). A 30:20:50 ratio diet resulted in a 38% decrease in 24-hour glucose area, a reduction in fasting glucose to near normal and a decrease in %tGHb from 9.8% to 7.6%. The response to a 30:30:40 ratio diet was similar.
Conclusion: Altering the diet composition could be a patient-empowering method of improving the hyperglycemia of type 2 diabetes without weight loss or pharmacologic intervention.
Published: 23 March 2006
Nutrition & Metabolism 2006, 3:16 doi:10.1186/1743-7075-3-16
Received: 26 February 2006 Accepted: 23 March 2006
This article is available from: http://www.nutritionandmetabolism.com/content/3/1/16
© 2006 Gannon and Nuttall; licensee BioMed Central Ltd.
Introduction
Diabetes generally is classified into two large groups, type 1 and type 2. Type 1 is most common in children. In this type of diabetes, the insulin producing beta cells of the pancreas have been destroyed and thus are unable to make insulin. Therefore, the treatment for type 1 diabetes is insulin replacement, without which the individual will die.
Type 2 is most common in adults, indeed, ~95% of people with diabetes have type 2 diabetes [1]. In this type of dia-betes, the beta cell mass may be reduced [2,3] but more importantly, there is an impaired ability to make and secrete insulin in response to a rise in glucose concentra-tion. Since people with type 2 diabetes tend to be over-weight, weight loss usually is recommended initially. When this fails, oral agents are given. If the latter are not effective, insulin treatment is instituted.
Our long-term objective has been to develop a diet that does not require weight loss, oral agents, or insulin, but still controls blood glucose in people with type 2 diabetes.
In this paper we briefly review data generated in our labo-ratory regarding the effects of protein, carbohydrate and fat ingestion alone or in mixed meals on circulating glu-cose and insulin concentrations. These data provided the rationale for the design of several test diets. We refer to these diets as Low Biologically Available Glucose (LoBAG) diets.
Our studies indicate that a decrease in metabolically avail-able dietary glucose, associated with an increase in protein and fat, over an extended period of time, can significantly lower the integrated blood glucose concentration. The decrease is comparable to that obtained using oral agents and occurs without weight loss.
Background and review
Rationale for changing the type of carbohydrate in the diet
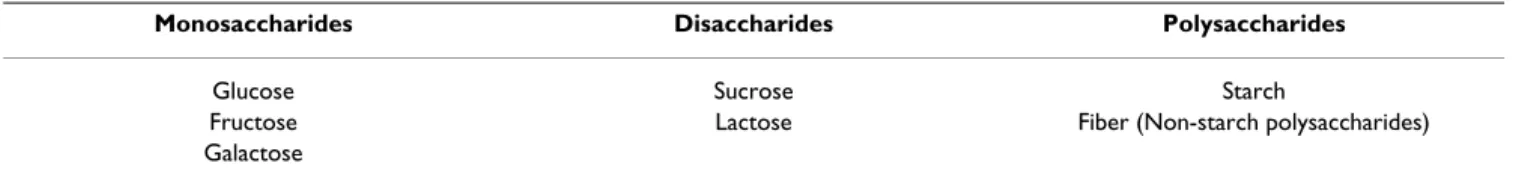
Carbohydrates are classified as monosaccharides, disac-charides and polysacdisac-charides (Table 1).
The monosaccharides are glucose, fructose and galactose. The disaccharides are sucrose and lactose. They all are commonly referred to as "sugars". The sucrose molecule consists of one molecule of glucose condensed with one
molecule of fructose. Thus, sucrose is 50% glucose and 50% fructose. The lactose molecule consists of one mole-cule of glucose condensed with one molemole-cule of galactose. Thus, lactose is 50% glucose and 50% galactose. The polysaccharides are the starches and fiber. The latter also is referred to as non-starch polysaccharide. Starches are polymers of hundreds to thousands of glucose molecules attached to each other forming a large spherical structure. Thus, starch is 100% glucose. The naturally occurring fiber present in foods, by definition, is not digestible, and has little or no effect on blood glucose or insulin [4,5].
Based on a series of studies, our research group has deter-mined that it is the glucose content of foods from the above carbohydrate sources that is largely responsible for raising blood glucose after meals. Consequently, to reduce the glucose content of the diet, the type of carbohydrate in the foods in the diet should be considered, in addition to the total carbohydrate content.
Starches, as found in cereals, potatoes, rice and pasta, etc. are essentially 100% glucose. Sucrose (table sugar) or its surrogate, a mixture of glucose and fructose, as found in fruits, juices, vegetables, and also high fructose corn syr-ups, are approximately 50% glucose. Lactose, found in milk products, is 50% glucose. Thus, theoretically, substi-tuting dietary sugars for starches should reduce the post-meal glucose area response by ~50%.
In single meal, single food studies, we have shown that the glucose area response to sucrose or lactose [6] is indeed ~50–60% of the glucose area response to readily digestible starches [7]. In independent studies, we also demonstrated that both fructose [6,8] and galactose [9] modestly increase the plasma insulin concentration even though they have little effect on the glucose concentra-tion.
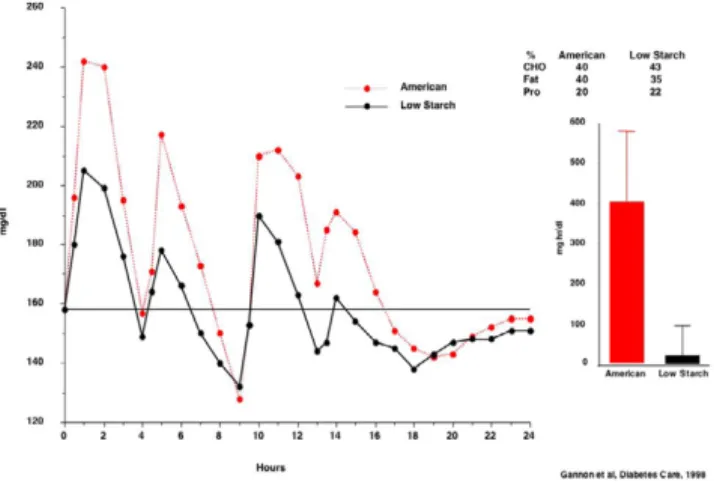
In order to test whether the glucose area response would be reduced when sugars were substituted for starches in mixed meals, we designed two types of mixed meals, which we called American Meals, and Low Starch Meals [10]. They were very similar in protein, carbohydrate and fat content (Table 2). The major difference between the meals was that the low starch meals contained very little starch.
Table 1: Classification of carbohydrates
Monosaccharides Disaccharides Polysaccharides
Glucose Sucrose Starch
Three identical meals of each type were given to people with type 2 diabetes at 0800, 1200, 1700, with a snack at 2100 hours. The meals were isocaloric. The glucose and insulin concentrations were determined over a 24-hour period.
When the net area under the curves was determined, using the fasting glucose concentration as baseline, there was essentially no net increase in the blood glucose concentra-tion over the 24-hour period when the low starch meals were ingested (Figure 1).
Thus, we documented that decreasing the dietary starch content in mixed meals, without a change in total dietary carbohydrate, resulted in a major (96%) decrease in the net 24-hour blood glucose area response, i.e. an even greater response than anticipated.
In summary, our data indicate that the metabolic response to carbohydrates depends upon the type of car-bohydrate. Readily digestible starches, which are 100% glucose, clearly increase the glucose concentration and increase the insulin concentration. Ingestion of sucrose and/or lactose, which are 50% glucose, results in an
increase the plasma glucose which is ~50% less than with starch, and is due largely to the glucose content of these sugars. Sucrose and lactose increase the insulin concentra-tion to a modestly greater extent than expected from the glucose content alone. Overall, in a mixed meal study, substitution of sugars for starches considerably reduced the meal-related increase in plasma glucose over a 24-hour period.
Rationale for increasing the protein content of the diet
Amino acids derived from protein are converted to glu-cose through gluconeogenesis. In 1915, Janney reported that 3.5 g of glucose were produced from 6.25 g of ingested meat protein [11]. Thus, theoretically and actu-ally, for every 100 g protein ingested, 56 g of glucose can be produced. For other proteins the range of glucose pro-duced was 50–84 g.
However, in 1924, Dr. MacLean in England gave 250 g meat, which contains ~50 g protein to a subject with type 2 diabetes whose fasting glucose concentration was ~280 mg/dl [12]. Following ingestion of the beef, the glucose concentration remained stable for the 5 hours of the study. When the subject was given 25 g glucose on a sep-arate occasion, the amount of glucose that theoretically could have been produced from the 50 g protein in the
Glucose (left panel) and insulin (right panel) response to 50 g protein, given in the form of very lean beef to 8 normal sub-jects (bottom, broken lines) and 7 subsub-jects with type 2 diabe-tes (top, solid lines)
Figure 2
Glucose (left panel) and insulin (right panel) response to 50 g protein, given in the form of very lean beef to 8 normal sub-jects (bottom, broken lines) and 7 subsub-jects with type 2 diabe-tes (top, solid lines).
Plasma glucose response in 6 males with untreated diabetes following ingestion of "American meals" (top, broken red line) and "low starch meals" (bottom, solid black line) Figure 1
Plasma glucose response in 6 males with untreated diabetes following ingestion of "American meals" (top, broken red line) and "low starch meals" (bottom, solid black line). Bars indicate 24-hour net glucose area response using the fasting glucose concentration as baseline.
Table 2: Dietary composition of meals
American Meals Low Starch Meals
20% Protein 22% Protein
40% Carbohydrate 43% Carbohydrate
250 g meat, the glucose concentration increased to nearly 600 mg/dl.
With this [12] and other information [13-18], several years ago, we determined the glucose and insulin responses to 50 g of protein given in the form of lean beef to 8 normal subjects [19] and 7 subjects with type 2 dia-betes [20]. When normal subjects ingested the 50 g pro-tein, the plasma glucose concentration remained stable during the 4 hours of the study. When subjects with type 2 diabetes ingested 50 g protein, not only was the glucose stable, it actually decreased (Figure 2).
In normal subjects there was a modest increase in insulin concentration. However, when subjects with type 2 diabe-tes ingested protein, the insulin concentration increased markedly (Figure 2).
In normal subjects, the insulin increase was only 30% of that to 50 g glucose [19], but in people with type 2 diabe-tes, it was equal, i.e. 100% [20]. In addition, ingestion of 50 g beef protein had very little effect on glucose produc-tion either in normal subjects [21] or in people with type 2 diabetes [22].
The studies cited above were single meal studies testing the effect of dietary protein alone. From these and other stud-ies we concluded that in people with type 2 diabetes,
die-Glucose (left panel) and insulin (right panel) responses to ingestion of 50 g fat alone, or 50 g fat + 50 g carbohydrate in normal young subjects
Figure 6
Glucose (left panel) and insulin (right panel) responses to ingestion of 50 g fat alone, or 50 g fat + 50 g carbohydrate in normal young subjects.
Net 24-hour integrated glucose (left) and insulin area responses (right) to ingestion of a 15% protein (red bar) or 30% protein (black bar) diet in 12 subjects with type 2 diabe-tes
Figure 4
Net 24-hour integrated glucose (left) and insulin area responses (right) to ingestion of a 15% protein (red bar) or 30% protein (black bar) diet in 12 subjects with type 2 diabe-tes.
Plasma glucose response in 12 subjects with type 2 diabetes Figure 3
Plasma glucose response in 12 subjects with type 2 diabetes. The response to the control diet (15% protein) is shown in the top, dotted red line. The response to the test diet (30% protein) is shown in the bottom, solid black line).
% total glycohemoglobin response to a 15% protein diet, (top, broken red line) and a 30% protein diet (bottom, solid black line) in 12 people with type 2 diabetes
Figure 5
tary protein is a potent insulin secretagogue. In addition, protein does not increase blood glucose. Protein actually decreases blood glucose, even though amino acids derived from digestion of the protein can be used for gluconeo-genesis. Subsequently we demonstrated that dietary pro-tein acts synergistically with ingested glucose to increase insulin secretion and reduce the blood glucose response to the ingested glucose in people with type 2 diabetes [20,23].
In order to determine the effect of substituting protein for carbohydrate in mixed meals over an extended period of
time we designed a study in which we increased the pro-tein content of the diet from 15% in the control diet to 30% in the test diet, i.e. we doubled the protein content of the diet [24]. To accommodate the increase in protein, we decreased the carbohydrate content from 55% in the con-trol diet to 40% in the test diet. Since 56 g of glucose could be produced from each 100 g protein ingested [11], the carbohydrate in the diet, plus the glucose produced from the additional protein, would represent a potential carbo-hydrate content of 48%. The fat content was 30% in both groups. Twelve people with untreated type 2 diabetes were randomized in a crossover design in which they were on each diet for 5 weeks with a washout period in between. The diets were isocaloric, the subjects were weight stable, and all food was provided.
The plasma glucose concentrations during the 24-hour period at the end of the 5 weeks on the control diet, or 5 weeks on the high protein diet, are shown in Figure 3. The blood sampling was started at 8 am. Breakfast, lunch, din-ner and snack are shown on the X-axis. The differences appear modest. However, when these data are integrated over 24 hours, using the fasting glucose concentration as baseline, the integrated glucose area actually was reduced by 38% on the high protein diet (Figure 4).
In spite of the lower integrated glucose area, the integrated insulin area response was increased by 18% when com-pared to the control (15% protein) diet results.
Most importantly, with the 30% protein diet, the % total glycohemoglobin (%tGHb) decreased from 8.1 to 7.3 (∆
Serum insulin response before (top broken red line) and after 5 weeks on a LoBAG20 diet (bottom solid black line) in 8 men with untreated type 2 diabetes
Figure 9
Serum insulin response before (top broken red line) and after 5 weeks on a LoBAG20 diet (bottom solid black line) in 8 men with untreated type 2 diabetes. Net area (left set of bars), using the fasting insulin concentration as baseline and total area (right set of bars), using zero insulin as baseline, before (red bars) and after 5 weeks on the diet (black bars).
Plasma glucose response before (top broken red line) and after 5 weeks on a LoBAG20 diet (bottom solid black line) in 8 men with untreated type 2 diabetes
Figure 8
Plasma glucose response before (top broken red line) and after 5 weeks on a LoBAG20 diet (bottom solid black line) in 8 men with untreated type 2 diabetes. Net area (left set of bars), using the fasting glucose concentration as baseline and total area (right set of bars), using zero glucose as baseline, before (red bars) and after 5 weeks on the diet (black bars).
Glucose (left panel) and insulin (right panel) responses to ingestion of 50 g fat alone, or 50 g fat + 50 g carbohydrate in subjects with type 2 diabetes
Figure 7
= 0.8) (Figure 5). It decreased from 8.0 to 7.7% during the control (15% protein) diet (∆ = 0.3). The difference was statistically significant by week 2.
In summary, increasing dietary protein from 15% to 30% of total food energy at the expense of carbohydrate resulted in an increased integrated insulin concentration, a decreased 24 hour integrated glucose concentration, and a decreased %tGHb.
These data were presented in 2004 at the Kingsbrook Con-ference on Nutritional and Metabolic Aspects of Low Car-bohydrate Diets [25], and an adaptation of that presentation was later published [26].
Rationale for increasing the fat content of the diet
As shown by us (unpublished data), and others [27], when ingested independently, fats do not effect the circu-lating blood glucose concentration. Fats can delay the digestion and/or absorption of dietary carbohydrates, but this appears be fat-source specific [unpublished data]. Also, when ingested with a carbohydrate-containing food, fats can decrease the glucose concentration, and/or increase the insulin concentration [28]. This effect is likely to be fat-source dependent as well [unpublished data].
An example of fat decreasing the blood glucose concentra-tion is shown in Figure 6. In this study, normal young sub-jects were given 50 g carbohydrate in the form of potato, with or without 50 g butter [29]. When the subjects ingested butter with potato, the 4 hour integrated glucose area was actually negative, whereas it was strongly positive with potato alone. Even though the glucose area response was reduced by butter, the integrated insulin area was approximately the same [29]. The results were similar to those obtained by Collier and associates earlier [30]. The data were of great interest to us since they suggested that dietary fat, or at least butter, may be important in lower-ing the blood glucose in people with diabetes. Therefore, we did the same study in people with type 2 diabetes.
When the same study was done in older people with type 2 diabetes, there was essentially no effect on blood glu-cose by ingestion of butter with the potato when com-pared to the effect of potato ingested alone [31] (Figure 7). This was in contrast to the striking reduction in glucose response noted in non-diabetic young subjects. However, the addition of butter clearly stimulated an increase in insulin concentration in people with type 2 diabetes. The reason for the differences is unknown.
In summary, ongoing studies in our laboratory suggest that the effect of fat on plasma glucose and insulin responses is likely to be complex, and fat-source depend-ent. In any regard, substituting dietary fat for carbohydrate should result in a reduction in post-meal glucose rise in people with type 2 diabetes, which may or may not be due merely to a smaller amount of carbohydrate in the diet. Also, these results indicated to us that data obtained in normal subjects cannot always translate to subjects with type 2 diabetes.
Integrating principles from previous studies
Our previous studies have allowed identification of sev-eral principles regarding macronutrients and blood glu-cose response in people with type 2 diabetes. In our most recent studies, these principles have been integrated into a comprehensive approach to the dietary management of type 2 diabetes. Specifically, the principles involved are 1) a decrease in total carbohydrate content, 2) a decrease the metabolically available glucose content of the diet by changing the composition of the carbohydrate in the diet, i.e. decreasing the starch, and 3) an increase in the protein
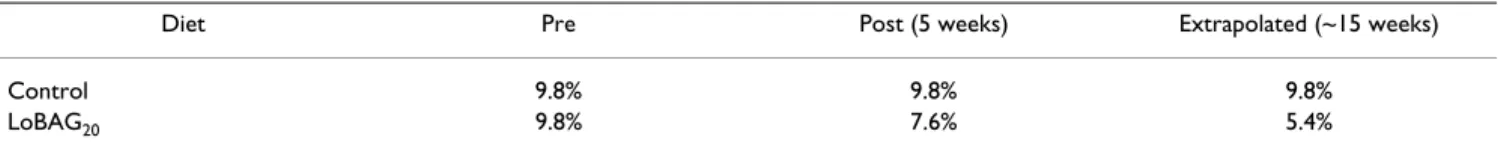
Table 3: Change in % total glycohemoglobin
Diet Pre Post (5 weeks) Extrapolated (~15 weeks)
Control 9.8% 9.8% 9.8%
LoBAG20 9.8% 7.6% 5.4%
Reference range = 4.0 – 6.3%
% total glycohemoglobin during the 5 weeks on the control diet (top, broken red line) and during the 5 weeks on the LoBAG20 diet (bottom, solid black line)
Figure 10
content of the diet. All may contribute to an improvement in blood glucose concentration. Basically, a combination of these incorporated into a diet we refer to as Low B iolog-ically Available Glucose Diets (LoBAG diets).
Based on the above principles, we have designed a diet in which the carbohydrate was decreased from 55% to 20%. The protein was increased from 15% to 30%. The fat was increased from 30% to 50%, keeping the saturated fat constant at ~11%. We refer to this as a LoBAG20, diet with the subscript of 20 added because the diet contains 20% total carbohydrate. Eight men with untreated type 2 dia-betes were studied using a randomized crossover design [32]. Subjects were on each diet for 5 weeks with a wash-out period in between. The diets were isocaloric; subjects remained weight stable. All food was provided.
The postprandial glucose concentrations were markedly attenuated following 5 weeks on the LoBAG20 diet (Figure
8). In addition, the fasting glucose concentration was sig-nificantly decreased as well. The net area response, using the fasting concentration as baseline was significantly decreased (by 65%) on the LoBAG20 diet. Similarly, the total area response, using zero as baseline, was decreased by 45%.
The fasting serum insulin concentrations were similar, but the excursions after meals were significantly greater when ingesting the standard diet, i.e. before the LoBAG20 diet (Figure 9). The net insulin area response, using the fasting insulin concentration as baseline, was decreased by 40%. The total insulin area response, using zero as baseline, was decreased by 25% following 5 weeks on the LoBAG20 diet. Both insulin area decreases were statistically significant.
The %tGHb on the control diet remained stable during the 5 weeks of the study (Figure 10). However, when on the LoBAG20 diet, the %tGHb decreased continually dur-ing the five weeks, and was still decreasdur-ing linearly at the end of the study. The difference was statistically signifi-cant by week 3.
The time required for the %tGHb to reflect a new steady-state glucose concentration is essentially the time required for the turnover of the red blood cell mass, which is 100– 120 days (Figure 11). However, the time required for a 50% change is only 35 days [33]. That is why our studies were conducted for 5 weeks, or 35 days.
On the control diet, the glycohemoglobin was 9.8% and remained unchanged (Table 3). On the LoBAG20 diet, the glycohemoglobin decreased from 9.8% to 7.6% over the 5 weeks of the study. Extrapolating the data to ~120 days (~15 weeks), theoretically, the glycohemoglobin would be 5.4%, which is within the normal range.
Future studies
We are completing a study in which the LoBAG20 diet has
been modified by increasing the carbohydrate content to 30% from 20% with a corresponding decrease in fat. We refer to this as a LoBAG30 diet. This was done because the diet is likely to be acceptable to a greater number of peo-ple. The results to date appear similar to those obtained when the subjects received the LoBAG20 diet.
Summary
Overall, our data indicate that it is possible to improve blood glucose control in people with type 2 diabetes by relatively simple adjustments in diet, and without weight loss.
It should be understood that we consider these studies to be proof of concept studies. Larger studies involving both men and women, and for longer periods of time will be required in order to determine the applicability of this approach to the treatment of diabetes. In addition, further modifications may improve the results and/or make the dietary change more acceptable.
Competing interests
The author(s) declare that they have no competing inter-ests.
Authors' contributions
Both authors were equally responsible for designing the experiments, evaluating the statistics, interpreting the data, writing the manuscript, and organizing the figures and tables.
Acknowledgements
Theoretical rate of change of % total glycohemoglobinfol-lowing an instantaneous change in blood glucose concentra-tion
Figure 11
Publish with BioMed Central and every scientist can read your work free of charge "BioMed Central will be the most significant development for disseminating the results of biomedical researc h in our lifetime."
Sir Paul Nurse, Cancer Research UK
Your research papers will be:
available free of charge to the entire biomedical community
peer reviewed and published immediately upon acceptance
cited in PubMed and archived on PubMed Central
yours — you keep the copyright
Submit your manuscript here:
http://www.biomedcentral.com/info/publishing_adv.asp
BioMedcentral These studies were funded by the American Diabetes Association, with
additional support from the Minnesota Beef Council and the Colorado and Nebraska Beef Councils, and the Department of Veterans Affairs. Most importantly, we would like to thank the volunteers who made these studies possible. We also would like to thank Jennifer Nuttall Martenson, M.D., Kelly Jordan Schwein, Pharm. D., Heidi Hoover, R.D., M.S., Mary Adams, M.T., Jan Thurgood, B.S., and the SDTU Staff for their vital technical assist-ance in these studies.
This review is a modification of a lecture presented at the Nutrition and Metabolism Society Meeting in Brooklyn, New York, January 21, 2006.
As indicated in the text, in this publication we have focused on our own data. We realize others have made major contributions to our knowledge in this general area of research, for which we are grateful.
References
1. Beckley ET: Number of Americans with diabetes nears 21 mil-lion. Diabetes, Obesity, CVD News 2006, January:1.
2. Donath MY, Halban PA: Decreased beta-cell mass in diabetes: significance, mechanisms and therapeutic implications. Dia-betologia 2004, 47:581-589.
3. Butler AE, Janson J, Bonner-Weir S, Ritzel R, Rizza RA, Butler PC: B-cell deficit and increased B-B-cell apoptosis in humans with type 2 diabetes. Diabetes 2003, 52:102-110.
4. Nuttall FQ: Dietary fiber in the management of diabetes. Dia-betes 1993, 42:503-508.
5. Nuttall FQ: Dietary fiber in the management of diabetes; Cur-rent perspective. In Retrospective on Perspectives in Diabetes Edited by: Robertson RP. Alexandria , American Diabetes Association; 2006 in press.
6. Gannon MC, Nuttall FQ, Krezowski PA, Billington CJ, Parker S: The serum insulin and plasma glucose responses to milk and fruit products in Type 2 (non-insulin-dependent) diabetic sub-jects. Diabetologia 1986, 29:784-791.
7. Krezowski PA, Nuttall FQ, Gannon MC, Billington CJ, Parker S: The insulin and glucose responses to various starch containing foods in type II diabetic subjects. Diab Care 1987, 10:205-212. 8. Nuttall FQ, Gannon MC, Burmeister LA, Lane JT, Pyzdrowski KL:
The metabolic response to various doses of fructose in type II diabetic subjects. Metabolism 1992, 41(5):510-517.
9. Ercan N, Nuttall FQ, Gannon MC, Redmond JB, Sheridan KJ: Effects of glucose, galactose and lactose on the plasma glucose and insulin response in persons with non-insulin-dependent dia-betes mellitus. Metabolism 1993, 42(12):1560-1567.
10. Gannon MC, Nuttall FQ, Westphal S, Sheridan KJ, Fang S, Ercan-Fang N: The metabolic response of high carbohydrate, high-starch meals compared to moderate-carbohydrate, low-starch meals in subjects with type 2 diabetes. Diab Care 1998,
21:1619-1626.
11. Janney NW: The metabolic relationship of the proteins to glu-cose. J Biol Chem 1915, 20:321-350.
12. MacLean H: Modern Methods in the Diagnosis and Treatment of Glycosuria and Diabetes. Volume 2nd edition. London , Consta-ble & Co. Ltd.; 1924:1-52.
13. Floyd JC, Fajans SS, Knopf RF, Conn JW: Evidence that insulin release is the mechanism for experimentally induced leucine hypoglycemia in men. J Clin Invest 1963, 42:1714-1719.
14. Floyd JCJ, Fajans SS, Conn JW, Knopf RF, Rull J: Insulin secretion in response to protein ingestion. J Clin Invest 1966, 45:1479-1486. 15. Fajans SS, Floyd JCJ, Knopf RF, Conn JW: Effect of amino acids and
proteins on insulin secretion in man. Recent Prog Horm Res 1967,
23:617-622.
16. Fajans SS, Floyd JC, Pek S, Knopf RF, Jacobson M, Conn JW: Effect of protein meals on plasma insulin in mildly diabetic patients.
Diabetes 1969, 18:523-528.
17. Berger S, Vongaraya M: Insulin response to ingested protein in diabetes. Diabetes 1966, 15:303-306.
18. Rabinowitz D, Merimee TJ, Moffezzoli R, Burgess JA: Patterns of hormonal release after glucose, protein and glucose plus protein. Lancet 1966, 2:454-457.
19. Krezowski PA, Nuttall FQ, Gannon MC, Bartosh NH: The effect of protein ingestion on the metabolic response to oral glucose in normal individuals. Am J Clin Nutr 1986, 44:847-856.
20. Nuttall FQ, Mooradian AD, Gannon MC, Billington CJ, Krezowski PA:
Effect of protein ingestion on the glucose and insulin response to a standardized oral glucose load. Diab Care 1984,
7:465-470.
21. Khan MA, Gannon MC, Nuttall FQ: Glucose appearance rate fol-lowing protein ingestion in normal subjects. J Am Coll Nutr 1992, 11(6):701-706.
22. Gannon MC, Nuttall JA, Damberg G, Gupta V, Nuttall FQ: Effect of protein ingestion on the glucose appearance rate in subjects with type 2 diabetes. J Clin Endo & Metab 2001, 86:1040-1047. 23. Gannon MC, Nuttall FQ, Neil BJ, Westphal SA: The insulin and
glu-cose responses to meals of gluglu-cose plus various proteins in Type II diabetic subjects. Metabolism 1988, 37:1081-1088. 24. Gannon MC, Nuttall FQ, Saeed A, Jordan K, Hoover K: An increase
in dietary protein improves the blood glucose response in people with type 2 diabetes. Amer J Clin Nutr 2003, 78:734-741. 25. Nuttall FQ, Gannon MC: Metabolic response of diabetics to
high-protein diets: Brooklyn, New York. ; 2004.
26. Nuttall FQ, Gannon MC: Metabolic response of people with type 2 diabetes to a high protein diet. Nutrition & Metabolism 2004, 1(1):.
27. May JM, Williams RH: The effect of endogenous gastric inhibi-tory polypeptide on glucose-induced insulin secretion in mild diabetes. Diabetes 1978, 27:849-855.
28. Collier G, McLean A, O'Dea K: Effect of co-ingestion of fat on the metabolic responses to slowly and rapidly absorbed car-bohydrates. Diabetologia 1984, 26:50-54.
29. Gannon MC, Nuttall FQ, Westphal SA, Seaquist ER: The effect of fat with carbohydrate on plasma glucose, insulin, C-peptide and triglycerides in normal male subjects. J Am Coll Nutr 1993,
12(1):36-41.
30. Collier G, O'Dea K: The effect of coingestion of fat on the glu-cose, insulin, and gastric inhibitory polypeptide responses to carbohydrate and protein. Am J Clin Nutr 1983, 37:941-944. 31. Gannon MC, Ercan N, Westphal SA, Nuttall FQ: Effect of added fat
on the plasma glucose and insulin response to ingested potato in individuals with NIDDM. Diabetes Care 1993,
16(6):874-880.
32. Gannon MC, Nuttall FQ: Effect of a high-protein, low-carbohy-drate diet on blood glucose control in people with type 2 dia-betes. Diabetes 2004, 53:2375-2382.
33. Rech ME: Observations on the decay of glycated hemoglobin HbA1c in diabetic patients. Exp Clin Endocrinol Diab 1996,