AUSTRALIAN JOURNAL OF BASIC AND
APPLIED SCIENCES
8414 -2309 : 8178 EISSN
-ISSN:1991
Journal home page: www.ajbasweb.com
Open Access Journal
Published BY AENSI Publication
© 2016 AENSI Publisher All rights reserved
This work is licensed under the Creative Commons Attribution International License (CC BY).
http://creativecommons.org/licenses/by/4.0/
To Cite This Article: Husam A. Eljack, B.O. Elbashir, Yousif H. Alsheikh, Wishah S. Elhag and Kais A. Al-Naimee., Surface Texturing for Enhancement of Photovoltaic Cell Fill Factor& Efficiency Using CO2 Laser. Aust. J. Basic & Appl. Sci., 10(8): 127-132, 2016
Surface Texturing for Enhancement of Photovoltaic Cell Fill Factor &
Efficiency Using CO
2Laser
1Husam A. Eljack, 2Yousif H. Alsheikh, 3B.O. Elbashir, 4Wishah S. Elhagh and 5Kais A. Al-Naimee
1
Department of Applied Physics & Mathematics, Faculty of applied Science & Computer, Omdurman Ahila University, Omdurman- Khartoum – Sudan
2Department of Applied Physics & Mathematics, Faculty of applied Science & Computer, Omdurman Ahila University, Omdurman- Khartoum – Sudan
3
Department of Laser systems- Institute of Laser- Sudan University of Science& Technology- Khartoum – Sudan, University of Tabuk, Department of physics-Tabuk-Kingdom of Saudi Arabia
4Faculty of Science & Art, King Khalid University, Saudi Arabia
5CNR- istituto Nazionale di Ottica Applicata, Largo E. Fermi 6, 50125, Florence, Italy
Address For Correspondence:
Husam A. Eljack, Department of Applied Physics & Mathematics, Faculty of applied Science & Computer, Omdurman Ahila University, Omdurman- Khartoum – Sudan
A R T I C L E I N F O A B S T R A C T Article history:
Received 12 February 2016 Accepted 18 March 2016 Available online 20 April 2016
Keywords:
Surface texturing, Fill factor, polycrystalline, Photovoltaic
Surface texturing plays a critical role in photovoltaic cell performance, affecting both reflectance and light trapping. Polycrystalline cells are typically textured using a laser technique, after applied this technique the surface for Photovoltaic cells would become good absorber to the incident light. The results obtained for two dimension laser textured area 1 cm2, 2 cm2 and 3 cm2 shows that the Fill Factor(FF) and hence the efficiency were increased. FF of the Si-solar cell without texturing was found to be 0.638 and 0.742, 0.752 and 0.768 for the three textured areas respectively.
INTRODUCTION
Nowadays the production of Silicon solar cells and its registered efficiency is a bout of 24% [1].General aspect of several high-efficiency for solar cell concepts required some form of its local processing, that is lab-scale cells has been enabled by photolithography. Photolithography, commonly considered incompatible with the very high throughput demanded by the solar cell industry. Laser has the capabilities to be used in industrial scale local processing due to its an excellent spatial resolution and translational control, which provides similar local processing capabilities that, has simpler processes, and may as such open for industrial scale local processing and high solar cell efficiencies in industrial production. Indeed, local laser processing is making its way into industrial production lines today. Laser processing only be successfully understood if the process does not have a negative impact on the quality of the solar cell materials. So as to develop low damage laser processes, essential insight into the physical interaction between the laser and the solar cell materials is definitely crucial. Using pulsed laser sources, the laser-material interaction will depend on laser pulse duration, laser wavelength and material properties. Essential understanding of these dependencies will give understanding of the laser parameters required for successful laser processes. A useful means of understanding exactly what lasers do within solar manufacturing is to categorize the different laser / material interactions [2]. Essential knowledge about laser-material interaction could be useful in the field of silicon photovoltaic [3].
energy to our world. Crystalline Si (c-Si) solar cells with thicknesses between 150–300 μm have dominated the market for decades and very high efficiency (~25% at one sun) cells of this material have been realized [4].
A single crystalline substrate can be textured by etching along the faces of the crystal planes and the resulting shape of is pyramids like and this is due to crystalline structure of silicon.This type of texturing is known as "random pyramid" texture, and is commonly used in industry for single crystalline wafers [5].
A type of surface texturing known as inverted pyramid texturing, in this type the pyramids are etched down into the silicon surface rather than etched pointing upwards from the surface. For multicrystalline wafers photolithographic technique and mechanically sculpting the front surface using dicing saws or lasers to cut the surface into an appropriate shape are commonly used techniques [6].
Main objective of this paper is the use of surface texturing by means of laser processing and investigation of the influence of laser texturization on the operational properties of the photovoltaic cell in order to enhance the fill factor which leads to efficiency development of the silicon solar cell.
MATERIALS AND METHODS
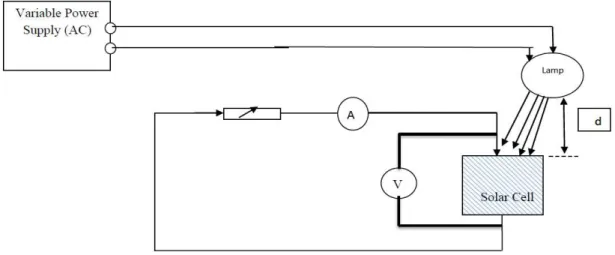
The materials used in this work are given in Fig.1 which also shows the setup arrangement.
Fig. 1: Experimental Setup for recording IV of solar cell (with & without surface texturing).
Materials:
The materials used to complete this work are: 130 W CO2 pulsed laser:
CO2 Laser belongs to gas lasers, and the technologies are still showing development in CO2 lasers, nowadays CO2 lasers are available in both modes of operation and with different powers. The CO2 10.6μm Model FLC9060 with 130 W out power was used in this work [7].
Samples:
Solar cells used in this work were assembled by Solar-Soba, Sudan [8].
Method:
The method used to record the IV curve of the solar cell and calculating the FF was done according to the following sequences:
• The materials were connected as shown in Fig. (1).
• The distance from the lamp to the solar cell was carefully measured and controlled during all measurements.
• The Variac supply was set at 180 V ac to power the tungsten lamp which acts as a source of light. • Solar cell without laser irradiation was used firstly under illuminations a distance of 10 cm.
• Current-voltage relation was recorded by varying the rheostat, the current is changed and the corresponding voltage was recorded.
• The obtained results under this illumination were tabulated and plotted. • Solar cells fill factors were calculated according to [9,10]:
oc sc
m m
V
I
V
I
Where Im is the maximum current, Vm is the maximum voltage, Isc is the short current and the Voc is the open circuit voltage.
The efficiencies were estimated from these values.
• Solar cells were irradiated with CO2 laser with fixed power 30 Watts and fixed laser scanning speed of 400 mm/s.
• The area of irradiations ( surface texturing done by cutting number of grooves in centimeters ) were varied from 1 cm2, 2 cm2and 3 cm2, with 0.1 microns distance of separations and the procedures above were repeated with each solar cell of with the different area of irradiation.
RESULTS AND DISCUSSION
The results of Current-Voltage of the solar cells supported from National Energy Research Center (NERC) - Soba Solar, Sudan (NERC Sudan, 2015), before and after laser surface texturing with the manufacturing features such as dimensions (8* 10 cm2) and max voltage output of (0.5V). The results of the solar cell after laser surface texturing were carried out with three different areas starting by (1 cm2), (2 cm2) and (3 cm2), for each of this textured areas of solar cells the IV characteristics according to setup shown in figure (1) was measured and the Fill Factor parameter in each case was calculated according to equation (1) which gives good indication of the solar cell efficiency. Then each current voltage relation was plotted using Origin Program V.6.
Results of IV and FF before Laser Texturing:
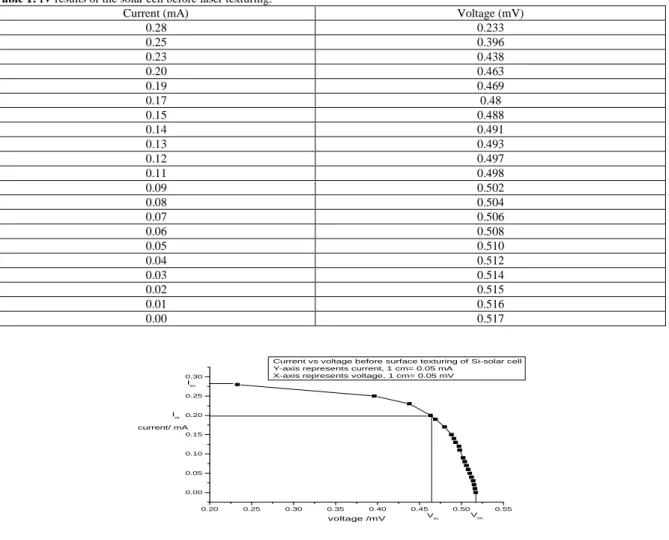
After setup was arranged as shown in figure (1), the IV characteristics were recorded and tabulated in table (1), using Origin Program V.6 the results was plotted in fig. (2.a).
Table 1: IV results of the solar cell before laser texturing.
Current (mA) Voltage (mV)
0.28 0.233
0.25
0.396
0.23
0.438
0.20
0.463
0.19
0.469
0.17
0.48
0.15
0.488
0.14
0.491
0.13
0.493
0.12
0.497
0.11
0.498
0.09
0.502
0.08
0.504
0.07
0.506
0.06
0.508
0.05
0.510
0.04
0.512
0.03
0.514
0.02
0.515
0.01
0.516
0.00
0.517
0.20 0.25 0.30 0.35 0.40 0.45 0.50 0.55 0.00
0.05 0.10 0.15 0.20 0.25 0.30
Vsc
Vm
Isc
Im
current/ mA
voltage /mV
Current vs voltage before surface texturing of Si-solar cell Y-axis represents current, 1 cm= 0.05 mA
X-axis represents voltage, 1 cm= 0.05 mV
Fig. 2.a: IV curve of Si solar cell without laser surface texturing.
oc sc
V
I
V
I
FF
=
max max=
28
.
0
*
52
.
0
465
.
0
*
20
.
0
=0.638 =63.8%Results of IV after Laser Texturing:
The solar cells were textured using CO2 of 130 W power, the power was tuned to 30 Watts to avoid broken of the solar cells using the device software the speed of scanning of the laser pulses was set to 400 mm/s and the area of textured surface were set for three different solar cells to 1cm2, 2 cm2 and 3 cm 2.
The results in this section were subdivided into three parts:
A-
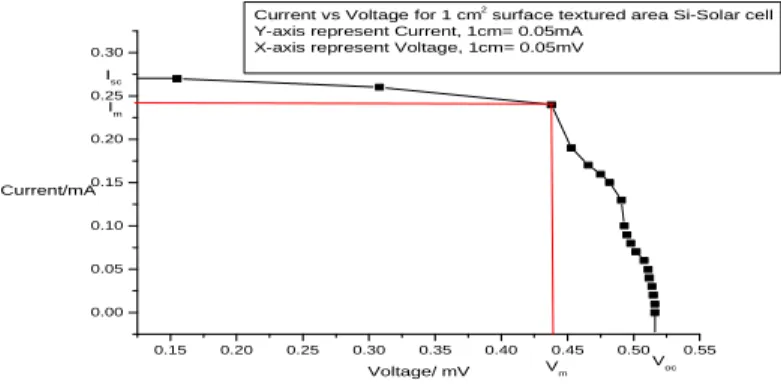
IV Results of 1 cm2 surface textured area:Since each solar cells are identical in their features we expected that the characteristics are also identical, and then carefully carried out the surface texturing in Khartoum Private company that use a 130 Watts CO2 pulsed laser used for decoration process.Using the device software the speed of scanning was set to 400 mm/s and the power set to 30 Watts, and three solar cells were textured each with different area.After surface texturing again the solar cell were used to record their IV characteristics.The results of IV characteristics of 1 cm2 textured surface of the Si solar cell was plotted using origin program V.6, then a large rectangle inside the IV curve of the solar cell was drawn manually and the solar cell parameters were determined and then used to calculate the fill factor parameter of the given solar cell according to eq. (1). This is illustrated in Figure (2.b).
0.15 0.20 0.25 0.30 0.35 0.40 0.45 0.50 0.55 0.00 0.05 0.10 0.15 0.20 0.25 0.30 V m V oc Isc Im Current/mA Voltage/ mV Current vs Voltage for 1 cm2
surface textured area Si-Solar cell Y-axis represent Current, 1cm= 0.05mA
X-axis represent Voltage, 1cm= 0.05mV
Fig. 2.b: IV characteristics of 1 cm2 surface textured Si solar cell.
The parameters obtained from figure (2.b) were:
Isc= 0.27 mA, Voc= 0.52 mV, Imax= 0.24 mA, and Vmax=0.435 mV. And thus according to this values using equation (1) the fill factor is:
oc sc
V
I
V
I
FF
=
max max=
27
.
0
*
52
.
0
24
.
0
*
435
.
0
=0.742 =74.2%It should be mentioned here that the maximum achievable value of the fill factor for Si solar cell is of about 0.85% [9].
B-IV Results of 2 cm2 surface textured area:
For this new textured area, the experiment was repeated and the solar cell was carefully handled in order to avoid damage of the textured surface and without causing dirty in the solar cell which may results in errors and /or decrease in the current and/or voltages values , then the same procedure of measuring IV characteristics were repeated with the same distance and other laboratories conditions (Such as illumination condition) that exist during that when carrying out the IV characteristics of the solar cell before laser surface texturing .
The results of IV characteristics after laser surface texturing was plotted in figure (2.c) using origin Program V.6 and a large possible rectangle inside the IV characteristics was manually drawn and the interested parameters were identified, and then the fill factor was calculated using equation (1).
From this relation the solar cell parameters were found and used to calculate the Fill factor as it did in previous section for either Fill Factor for the solar cell without surface texturing and with (1cm2) surface textured area. And those values give a FF:
→
=
oc scV
I
V
I
FF
max maxComparing this with the previous two values of the FF of the solar cell without surface textured and with (1cm2) area of the textured surface, it is clear that the Fill factor increases rapidly with increasing the textured surface area.
0.20 0.25 0.30 0.35 0.40 0.45 0.50 0.55 0.00
0.05 0.10 0.15 0.20 0.25 0.30 Isc
Current/mA Im
Voltage/mV Current vs Voltage for 2 cm2
surface textured area of Si-solar cell Y-axis represent current, 1 cm =0.05 mA
X-axis represent voltage, 1 cm =0.05 mV
Fig. 2.c: IV characteristics of 2 cm2 surface textured Si solar cell.
C-IV Results of 3 cm2 surface textured area:
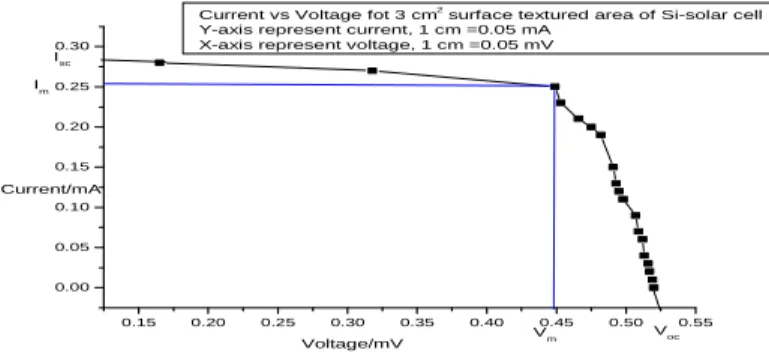
For this new textured area, the experiment was repeated and the solar cell was carefully handled in order to avoid damage of the textured surface and without causing dirty in the solar cell which may results in errors and /or decrease in the current and/or voltages values , then the same procedure of measuring IV characteristics were repeated with the same distance and other laboratories conditions (Such as illumination condition) that exist during that when carrying out the IV characteristics of the solar cell before laser surface texturing . And the obtained results was plotted in figure (2.d)
Again a large possible rectangle inside the IV characteristics the interested parameters were identified and obtained, then the fill factor was calculated using equation (1).
0.15 0.20 0.25 0.30 0.35 0.40 0.45 0.50 0.55 0.00
0.05 0.10 0.15 0.20 0.25 0.30
Isc
Current/mA
Vm Voc
Voltage/mV Im
Current vs Voltage fot 3 cm2
surface textured area of Si-solar cell Y-axis represent current, 1 cm =0.05 mA
X-axis represent voltage, 1 cm =0.05 mV
Fig. 2.d: IV characteristics of 3 cm2 surface textured Si solar cell.
From this relation the solar cell parameters were found and used to calculate the Fill factor as it did in previous section for either Fill Factor for the solar cell with and without surface texturing.
This gives a FF:
oc sc
V
I
V
I
FF
=
max max =525
.
0
*
28
.
0
445
.
0
*
255
.
0
=0.768 =76.8%
Comparing this with the previous two values of the FF of the solar cell with surface textured of (1cm2 and 2 cm2) areas, it was clear that the Fill factor increases rapidly with increasing the textured surface area.
Conclusions:
The following conclusions can be written:
• The voltage-current characteristics of the solar cells at specified distance from tungsten lamp was studied before laser surface texturing and from this characteristics the Fill factor parameter of the solar cell was calculated for the solar cell.
• CO2 130 watts pulsed laser was used ( with 30 Watts power and 400 mm/s speed of scanning) to texture the solar cells and then studied their characteristics after surface texturing, using different solar cells three different areas were textured and the IV characteristics were studied, Fill Factors were obtained and compared with that obtained before laser surface texturing.
• The results of IV characteristics curve of the solar cells without irradiation and with irradiations was compared.
• The effect of increasing area of irradiations on solar cell parameters was studied and compared.
• In conclusion it was found that solar cell efficiency increased as the textured area increased this was clear from the obtained fill factors of the three solar cells with the three different textured areas.
REFERENCES
JosteinThorstensen, 2013. LASER PROCESSING FOR THIN AND HIGHLY EFFICIENT SILICON SOLAR CELLS, PhD thesis Department of Physics Faculty of Mathematics and Natural Sciences, University of
Oslo, [online] Available from http//
www.mn.uio.no/fysikk/english/people/aca/aas/theses/JosteinThorstensen_PhD_Thesis_final_2jun2013.pdf Patrick Henry Drive, SantaClara, 2008. Laser Systems & Processes within Next GenerationPhotovoltaic Manufacturing Equipment, 4thPhotovoltaic Manufacturing Technology Conference, Semicon Europa, Stuttgart.
Becquerel AE, comtRend.Academie.sciences, 9(1839): 561.
Goetzberger, V.U., Hoffmann, 2005. Photovoltaic Solar Energy Generation, Springer-Verlag Berlin Heidelberg, Germany.
Mark, L., Brongersma, Yi Cui and Shanhui Fan, 2014. Light management for photovoltaic's
usinghigh-index nanostructures, nature materials,
https://web.stanford.edu/group/cui_group/papers/Cui_NANOMAT_2014.pdf
Dobrzański, L.A. and A. Drygała, 2013. Surface texturing of multicrystalline silicon solar cells, Journal of Achievements in Materials and Manufacturing Engineering, 31.
CO2 130 W., 2011. Model FLC9060 Product datasheet, China. 8- solar- soba for solar cells, nerc.gov.sd, 2015
Physics of solar cell, 2015. Fill factor [online] Available from: