Abstract—This study optimized the parameters inlet methane concentration, temperature and space velocity to achieve high catalyst activity and stability for methane decomposition. Activity was measured in terms of methane decomposition rate while stability was measured via the sustainability factor. A fluidized bed reactor was employed due to its inherent advantage of avoiding reactor plugging. Optimization was performed using Box-Behnken design of experiments. The highest methane decomposition rate of 0.78 mol/min was obtained with the parameters 50% (v/v) methane feed, 800oC and 20 l/gcat-hr. All three parameters significantly affected the rate of methane decomposition based on ANOVA. A second order polynomial correlating the methane decomposition rate with the three parameters was developed whose R2 value was 0.95. For a high sustainability factor these parameters were 10% (v/v) methane, 600oC and 60 l/g
cat-hr. Only temperature had a significant effect on the sustainability factor. A linear model relating sustainability factor with temperature was also developed. It had an R2 value of 0.71.
Index Terms—Box-behnken, fluidized bed, methane decomposition, optimization
I. INTRODUCTION
Substantial attention has been allotted for research of new sources of energy, sources that need to be renewable, sustainable and environment-friendly [1]. Hydrogen is one of the promising alternatives. It is a promising energy carrier that offers high energy yields [2]. Dubbed as the ‘Fuel of the Future’, hydrogen energy can significantly reduce greenhouse gas emissions and eradicate pollutant emissions from both mobile and stationary sources [1], [3]. There is a growing demand for hydrogen with the emergence of hydrogen economy. Its applications include being used in refineries, as a component of synthesis gas for the manufacture of methanol and ammonia, applications in fuel cells and for the hydrogen fuelled automotive sector [4].
At present, catalytic hydrocarbon reforming is the most developed and economical process for hydrogen production
Manuscript received December 24, 2011; revised February 8, 2012. This work was supported by Department of Science and Technology – Engineering Research and Development Technology (DOST –ERDT).
Marie Loren Y. Palero is with the Chemical Engineering Department, De La Salle University – Manila, 2401 Taft Avenue Philippines (e-mail: m_loren_p@ yahoo.com).
Leonila C. Abella is the Director of Research and Advanced Studies, College of Engineering and a professor at the Chemical Engineering Department, De La Salle University – Manila, 2401 Taft Avenue Philippines (e-mail: [email protected]).
Teddy G. Monroy was with De La Salle University – Manila. He is now with the United Nations Industrial Development Organization, Makati City Philippines (e-mail: [email protected]).
with methane being the most adopted hydrocarbon [5]. However, the hydrogen produced in this process contains carbon monoxide and carbon dioxide. To fully realize the advantages of a hydrogen economy, new methods of producing hydrogen that result in producing minimal or no carbon dioxide along with other greenhouse gases must be looked into [6].
One promising method for producing hydrogen is via Methane Decomposition. Apart from avoiding the production of carbon dioxide, it requires less energy than steam reforming and the solid carbon may have additional value [6].
Much research on Methane Decomposition has been allotted on the improvement of the stability and activity of the catalyst by using different active metals and supports. While methane decomposition has been extensively studied, less attention has been given to optimization of the process [7]. Studies on reaction conditions are less prevalent despite the contributing role they play in the conversion of methane, deactivation of the catalyst and properties of the carbon by-product. Hence, this study optimized the process parameters of methane decomposition to achieve high methane decomposition rate and sustainability factor. Sustainability factor was defined as the ratio between the initial reaction rate and the reaction rate 3 hours after attaining the desired operating temperature.
The Box-Behnken design of experiments was employed. The use of design of experiments offers advantages such as the reduction in the number of experiments that need to be performed which leads to efficient use of materials and time. In addition, it allows the assessment of the relevance and statistical significance of a factor and is able to evaluate the interaction effects among the factors as well [8].
II. EXPERIMENTAL
A. Catalyst Preparation
The catalyst was prepared via Impregnation wherein particular amounts of analytical grade nickel (II) nitrate hexahydrate, copper (II) nitrate trihydrate were dissolved in water. This solution was added to the aluminum oxide powder. The weight ratio of nickel to copper to alumina was 14:6:80. The catalyst was then calcined at 600oC for 6 hours
and was reduced under a flow rate of 20 ml/min of hydrogen at 550oC for 3 hours..
B. Experimental Setup
The fluidized bed reactor (FBR) was made of quartz with
Optimization of Process Parameters of Methane
Decomposition in a Fluidized Bed Reactor Using
Ni-Cu/Al
2
O
3
Catalysts
an inside diameter of 0.063m and a height of 0.55 m. An Ircon Ultimax Plus UX20P Infrared Thermometer was used to monitor the temperature. The temperature was controlled using an Omron E5CZ-R2. Methane, nitrogen and hydrogen flowrates were controlled using Gilmont rotameters. Each rotameter could measure flow rates of up to 100 ml/min in air. They were calibrated using a soap-film calibrator. The effluent stream was analyzed by an online Finnigan Valve Oven Trace GC Ultra. The column used was Hayesep Q 80-100. Nitrogen was used as the carrier gas.
C. Activity Tests
All experiments were conducted at atmospheric pressure. A mixture of methane and nitrogen was fed into the reactor whose amounts depended on the desired inlet concentration. The total flow rate was maintained constant at 100 ml/min. The amount of catalyst used per run was dependent on the space velocity used. The working ranges of the parameters inlet methane concentration, temperature and space velocity are given in Table I. These three factors were chosen as they were found to significantly affect the activity of the catalyst [9], [10].
TABLEI:VALUES OF VARIABLE PARAMETERS
Parameter Values Inlet Methane Concentration (%v/v) 10, 30, 50
Temperature (oC) 600, 700, 800
Space Velocity (l/gcat-hr) 20, 40, 60
The values on Table I were incorporated on the three-level Box-Behnken design. This particular design consists of 15 runs. The actual experimental design is presented in Table II.
TABLEII:BOX-BEHNKEN DESIGN OF EXPERIMENTS
Run
Inlet Methane Concentration
(%v/v)
Temperature (°C)
Space Velocity (l-gcat/hr)
1 10 600 40
2 50 600 40
3 10 800 40
4 50 800 40
5 10 700 20
6 50 700 20
7 10 700 60
8 50 700 60
9 30 600 20
10 30 800 20 11 30 600 60 12 30 800 60 13 30 700 40 14 30 700 40 15 30 700 40
Optimization was done using the Statistical Softwares Design Expert 8.05 and Minitab 14.
III. RESULTS
A. Influence on Methane Decomposition Rate
Table III summarizes the values of temperature, inlet methane concentration and space velocity to achieve high rate of methane decomposition.
TABLEIII:PARAMETERS FOR HIGH METHANE DECOMPOSITION RATE
Parameter Values Inlet Methane Concentration (%v/v) 50
Temperature (oC) 800
Space Velocity (l/gcat-hr) 20
These were obtained from the optimal solution plot generated by Minitab. The optimal solution plot is presented in Fig. 1.
Fig. 1. Optimal solution plot for methane decomposition rate.
The horizontal dashed line represents the highest methane decomposition rate based on the data obtained. The highest methane decomposition rate was 0.78 mol/min. The vertical line, on the other hand, stands for the value of the parameter which will give the highest rate. These are also given by the values which are enclosed in square brackets. Note that the individual plots also show the effect of that particular parameter to hydrogen yield. The x-axis refers to the value of each parameter and the y axis is the rate of methane decomposition.
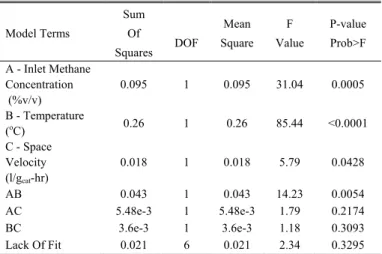
TABLEIV:ANALYSIS OF VARIANCE (ANOVA) FOR METHANE
DECOMPOSITION RATE
Model Terms
Sum Of
Squares DOF
Mean Square
F Value
P-value Prob>F A - Inlet Methane
Concentration (%v/v)
0.095 1 0.095 31.04 0.0005 B - Temperature
(oC) 0.26 1 0.26 85.44 <0.0001
C - Space Velocity (l/gcat-hr)
0.018 1 0.018 5.79 0.0428
AB 0.043 1 0.043 14.23 0.0054 AC 5.48e-3 1 5.48e-3 1.79 0.2174 BC 3.6e-3 1 3.6e-3 1.18 0.3093 Lack Of Fit 0.021 6 0.021 2.34 0.3295
As demonstrated in Fig. 1 under the heading of ‘Methane Concentration’, with an increase in methane concentration in the feed was an increase in the rate of methane decomposition. As more methane is fed, more hydrogen is produced. An increase in methane feed concentration results to more available methane that can come in contact with the catalyst which results to an increase in hydrogen in the effluent.
With regards to space velocity, the lowest value of 20 l/gcat-hr resulted to the highest methane decomposition rate. An increase in space velocity may result to an increase in the number of bubbles in the bed which may exit the reactor without effectively contacting the catalyst [10].
Aside from obtaining the optimal values, the analysis of variance (ANOVA) of the data was generated. The ANOVA table is presented in Table IV. Note that DOF represents Degrees of Freedom
Using a 95% confidence level, P-values less than 0.05 indicated that the model terms are significant while values greater than 0.1000 indicate that model terms are not significant. P-values in between 0.05 and 0.1 have minimal effect on the response. Based on Table IV the parameters that significantly affected the rate of methane decomposition were methane concentration, temperature and space velocity. Out of the three parameters, temperature was the most significant because it had the lowest P-value.
A second order polynomial equation was developed to correlate the value of methane decomposition rate as a function of methane concentration (A), temperature (B), and space velocity (C). The factors included are those deemed significant in Table IV. Equation (1) gives this correlation in terms of the actual values.
C B x
A 01 . 0 10 43 . 8
027 . 0 55 . 0 Rate ion Decomposit
Methane
4 +
+ − − =
− (1)
The R-squared (R2) value of this model is 0.95. To show
how well the model describes the behavior of the system, the predicted methane decomposition rate as a function of the actual methane decomposition rate is presented in Fig. 2.
Fig. 2. Predicted vs. actual values of methane decomposition rate
It is desired that the data points, given by the black squares, lie on the diagonal line on Fig. 2. The more the data points lie close or on the line indicate that the model accurately captures the behavior of methane decomposition rate as a function of the three parameters. Since majority of the data points lie on the diagonal line, it shows that the model given by (1) can accurately predict the Methane Decomposition Rate.
B. Influence on Sustainability Factor
Table V summarizes the values of temperature, inlet methane concentration and space velocity to achieve high
rate of methane decomposition.
TABLEV:PARAMETERS FOR HIGH SUSTAINABILITY FACTOR
Parameter Values Inlet Methane Concentration (%v/v) 10
Temperature (oC) 600
Space Velocity (l/gcat-hr) 60
These were obtained from the optimal solution plot generated by Minitab. The optimal solution plot is presented in Fig. 3.
Fig. 3. Optimal solution plot for sustainability factor.
The sustainability factor is a measure of catalyst deactivation. It is defined as the ratio of the reaction rate after three hours and the initial reaction rate upon reaching the desired temperature. Its value ranges from 0 to 1 with 1 being the most stable. The highest sustainability factor produced by using the parameters in Table V is 0.81.
An increase in temperature resulted to a decrease in the sustainability factor. This result is expected since it is known that an increase in temperature results to a faster deactivation. This is attributed to the formation of encapsulating carbon at high temperatures (Pinilla et al. 2010).
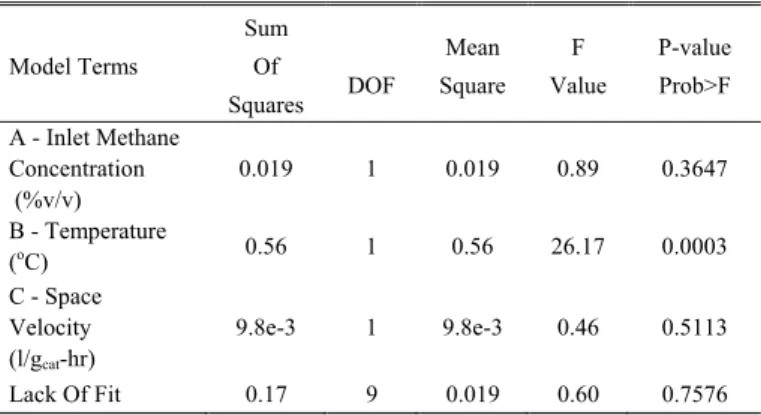
To determine which factors are significant to the sustainability factor the ANOVA (analysis of variance) table for Sustainability Factor is presented in Table VI.
TABLEVI:ANALYSIS OF VARIANCE (ANOVA) FOR SUSTAINABILITY
FACTOR
Model Terms
Sum Of
Squares DOF
Mean Square
F Value
P-value Prob>F A - Inlet Methane
Concentration (%v/v)
0.019 1 0.019 0.89 0.3647 B - Temperature
(oC) 0.56 1 0.56 26.17 0.0003
C - Space Velocity (l/gcat-hr)
9.8e-3 1 9.8e-3 0.46 0.5113 Lack Of Fit 0.17 9 0.019 0.60 0.7576
Notice that the quadratic terms (AB, AC, BC) are not included in Table VI. Design Expert 8.05 chooses the model that gives the highest R2 value. The R2 value is an indication
on how well the model fits the experimental data. For Sustainability factor, the highest R2 was achieved using a
linear model.
known to have a major effect on the catalyst deactivation as higher temperatures resulted to the formation of encapsulating carbon. Coking or the formation of carbon is one of the main reasons of catalyst deactivation [10].
The mathematical correlation between sustainability factor and temperature is in the form of a linear equation. Only temperature is included as it has been established to be the most significant factor as given in Table VI. Equation (2) gives this correlation in terms of the actual values.
B
x
10
3638
.
2
281
.
2
Factor
lity
Sustainabi
=
−
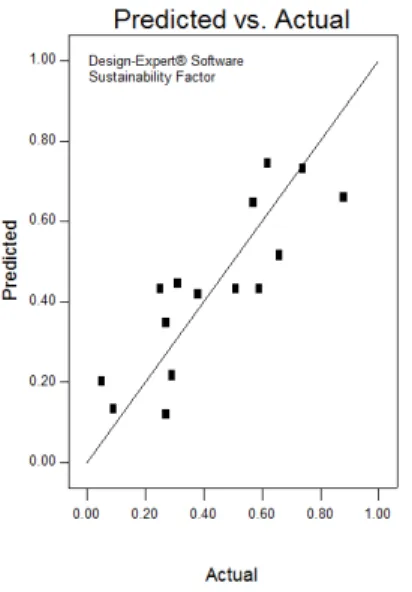
− (2)The R-squared (R2) value of this model is 0.71. To show how well the model describes the behavior of the system, the predicted vs. actual value of the sustainability factor is presented in Fig. 4.
Fig. 4. Predicted vs actual values of sustainability factor
The actual data points, as given by the squares, are scattered around the diagonal line. The diagonal line represents the values for which the predicted values are equal to the actual values. The general trend of the data points follow that of the diagonal line in that it increases from left to right.
IV. CONCLUSION
Optimization of the process parameters to achieve activity and stability for the thermocatalytic decomposition of methane in a fluidized bed reactor was studied. The specific parameters were temperature, inlet methane concentration and space velocity as they were found to have the most significant effect on the activity and stability of Ni-Cu/Al2O3
catalyst. Activity was measured in terms of methane decomposition rate while stability was measured using the Sustainability Factor.
Using the Box-Behnken design of experiments along with the statistical softwares Minitab and Design Expert 8.05, the optimal values of temperature, inlet methane concentration and space velocity were obtained. Also, through the analysis of variance (ANOVA) the most significant parameters were determined.
However, in order to fully understand further the behavior
of Ni-Cu/Al2O3 catalyst, it is recommended that the kinetics
of the thermocatalytic decomposition reaction be investigated.
ACKNOWLEDGMENT
We would like to thank the Chemical Engineering Department of De La Salle University particularly Dr. Luis Razon, Dr. Susan Gallardo and Dr. Carl Estrellan for their constructive comments that helped this study become more relevant and applicable. We also extend our gratitude to Ms. Gladys Cruz for her guidance on the requirements of the ERDT program.
REFERENCES
[1] C. Song, “Global challenges and strategies for control, conversion and utilization of CO2 for sustainable development involving energy, catalysis, adsorption and chemical processing,” Catalysis Today
[Online]. 115, pp. 2-32, 2006. Available: http://www.sciencedirect.com/science/article/pii/S0920586106000757 [2] C. Marcilly, “Present status and future trends in catalysis for refining and petrochemicals,” Journal of Catalysis, 216, pp. 47-62, 2003.
[Online] Available: http://www.sciencedirect.com/science/article/pii/S002195170200129
X
[3] S. Combs, The Energy Report 2008. Texas Comptroller of Public
Accounts [Online] Available:
http://www.window.state.tx.us/specialrpt/energy/renewable/h2.php> [4] T. Rostrup-Nielsen. (2005). Manufacture of hydrogen. Catalysis Today.
106, pp. 293-296. Available: http://www.sciencedirect.com/science/article/pii/S0920586105005432
[5] H. L. Chen, H. M Lee, S. H. Chen, Y. Chao, and M. B. Chang, “Review of Plasma catalysis on hydrocarbon reforming for hydrogen production – Interaction, integration, and prospects,”Applied Catalysis B: Environmental [Online]. 85, pp. 1-9, 2008. Available: http://www.sciencedirect.com/science/article/pii/S0926337308002403 [6] A. Dunker, S. Kumar, and P. Mulawa, “Production of hydrogen by thermal decomposition of methane in a fluidized-bed reactor – Effects of catalyst, temperature and residence time,” International Journal of Hydrogen Energy [Online]. 31, pp. 473-484, 2006 Available: http://www.sciencedirect.com/science/article/pii/S0360319905001266 [7] H. Abbas and W. Wan Daud, “Hydrogen production by methane
decomposition: A review,” International Journal of Hydrogen Energy
[Online]. 35, pp. 1160-1190, 2010. Available: http://www.sciencedirect.com/science/article/pii/S0360319909018059 [8] S. L. C. Ferreira, R. E Bruns, H. S. Ferreira, G. D. Matos, J. M. David, and G.C. Brandao, et al., “Review Box-Behnken design: An alternative for the optimization of analytical methods,” Analytica Chimica Acta [Online]. 597, pp. 179-186, 2007. Available: http://www.sciencedirect.com/science/article/pii/S0003267007011671 [9] P. Ammendola, R. Chirone, G. Ruoppolo, and G. Russo, “Production of hydrogen from thermo-catalytic decomposition of methane in a fluidized bed reactor,” Chemical Engineering Journal [Online]. 154,
pp. 287-294, 2009 Available: http://www.sciencedirect.com/science/article/pii/S1385894709002332
[10] J. Pinilla, I. Suelves, M. Lazaro, R. Moliner, and J. Palacios, “Parametric study of the decomposition of methane using a NiCu/Al2O3 catalyst in a fluidized bed reactor,” International Journal of Hydrogen Energy [Online]. 35, pp. 9801-9809, 2010. Available: http://www.sciencedirect.com/science/article/pii/S036031990901578 X
Marie Loren Y. Palero was born in Quezon City, Philippines. She earned her degree of Master of Science in Chemical Engineering in De La Salle University – Manila on December 2011. She earned her Bachelor’s Degree in Chemical Engineering at the same university in 2009.
She is currently an instructor at the Chemical Engineering Department, De La Salle University, Manila. Her research interests include Nanotechnology and Environmental Catalysis.
Leonila C. Abella was born in the Philippines. She earned her Ph.D. in Chemical Engineering at De La Salle University in 1999. She earned her degree of Master of Science in Chemical Engineering at the University of the Philippines – Diliman in 1980. She earned her Bachelor’s Degree in Chemical Engineering at the Divine Word University in 1978. She is currently the director of Research and Advanced Studies of the College of Engineering, as well as a professor of the Chemical Engineering Department, De La Salle University, Manila. Her research interests Reactive Distillation and Environmental Catalysis. Dr. Abella is a member of the Professional Institute of Chemical Engineers (PICHE).
Teddy G. Monroy was born in Manila, Philippines. He earned his degree of Master of Science in Chemical Engineering in De La Salle University – Manila on 2006. He earned his Bachelor’s Degree in Chemical Engineering at the same university in 1992.
He was an Assistant Professor at the Chemical Engineering Department, De La Salle University. He is currently a consultant at the the United Nations Industrial Development Organization. His research interest is Environmental Catalysis.