ANALYSIS OF STRUCTURAL PLASTICITY IN THE HONEY BEE
BRAIN USING THE CAVALIERI ESTIMATOR OF VOLUME AND THE
DISECTOR METHOD
S
HEENAM B
ROWN1,2, R
UTHM N
APPER2, A
LISONR M
ERCERL11Department of Zoology, University of Otago, P.O.Box 56, Dunedin New Zealand; 2Department of Anatomy
and Structural Biology, University of Otago, Dunedin New Zealand E-mail: [email protected]
(Accepted March 9, 2000)
ABSTRACT
The antennal lobe of the worker honey bee has been used as a model system to address the origins of structural plasticity in the central nervous system. A combination of light and electron microscopy was used to determine total synapse number within an easily identifiable sub-unit of the antennal lobe neuropil, the T4-2(1) glomerulus. The Cavalieri method was applied at the light microscope level to determine a reference volume (Vref) of this glomerulus. Using transmission electron microscopy, the physical disector was used to determine synaptic density (Nv) within the T4-2(1) glomerulus. An estimate of the total synapse number N(syn) was determined by; N(syn) = V(ref) Nv. Newly emerged, 4-day old,10-day old and forager-aged bees were analysed. Results showed that despite a significant increase in T4-2(1) volume with age, the total number of synapses in this glomerulus did not show a corresponding increase. Disturbingly, it is possible that huge variances within age groups, due to one or two outlying data points, could be masking the true trend of synapse number. This variance, the heterogeneous distribution of synapses within this glomerulus and the problems associated with reproducibility of synapse counts are discussed.
Keywords: antennal lobe, Cavalieri method, honey bee, physical disector, synapse, transmission electron microscopy.
INTRODUCTION
The behaviour of the adult honey bee is predictable due to the age-related division of labour present within the colony. Young bees perform duties within the hive (cleaning, nursing, comb-building), while older bees (normally older than 3 weeks) perform duties outside the hive such as guarding and foraging (Winston, 1987). Honey bees are able to alter this behavioural sequence in response to the needs of the colony and behavioural plasticity can be induced through hive manipulations (Lindauer, 1961). For example, newly emerged bees can be induced to forage precociously by removing existing foragers from the colony. Young bees treated with the juvenile hormone analogue, methoprene, also exibit precocious foraging behaviour. Manipulation of the colony structure can also be used to induce forager bees to revert to duties within the hive (Winnington et al., 1996).
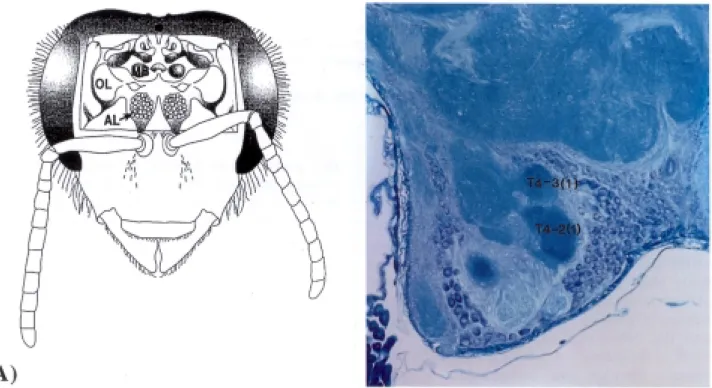
they perform. It is therefore not surprising that the primary olfactory centers of the brain are well developed in the bee. Antennal sensory neurons project to the antennal lobes, forming discrete spheres of neuropil called glomeruli (Fig. 1). In addition to the terminals of these primary sensory afferent neurons, the glomeruli also contain processes of local interneurons and the dendrites of output neurons which project to higher centres in the brain.
of adult life, shows no further increase in volume thereafter, despite radical changes in behaviour. A later study (Sigg et al., 1997) performed a series of experiments which controlled for age, and also addressed the possibility that juvenile hormone might influence glomerular volume changes. Results indicated that significant changes in glomerular volume are triggered in some way by changes in behaviour.
While this previous work explores the idea of activity dependent glomerular volume changes, the ultrastructural implications of activity-dependent plasticity in the ALs of the bee brain remain unknown. To begin to explore the origins of this plasticity, a combination of light microscopy and transmission electron microscopy (TEM) has been used to determine the total synapse number in the T2(1) glomerulus, of bees of different ages (0-day, 4-day, 10-day and forager-aged bees) and in bees performing different tasks (newly-emerged, cleaning/ nurse-bees and pollen foragers). We hypothesise that
the increase in volume is based on an increase in neuronal branching within glomeruli, and may therefore be accompanied by a greater number of synapses.
MATERIALS AND METHODS
ANIMALS
Worker bees were collected from a hive located at the Department of Zoology, University of Otago. Newly emerged adults were collected within 2 h of emergence from their brood cells. To collect bees of known age, a coloured tag was glued to the thorax of newly emerged bees and the bees were then returned to the hive. Bees were considered to be 0 days old for the first 24 h after emergence and their age was measured in daily increments thereafter. Tagged bees were then collected at day 4 and day 10. Forager bees returning from pollen foraging trips were collected at the entrance of the hive.
ELECTRON MICROSCOPY
Brain tissue was initially fixed for 1 hour within the head capsule in 4% paraformaldehyde, 2% glutaraldehyde, 0.04% CaCl2 in 0.225 M cacodylate
buffer. Brains were then removed from the head capsule, placed in fresh fixative and held overnight at 4ºC. After primary fixation, samples were washed several times in 0.225 M cacodylate buffer and postfixed in 1% OsO4 solution in 0.225 M cacodylate
buffer for 1 h at room temperature. The tissue was then rinsed through several buffer changes, followed by several distilled water washes. Samples were en bloc stained using 2% uranyl acetate solution in distilled water for 1 hour, rinsed, then dehydrated through an ethanol series and embedded in Agar 100 epoxy resin. Blocks were polymerised for 48 h at 60ºC. Semi and ultrathin sections were cut on a Reichert Ultracut E ultramicrotome. The 1.5 µm sections were collected on glass slides and stained with methylene blue. These sections were then used for estimating volume using the Cavalieri method. Six 1.5 µm sections from within the T4-2(1) glomerulus were chosen in a random systematic manner from throughout the structure. These sections were reembedded in Agar 100 resin and polymerised for 48 h at 60ºC. Ultrathin sections (80 nm) were cut from these re-embedded blocks, with serial sections collected on formvar-coated copper slot grids. Sections were post stained with uranyl acetate and lead citrate in an LKB Ultrostainer. The sections were then viewed and photographed in a Philips 410LS transmission electron microscope.
STEREOLOGY
i) Volume Estimates
Volume estimates of the T4-2(1) glomerulus were made at the light microscope level. A set of random systematic sections through the T4-2(1) glomerulus were stained and the volume was determined using point counting methods with the Cavalieri estimator of volume (Gundersen et al., 1988). Images of frontal sections of the antennal lobe were projected from an Olympus BHS system microscope to a Panasonic CM140 video monitor using a Panasonic WV-CL500 video camera. An acetate sheet with a grid pattern of 20 mm2 was taped to the monitor at
random angles, to ensure random positioning of the set of points. The number of grid intersections falling on the structure of interest were counted.
within the first 4.5 µm of the glomerulus. In this way a minimum total of 100 points were counted over at least 10 sections. Total grid counts were converted to estimates of volume using the following equation from Gundersen et al., 1988. Vol(object) = t·a(p)·ΣP(object), where t represents section separation, a(p) is the area associated with each point and ΣP(object) is the total number of grid
points counted for the glomerulus.
The viewing position was kept constant for all counts in order to minimise potential errors due to parallax, which could lead to distortion of comparative volume measurements.
ii) Synapse Density
A subset of six sections were selected in a random systematic manner for TEM analysis. The points used for TEM analysis were selected by lying a 15 mm2 transparent grid over the
glomerulus on each of the six 1.5 µm sections. By selecting every eighth grid point, a total of 14 sample points were selected through the glomerulus. The sections were re-embedded and prepared for TEM as previously described. Synapse density was determined using the physical disector method on pairs of electron micrographs taken from consecutive thin sections at the 14 selected sample points. Adjacent section pairs were used due to the small size of the synapses. Synapses were identified according to the following criteria; parallel opposed membranes, evidence of pre and post-synaptic specialisation, presence of synaptic vesicles at the presynaptic terminal. The thickness of ultrathin sections was based on an average thickness, determined by Small's method of minimal folds (as described in Geinisman et al., 1996). A counting frame of known dimensions was placed over the micrographs to reference the inclusion and exclusion edges, and to denote the disector area. The efficiency of the physical disector was maximised for a pair of sections by first using one as a reference section and the other as a look-up section, and then swapping the roles of the two sections. In this way, 14 sample points provided 28 disector pairs. Density (Nv) was calculated using the following equation from Geinisman et al. 1996.
The total number of synapses N(syn) in the total reference volume of the T4-2(1) glomerulus V(ref) was calculated for each animal with the following formula (from Geinisman et al., 1996) N(syn) = V(ref) · Nv.
STATISTICAL ANALYSIS
One-way ANOVA was used to compare the reference volumes and to compare the total synapse numbers between age groups. Where a significant difference between age groups was identified, post hoc Tukey's tests were used. Statistical analyses were
performed using the Minitab software package and a level of significance of 5% was accepted for all tests.
RESULTS
Preliminary investigations described in this study have focussed on the T4-2(1) glomerulus in newly-emerged, 4-day old,10-day old and forager aged bees. The significant increase in volume which can be seen from newly-emerged to forager-aged bees (Fig. 2A), correlates well with results previously found using wax embedded tissue (Winnington et al., 1996, Sigg et al., 1997).
Fig. 2. (A) Mean volume (± SE) of the T4-2(1) glomerulus (F = 27.45 ; p < 0.001). Groups with different letters are significantly different from one another (Tukeys tests, p < 0.05). The n value for each group is shown in parentheses. (B) Mean synapse counts (± S.E). No significant differences were found between the age groups (F = 0.36, p = 0.786).
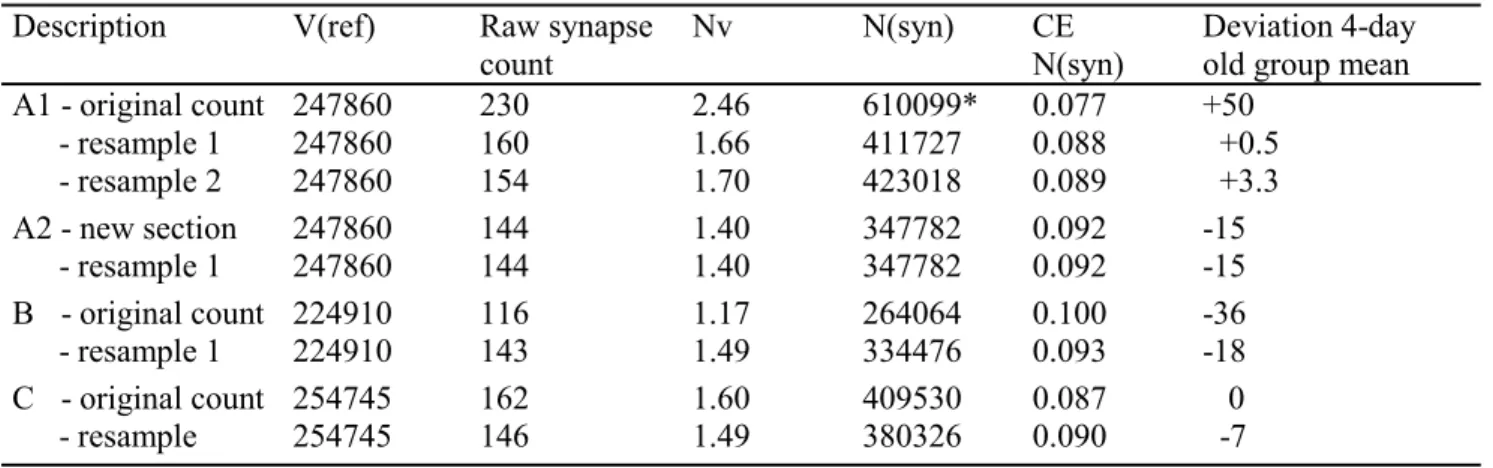
Table 1. Original and resampled synapse count data for three 4-day old bees.
Description V(ref) Raw synapse count
Nv N(syn) CE
N(syn)
Deviation 4-day old group mean A1 - original count
- resample 1 - resample 2
247860 247860 247860
230 160 154
2.46 1.66 1.70
610099* 411727 423018
0.077 0.088 0.089
+50 +0.5 +3.3 A2 - new section
- resample 1
247860 247860
144 144
1.40 1.40
347782 347782
0.092 0.092
-15 -15 B - original count
- resample 1
224910 224910
116 143
1.17 1.49
264064 334476
0.100 0.093
-36 -18 C - original count
- resample
254745 254745
162 146
1.60 1.49
409530 380326
0.087 0.090
Interestingly, although there is a trend for a greater synapse count with age, these data showed that the increase is not statistically significant. As large variances resulted from a small number of outlying data points within each age group, a number of animals were resampled to examine the levels of variability within and between samplings.
As the 4-day old age group showed the greatest variance in total synapse number, this group became the focus of the resampling exercise. Three animals were chosen from this age group, each animal was resampled, photographed and 28 new disector pairs were analysed. For one of the animals (A2), ultrathin sections were also recut then sampled as described. Results are shown in Table 1. Animal A1 showed the highest synapse count from all the age groups analysed, N(syn) = 610099, a count almost 50% higher than the mean synapse count for 4-day old bees. Animal B gave a count 36% lower than the mean synapse count for 4-day old bees. Animal C gave a synapse count which most closely represented the mean synapse count for 4-day old bees. Resample 1 and 2 (animal A1) gave synapse counts 30% and 33% lower than the original count in animal A1. Synapse counts from newly cut sections were 43% lower than the original count.
DISCUSSION
A correlation between a task-linked increase in glomerular volume and total synapse count was not observed. This may be explained by an unacceptably high variance in total synapse number within each age group studied (Fig. 2B). Across all age groups the mean standard error of individual group means was ± 7.7%. The highest standard error was present within the 4-day age group (± 9.5% of the 4-day mean). In contrast, the volume data (Fig. 2A) show much greater consistency with the mean standard error of all individual age groups ± 2.7%.
This high variance in total synapse number is reflected by the difficulty in obtaining reproducible synapse counts within one animal (Table 1). With this lack of reliability between original and recounted values, it is impossible to ascertain which estimation most closely represents the true synapse count. Error coefficients (Table 1) have been calculated for N(syn) (Geinisman et al., 1996) and are within generally acceptable limits, this appears inconsistent with the
Results indicated the number of sample points per animal would need to be increased dramatically to reveal the true mean count. Such a sampling protocol is unlikely to prove feasible for all animals in all groups. Alternatively, the number of animals analysed per age group may be increased (Gundersen and Østerby, 1980). More rigorous statistical analyses are currently being performed to examine more closely the relative contribution of biological versus stereological sampling vanance.
A montage constructed from photomicrographs of the T4-2(1) glomerulus, at the beginning of this study had indicated that synapses exhibited a patchy distribution. It was thought the sampling regime chosen, 28 disector pairs from 14 sample points over six sections would be rigorous enough to overcome any problems associated with this heterogeneous distribution. At this time an assumption was made that these ‘patches’ were homogeneous throughout the entire structure. It would now appear that this assumption was invalid. Synapse distribution is now being tested more fully, by constructing photomicrograph montages at known depths through the glomerulus and comparing resulting patterns of synapse distribution. In the vertebrate study by Geinisman et al., 1996, counts of homogeneous populations of synapses found an intra-animal variation of 8-11%, for total synapses counted. This further suggests that synapse distribution within the T4-2(1) glomerulus is heterogeneous. Correlations between synapse counts and axon diameter may allow us to focus on regions of synaptic neuropil within the T4-2(1) glomerulus and to avoid areas that are devoid of terminal arbors.
A preliminary report of some of the data was presented at the Xth International Congress for Stereology,
Melbourne, Australia, 1-4 November 1999.
ACKNOWLEDGEMENTS
Thanks to the South Campus Electron Microscope Unit, University of Otago for assistance and technical advice. This study was supported by a University of Otago Postgraduate Scholarship to S.B.
REFERENCES
honey bee, Apis mellifera L. (Hymenoptera : Apidae). International Journal Insect Morphology and Embryology 18:145-59.
Gascuel J, Masson C (1991). A quantitative ultrastructural study of the honey bee antennal lobe. Tissue and Cell 23:341-55.
Geinisman Y, Gundersen HJG, Ven Der Zee E, West MJ (1996). Unbiased stereological estimation of the total number of synapses in a brain region. J Neurocytol 25:805-19.
Gundersen HGJ, Bagger P, Bendtsen TF, Evans SM, Korbo L, Marcussen N, Moller A, Nielsen K, Nyengaard JR, Pakkenberg B, Sorensen FB, Vesterby A, West MJ (1988). The new stereological tools: dissector, fractionator, nucleator and point sampled intercepts and their use in pathological research and diagnosis. APMIS 96:857-81.
Gundersen HGJ, Østerby R (1981). Optimizing sampling
efficiency of stereological studies in biology: or ‘Do more less well!’ J Microsc 121:65-73.
Lindauer M (1961). Communication among social bees. Cambridge MA: Harvard Univ. Press.
Morgan SM, Butz-Huryn V, Downes SR, Mercer AR (1998). The effects of Queenlessness on the maturation of the honey bee olfactory system. Behavioural Brain Res 91:115-26.
Sigg D, Thompson CM, Mercer AR (1997). Activity-dependent changes to the brain and behaviour of the honey bee, Apis mellifera (L.). J Neuroscience 17:7148-56.
Winnington AP, Napper RM, Mercer AR (1996). Structural plasticity of identified glomeruli in the antennal lobes of the adult worker honey bee. J Comp Neurol 365:479-90.