Modeling Multiple-country Repeated
Cross-sections. A Societal Growth Curve
Model for Studying the Effect of the
Economic Crisis on Perceived Ethnic
Threat
Bart Meuleman
1, Eldad Davidov
2& Jaak Billiet
1 1University of Leuven
2
University of Cologne and University of Zurich
Abstract
While multiple-country repeated cross-sectional datasets are increasingly available, few cross-national studies fully exploit the richness of such data. This paper contributes to the practical knowledge on statistical analysis of cross-national time series data. For that pur-pose, we present a novel application of a societal growth curve model (Fairbrother, 2014) analyzing the pressing question whether the economic crisis of the past years has stirred up immigration-related threat perceptions among European citizens. Concretely, we analyze six rounds of European Social Survey data (2002-2012) to investigate whether indicators of economic downturn are systematically related to increased levels of economic and cultural threat. The societal growth curve modeling approach makes it possible to set longitudinal effects apart from cross-sectional differences and thus overcomes the weaknesses of analy-ses relying on single-shot cross-sectional data. Our results provide evidence that grow-ing unemployment as well as decreasgrow-ing rates of economic growth instigate feelgrow-ings of economic threat. Rather than affecting citizens’ opinion uniformly, the economic crisis is found to have the strongest impact on economic threat among low educated people. While this study provides evidence that economic shocks affect concerns that immigration is bad for the economy, feelings of cultural threat are not affected by economic crises.
Keywords: group conflict theory, economic vs. cultural threat, societal growth curves, European Social Survey
Acknowledgments
The work of the first author was supported by a Brain-be project funded by BELSPO (grant agreement BR/175/A5/PUMOMIG). The second author would like to thank the University of Zurich Research Priority Program "Social Networks" for the support dur-ing work on this study.
Direct correspondence to
Bart Meuleman, Institute for Social and Political Opinion Research, University of Leuven, Belgium
E-mail: [email protected]
Over the course of the last decades, cross-national data collections – such as the
European Social Survey (ESS), the European Values Study (EVS), or the Interna-tional Social Survey Programme (ISSP) – have accumulated trend data rendering it possible to monitor change in citizens’ values, attitudes and behavior. These data can be characterized as cross-national repeated cross-sections: Multiple countries are observed across a time range, but at each point of observation a different cross-section of the national population is surveyed. The potential contribution of this design to social scientific insights is very large. The longitudinal aspect can help to partially overcome the well-known but crucial causality problem that single-shot cross-national studies suffer from. Cross-sectional studies can demonstrate that dif-ferences in a context variable tend to coincide with particular patterns in public opinion at a given time point. Such correlational patterns only provide a very shaky empirical foundation to make claims about causality. Cross-national trend data can provide additional insights in the temporal order of the relationship, which is a nec-essary (yet insufficient) condition for causality. However, according to the seminal work of Campbell and Stanley (1966; see also Shadish, Cook & Campbell, 2001), a multi-location time series design can provide interesting insights, especially when experimental manipulation is not feasible.
conditions are related to prejudice, perceived threat, and anti-immigrant sentiments (for reviews, see Ceobanu & Escandell, 2010; Hainmueller & Hopkins, 2014). Studying the development of exclusionary attitudes over time in multiple countries, however, provides a more stringent test of the causal impact of economic condi-tions (for examples, see Meuleman, Davidov & Billiet, 2009; Semyonov, Raijman & Gorodzeisky, 2006). The societal growth curve approach allows disentangling longitudinal and cross-sectional effects of economic context.
Concretely, we employ the societal growth curve model in the current study to address the following research questions: (1) In what way has the prevalence of perceived immigrant threat in European societies evolved in the period before and after the outbreak of the economic crisis in 2008? (2) Are the observed develop-ments in perceived threat driven by changes in economic conditions due to the crisis? (3) Does the crisis affect threat perceptions across the whole population, or are crisis effects instead contingent on social positions in the form of education level? To answer these questions, we analyze data from the European Social Sur-vey (ESS) across the years 2002-2012, providing information about immigration-related threat perceptions in 28 countries before, during, and after the outbreak of the economic crisis.
The paper starts by providing the theoretical background and formulating our research hypotheses. Second, we explain how societal growth curve models can be used to test our hypotheses using multiple-country repeated cross-sections. Sub-sequently, we present the data and measures we use. The paper concludes with a discussion on the results of the analysis and the usefulness of the societal growth curve model.
Theoretical Background:
A Dynamic Formulation of Group Conflict Theory
conse-quences (e.g., prejudice or voting behavior) (Harell et al., 2012; Lucassen & Lub-bers, 2012; Sniderman, Hagendoorn & Prior, 2004).
According to GCT, majority-members’ threat perceptions are influenced by contextual factors, such as economic conditions or immigrant group size (Blalock, 1967). In times of poor economic conditions, the material goods that are the object of intergroup competition become scarcer, thereby leading to an intensification of (mainly economic) threat perceptions. Furthermore, a more sizeable immigrant group implies that the native population is confronted with a larger number of com-petitors, again causing intergroup competition to become stronger. Several empiri-cal studies have confirmed that anti-immigration attitudes are more widespread in adverse economic contexts (Quillian, 1995; Schneider, 2008; Semyonov et al., 2006) with high levels of ethnic diversity (Lahav, 2004; Quillian, 1995; Scheep-ers, Gijsberts & CoendScheep-ers, 2002; Schneider, 2008), although these effects could not always be replicated (Sides & Citrin, 2007). A serious limitation that can be often observed in this body of research is its reliance on cross-sectional data sources (Hainmueller & Hopkins, 2014). However, the finding that international differences in economic performance coincide with variations in public opinion at a given time point hardly proves that economic downturns may be a cause of threat perceptions. After all, numerous other variables – such as the immigration history of a country, the broader political climate, the media, or the implemented migration and integra-tion policies – might intervene in the relaintegra-tionship between economy and public opinion (Schlueter, Meuleman & Davidov, 2013).
A dynamic reformulation of GCT (Coenders & Scheepers, 1998; Meuleman et al., 2009) instead proposes to study how attitude changes are driven by changes in the actual level of competition. The theoretical rationale for this focus on changes is that sudden shifts in economic prosperity or immigrant presence could have more substantial effects on public opinion than high but stable levels of actual competi-tion (Hopkins, 2010). Sudden changes affect labor, housing, and other markets more strongly than slow-paced evolutions (Olzak, 1992) and usually receive wide media coverage (Schlueter & Davidov, 2013; McLaren, Boomgaarden & Vliegenthart, 2017). A crucial methodological advantage of focusing on longitudinal changes is that it offers a more stringent test of the causal relationships articulated in the GCT.
which threat perceptions are formed. During periods of unfavorable economic con-ditions economic concerns come to the fore in the formation of threat perceptions, while cultural concerns are suppressed.
A limitation of existing studies is that they span periods with only relatively small economic fluctuations. Yet, the recent economic turmoil might be conceived as a new critical juncture that sets in motion different mechanisms, compared to those active during more modest economic fluctuations (Billiet, Meuleman & De Witte, 2014; Semyonov et al., 2006). Little is known about the impact of a serious economic crisis. This study therefore tests whether the economic downturn Europe has been experiencing in the aftermath of the 2008 financial crisis has affected economic and cultural threat perceptions among majority-group citizens. Based on GCT, we expect that threat perceptions have increased in Europe since the begin-ning of the crisis in 2008 (Hypothesis 1) and that changes in threat perceptions in European countries are related to country-level changes in economic conditions
(Hypothesis 2). Furthermore, building on Pichler’s (2010) argument on the shifting foundations of threat perceptions, we expect that indicators of the economic con-text will have a stronger impact on economic than on cultural threat perceptions
(Hypothesis 3). Finally, the individual-level component of GCT suggests that the threat-inducing effect of the crisis might be stronger among individuals in social-structurally vulnerable positions in the form of low education levels, whereas there is no such effect among those who are highly educated (as a proxy for being well off). This would, in other words, imply that the effect of the crisis on threat percep-tions interacts (negatively) with education (Hypothesis 4).
Modeling Multiple-Country Repeated
Cross-sections: Societal Growth Curves
The aforementioned hypotheses can be tested by means of multiple-country repeated cross-sectional data, that is, data consisting of several countries that are observed at different time points, by surveying a large number of individuals. Such data contain a three-level hierarchical structure, with countries at the highest level, country-years at the middle level, and individuals at the lowest level. This nested structure can be taken into account by fitting a societal growth curve model (Fair-brother, 2014) that estimates how an individual characteristic evolves over time within countries - see equation (1).
0 1 1 0 0
β β ν ν
= + + + + +
itj tj j tj j tj itj
Y Time Time u e (1)
( )
2~itj 0,σe
( )
2 0tj ~ 0,σuu N
(
2)
0 ~ 0, ν0
ν j N σ
(
2)
1 ~ 0, ν1
ν j N σ
Yitj represents a measured characteristic (e.g. perceived threat) for an individual
i, surveyed at time point t in country j. β0 is the grand intercept in this model,
referring to the predicted level of Y at the beginning of the time series averaged across all countries. By including the variable ‘time’ as a fixed effect at the second level (country-years), the overall evolution of the dependent variable Y is modeled, which is an essential feature of the growth curve approach. In equation (1), the time effect is linear (with an effect parameter β1), but the model can be extended in a straightforward way to include more complex functional forms of growth. Random effects for the intercept (ν0j) and the slope (ν1j) of the growth curve are included to accommodate the country specificity of threat developments over time, that is, how the growth curve in a specific country deviates from the average developmental pattern. The model also contains random components at the middle (uotj) and lowest (eitj) levels. uotj reflects how country-years deviate from the country-specific growth curve. eitj captures the individual-level residuals. This approach shows similarity to conventional multilevel growth curve models for panel data (e.g. Andreß, Golsch & Schmidt, 2013). The main difference is that the occurrence of repeated measure-ments is not at the level of individuals, but rather at the level of the countries. As a consequence, the intercepts of the growth curve are situated at the level of the country-years (level 2), and the intercept variation is captured by its variance com-ponent ν0j. The slope of the growth curve is estimated by the linear effect of the time variable, the slope variation is absorbed in its variance component ν1j. As such, the societal growth curve model is essentially a classical two-level growth curve model for countries, with an additional layer of individuals underneath.
One could add to this baseline model individual-level as well as contextual predictors. Of crucial importance is that the societal growth curve approach makes it possible to partition the impact of contextual variables into a cross-sectional and a longitudinal component. This decomposition takes place by simultaneously including a time-invariant (i.e., the average over the complete time series) and a time-varying component (the year-specific deviation of that average) of the contex-tual variables into the models (Fairbrother, 2014; this decomposition is similar to disentangling between- and within-cluster covariate effects in clustered data – see Neuhaus & Kalbfleisch, 1998).
observed time series (e.g., the average unemployment rate of a specific country between 2001 and 2012). The parameter for this time-invariant component captures the cross-sectional relationship between context and threat levels, irrespective of changes over time. The time-varying component is calculated as the deviation of the observed value at a specific time point from the country average over the whole time series (Ztj - Z•j). The parameter for the time-varying component describes lon-gitudinal relationships, that is, how variations in perceived threat over time within countries (from their longitudinal average) are associated with changes in a contex-tual variable. Because Z•j and (Ztj - Z•j) are included simultaneously in the model, the parameter for the time-varying component reflects the pure longitudinal effect, controlling for its average over the whole time series. If there is a causal impact of a particular context variable, its longitudinal effect should be different from zero.
Finally, cross-level interactions between the longitudinal variations of contex-tual variables and individual characteristics can be included to investigate whether the growth curve components (intercept and slope) vary across different categories of individuals.
Materials and Methods
Dataset: European Social Survey, 2002-2012
We analyze data from a time series of six rounds of the European Social Survey (ESS), spanning the period before and after the crisis (2002-2012). This multi-location time-series design is one of the strongest alternatives when experimental manipulation is not feasible, under the condition that the event that should bring about change in the time series (the quasi treatment) is well specified a priori (which is the case here) (Campbell & Stanley, 1966: 38; see also Shadish, Cook & Campbell, 2001). The logic behind it is that it is unlikely that particular quasi-experimental treatments are followed by an outcome change in multiple locations, if the effect is not causal.
Measurements
Dependent variables – The ESS core module contains two items that were designed to measure economic and cultural threat perceptions.1 Respondents are invited to position themselves on an 11-point scale of which the endpoints refer to perceiving immigration as a disadvantage or as an advantage for the economy (‘Would you say it is generally bad or good for [country]’s economy that people come to live here from other countries?’) or the cultural life (‘Would you say that [country]’s cultural life is generally undermined or enriched by people coming to live here from other countries?’). The scales are reversed, so that 0 indicates low and 10 high threat. While these items have been used as indicators of a single concept of general group threat in previous research (Sides & Citrin, 2007), we analyze them separately to render the difference between economic and cultural sources of threat visible (for a similar approach, see Pichler, 2010).2 This approach is justified by the fact that both items contain – especially at the individual and country-year level – considerable unique information. The correlation between economic and cultural threat equals 0.60 at the individual level, 0.71 at the country-year level, and 0.83 at the country level, implying that the two items share 36.0, 50.1, and 69.3 percent of their vari-ance at these respective levels. These unique components allow sufficient room for differential effects of individual as well as contextual predictors (see below).
Contextual predictor variables – All contextual variables were retrieved from the Eurostat website (http://ec.europa.eu/eurostat). The economic context is captured by means of the real GDP growth rate (Eurostat indicator nama_gdp_k)
and the harmonized unemployment rate (Eurostat indicator une_rt_a). Changes
in immigrant group size are measured by the inflow of foreign immigrants (Euro-stat indicator migr_imm1ctz) per capita. We include the time-invariant as well as the time-varying components of these contextual variables. Concretely, we aver-age contextual information over two years to indicate the time-varying component referring to a specific time point (e.g., the average unemployment rate of 2001 and 2002 is taken to predict threat perceptions in the 2002 survey). This choice reflects
1 The core module of the ESS contains a third item measuring immigration-related group threats (ESS item imwbcnt). Because the wording of this item is very general and does not refer to specific sources of threat, we do not include it in the analysis. 2 The use of single items instead of multi-item batteries makes it difficult to assess the
that the impact of economic contexts may be lagged. The time-invariant component is the average across the whole time series (2002-2012).
Individual-level predictor variables – In order to control for compositional differences – that is, the fact that European populations have a different composi-tion in terms of several individual characteristics - we include a series of variables capturing social-structural positions and cultural dispositions that were shown to be relevant in previous research (e.g. Coenders & Scheepers, 1998; Meuleman, Davi-dov & Billiet 2009; Meuleman, Abts, Slootmaeckers, & Meeusen, 2018; Semyonov, Raijman & Gorodzeisky 2006). The social-structural variables are gender, age, number of years of education completed, degree of urbanization (from 1 = coun-tryside to 5 = big city), employment status (distinguishing self-employed, higher service class, white collar, blue collar, unemployed, retired, in education, doing housework, disabled, and other) and subjective income. The latter variable is used as a proxy for the household income and is operationalized by the individual assess-ment of whether one finds it difficult or comfortable to live on the present income (1 = very difficult; 2 = difficult; 3 = coping; 4 = living comfortably). Based on previous literature, we expect people in socially vulnerable positions, that is with lower education and lower subjective income, the unemployed and the low-skilled workers to feel more threatened by immigrants. Furthermore, older individuals are expected to be more negative toward immigrants (e.g., Hercowitz-Amir, Raijman & Davidov 2017; Meuleman, Davidov & Billiet, 2009; Semyonov, Raijman & Goro-dzeisky, 2006).
Religious involvement is the mean of items measuring subjective religiosity (ESS item rlgdgr), attendance of religious services (rlgatnd) and frequency of pray-ing (pray). Political orientation is measured by self-placement on a left (0) to right (10) scale. This scale was categorized into three groups, namely, left (scores 0-4), center (5), and right (6-10). To handle the considerable nonresponse of this item, we added a fourth category for the missing values. Secular persons as well as left-leaning individuals are assumed to express lower levels of perceived ethnic threat (see, e.g., Hercowitz-Amir et al., 2017).
Descriptive statistics for the variables are displayed in Appendix 2.
Statistical Modeling
the analysis. Apart from political orientation – where a separate category for the missing values is created – we applied listwise deletion to deal with the item non-response. The amount of missing values in the data was quite limited and lower than 5% on average ranging between 4.6% for the variable economic threat and 0.1% for gender. Therefore, we do not expect that using listwise deletion distorts our conclusions (see Schafer & Graham, 2002).
Results
Trends in Perceived Threat, 2002-2012
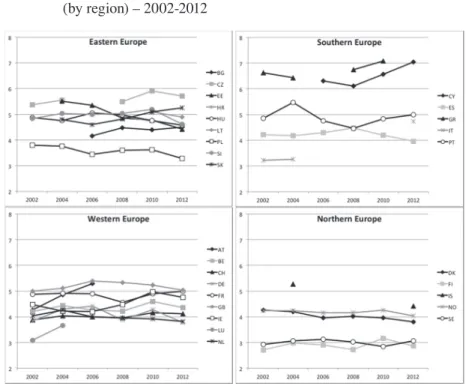
Before presenting the societal growth curves, we explore the development in threat perceptions over the period 2002-2012. Considerable cross-country differences can be observed in the level of perceived economic threat (see Figure 1), rang-ing from as low as 3.36 (Luxemburg, 2002) to as high as 7.22 (Cyprus, 2012) (on a scale from 0 to 10). These differences follow regional patterns, with the lowest levels of economic threat in Northern Europe and the highest scores in Eastern and Southern Europe. Longitudinal developments within countries appear to be smaller than between-country differences. The most notable change is observed in Ireland, where economic threat shifts from 4.04 (2006) to 5.85 (2010). Progression of economic threat is patterned along regional lines as well. In the Nordic coun-tries, which already displayed comparatively low threat in 2002, economic threat perceptions tend to stabilize or even diminish. In Southern Europe, by way of con-trast, a clear upward trend is notable. It is revealing to observe that between 2008 (the outbreak of the financial crisis) and 2010 (when its impact on the economy was becoming clear), economic threat perceptions became more prevalent in 20 coun-tries, while they became weaker in 3 countries only (see also Kuntz et al., 2017).
Figure 1: Development of perceived economic threat in 28 countries (by region) – 2002-2012
Figure 1 Development of perceived economic threat in 28 countries (by region) – 2002-2012
Figure 2: Development of perceived cultural threat in 28 countries (by region) – 2002-2012
Societal Growth Curves: The Longitudinal Impact of
Economic Conditions
To examine the effects of economic conditions on threat perceptions, we estimate a series of societal growth curve models for economic and cultural threat (see Tables 1 and 2). An empty three-level model (not shown) indicates that economic and cul-tural threat perceptions vary significantly across individuals, country time points combinations as well as countries. The lion’s share of the total variation can be attributed to the individual level. Variations of threat between countries (7.5% of the total variance for economic threat vs. 12.9% for cultural threat) are considerably larger than longitudinal variations of threat within countries. Notably, the longitu-dinal variation of economic threat (2.0%) is more than double than that of cultural threat (0.9%).
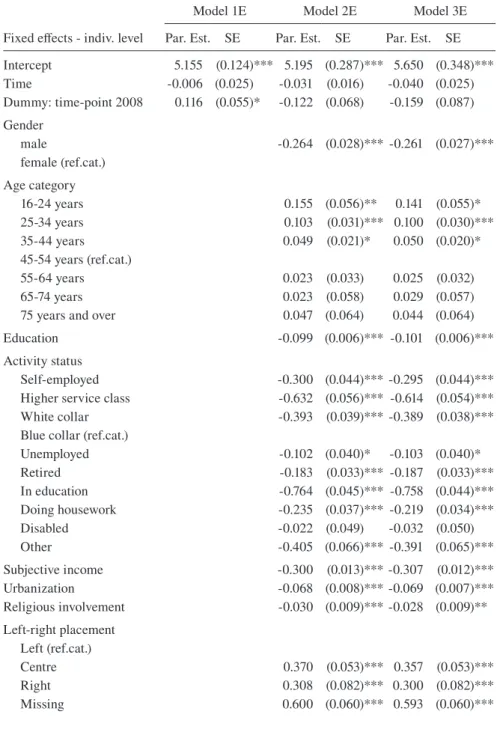
Models 1E (Table 1) and 1C (Table 2) estimate growth curves by including time as a predictor. A linear time trend combined with a dummy for 2010 (picking up an additional change in 2010 over and above the linear process) provides the most appropriate description of the data. For both forms of threat, the linear time effect is insignificant, but does have significant random slope variation. This means that, on average across all countries, threat perceptions remain stable between 2002 and 2012; the linear trend does vary cross-nationally, however, with increases in some countries and decreases in others. One particular ripple disturbs the linear development of threat perceptions. The dummy for 2010 has a significant and posi-tive effect. In 2010 (i.e., following the outbreak of the financial crisis), economic and cultural threat perceptions were respectively 0.116 and 0.120 units higher than what is expected based on the general time trend. This pattern confirms that immi-grant-related threat perceptions have increased across Europe after the 2008 crisis (supporting Hypothesis 1), although the magnitude of the increase should not be overrated. Furthermore, the 2010 increase in threat perceptions was instantaneous and had receded by 2012.
is among the strongest predictors of perceived threat: left-leaning individuals feel culturally as well as economically less threatened. Apart from these similarities, three individual variables have a differential impact. Males feel economically less threatened than females, while no gender gap is present for cultural threat. Further-more, the highest levels of cultural threat are found among respondents between the ages of 55 and 74 years, while this age group does not deviate from the reference category (aged 45-54 years) on economic threat. Finally, religiosity has a small tempering effect on economic threat but shows no significant relationship with cul-tural threat.
To find out whether changes in the economic context affect threat percep-tions, Models 2E and 2C include the country time-invariant (cross-sectional) and the time-varying (longitudinal) components of two economic variables, namely, the unemployment rate and the real GDP growth. The longitudinal components of unemployment and economic growth have a significant impact on feelings of eco-nomic threat. In times of rising unemployment rates and plummeting growth rates, citizens’ anxieties that immigration poses a threat to the national economy gain momentum (supporting Hypothesis 2). These longitudinal effects of economic con-text are substantial. Spain, for example, experienced an increase in unemployment rate of 12.4 percentage points and a drop in economic growth of 3.8 percentage points between 2005-6 (the 3rd ESS round) and 2010-11 (the 5th ESS round). Model 2E predicts that the combination of these economic shocks increased economic threat perceptions across the whole Spanish population with more than 0.6 points, which implies a considerable increase. It is of crucial importance to reiterate that these parameters refer to longitudinal effects, capturing the impact that national economic conditions at particular time points have on the evolution of threat per-ceptions within countries. At the same time, no significant cross-sectional rela-tionships between the average country levels of economic context and economic threat are detected. Model 2E explains 7.8% of the individual variation, 42.7% of the variation between country-years and 25.1% of the between-country differences in economic threat. The model is thus quite successful in explaining why a coun-try’s level of economic threat is higher at particular time points than in other years. Note that the effect of the dummy for 2010 has become insignificant, indicating that the high levels of economic threat in that particular year are indeed driven by economic changes.
2C explains 22.7%, 37.3%, and 8.0% of the variance of the dependent variable at the country, country-time, and individual levels respectively.
One of the specific features of the societal growth curve approach is that con-textual variables are decomposed into a cross-sectional and a longitudinal com-ponent. In order to scrutinize the similarities and differences with the classical approach –that is, including the raw context variables, without decomposition- we additionally estimated models in which only the unemployment rates and GDP growth scores in the year of the survey are included.3 We find that the effects of unemployment rate (on economic threat: 0.0351; on cultural threat: 0.0043) and GDP growth (on economic threat: -0.0530; on cultural threat: -0.0031) are very similar to the longitudinal effects found in Models 2E and 2C. This similarity is however particular for the current analysis. It is most likely a result of the fact that the cross-sectional effects per se in our growth models are quite small and insignifi-cant. This may not always be the case, however. In some cases the cross-sectional component of a country score may have an effect on the dependent variable that is stronger or even opposite compared to the effect of the longitudinally varying com-ponent. Without decomposition, the estimated context effect is a mixture between the cross-sectional and the longitudinal effect. If both effects are considerable and different, omitting the decomposition can lead to incorrect conclusions.
As an additional robustness check, we re-estimated the effect of economic conditions on economic and cultural threat respectively, controlling for the inflow of foreign immigrants (per capita).4 Neither the longitudinal nor the cross-sectional components of foreign immigration are related to either economic or cultural threat perceptions. The most important conclusion from this additional model is that the longitudinal effects of the economic variables unemployment and economic growth on economic threat remain significant, and are thus not driven by a possible con-nection between migration movements and the severity of the economic crisis.
3 We would like to thank an anonymous reviewer for this suggestion. The full results are not shown here, but can be obtained from the first author.
Table 1 Societal growth curve models for economic threat
Model 1E Model 2E Model 3E
Fixed effects - indiv. level Par. Est. SE Par. Est. SE Par. Est. SE Intercept 5.155 (0.124)*** 5.195 (0.287)*** 5.650 (0.348)***
Time -0.006 (0.025) -0.031 (0.016) -0.040 (0.025)
Dummy: time-point 2008 0.116 (0.055)* -0.122 (0.068) -0.159 (0.087) Gender
male -0.264 (0.028)*** -0.261 (0.027)***
female (ref.cat.) Age category
16-24 years 0.155 (0.056)** 0.141 (0.055)*
25-34 years 0.103 (0.031)*** 0.100 (0.030)***
35-44 years 0.049 (0.021)* 0.050 (0.020)*
45-54 years (ref.cat.)
55-64 years 0.023 (0.033) 0.025 (0.032)
65-74 years 0.023 (0.058) 0.029 (0.057)
75 years and over 0.047 (0.064) 0.044 (0.064)
Education -0.099 (0.006)*** -0.101 (0.006)***
Activity status
Self-employed -0.300 (0.044)*** -0.295 (0.044)***
Higher service class -0.632 (0.056)*** -0.614 (0.054)***
White collar -0.393 (0.039)*** -0.389 (0.038)***
Blue collar (ref.cat.)
Unemployed -0.102 (0.040)* -0.103 (0.040)*
Retired -0.183 (0.033)*** -0.187 (0.033)***
In education -0.764 (0.045)*** -0.758 (0.044)***
Doing housework -0.235 (0.037)*** -0.219 (0.034)***
Disabled -0.022 (0.049) -0.032 (0.050)
Other -0.405 (0.066)*** -0.391 (0.065)***
Subjective income -0.300 (0.013)*** -0.307 (0.012)***
Urbanization -0.068 (0.008)*** -0.069 (0.007)***
Religious involvement -0.030 (0.009)*** -0.028 (0.009)** Left-right placement
Left (ref.cat.)
Centre 0.370 (0.053)*** 0.357 (0.053)***
Right 0.308 (0.082)*** 0.300 (0.082)***
Model 1E Model 2E Model 3E Fixed effects - indiv. level Par. Est. SE Par. Est. SE Par. Est. SE
Fixed effects - context variables
Unemp. rate - Longitudinal 0.035 (0.012)** 0.033 (0.016)* Unemp. - Cross-sectional 0.049 (0.042) 0.010 (0.051) GDP growth - Longitudinal -0.052 (0.015)*** -0.050 (0.023)* GDP growth -
Cross-sectional -0.115 (0.106) -0.180 (0.134)
Education x Unemp. rate -
Longit. -0.004 (0.001)***
Random effects
Level 3: Var. country
inter-cept 0.366 (0.114)*** 0.326 (0.102)*** 0.311 (0.155)** Level 3: Var. slope time 0.010 (0.005)* 0.003 (0.003) 0.005 (0.004) Level 2: Var. country-year
intercept 0.083 (0.013)*** 0.065 (0.011)*** 0.065 (0.023)***
Level 2: Var. slope education 0.000 (0.000)***
Level 1: Residual variance 5.224 (0.016)*** 4.817 (0.015)*** 4.787 (0.015)***
Deviance 941487.7 924925.3 924479.9
*p<.05; **p<.01; ***p<.001; Nindividuals=205,759, Ncountry-years=137, Ncountries=28
Table 2 Societal growth curve models for cultural threat
Model 1C Model 2C Model 3C
Fixed effects - indiv. level Par. Est. SE Par. Est. SE Par. Est. SE Intercept 4.488 (0.160)*** 4.173 (0.336)*** 5.087 (0.388)***
Time 0.006 (0.021) 0.014 (0.020) 0.002 (0.028)
Dummy: time-point 2008 0.120 (0.035)** 0.085 (0.065) 0.050 (0.098) Gender
male 0.057 (0.036) 0.062 (0.036)
female (ref.cat.) Age category
16-24 years 0.133 (0.061)* 0.113 (0.061)
25-34 years 0.002 (0.035) -0.002 (0.033)
35-44 years -0.026 (0.016) -0.025 (0.015)
45-54 years (ref.cat.)
55-64 years 0.066 (0.028)* 0.069 (0.028)*
65-74 years 0.146 (0.054)** 0.159 (0.052)**
75 years and over 0.234 (0.059)*** 0.238 (0.058)***
Model 1C Model 2C Model 3C Fixed effects - indiv. level Par. Est. SE Par. Est. SE Par. Est. SE
Education -0.103 (0.008)*** -0.105 (0.008)*** Activity status
Self-employed -0.228 (0.042)*** -0.219 (0.043)***
Higher service class -0.505 (0.060)*** -0.473 (0.056)***
White collar -0.407 (0.041)*** -0.400 (0.040)***
Blue collar (ref.cat.)
Unemployed -0.144 (0.051)** -0.146 (0.050)**
Retired -0.099 (0.036)** -0.103 (0.036)**
In education -0.722 (0.052)*** -0.712 (0.051)***
Doing housework -0.199 (0.039)*** -0.176 (0.038)***
Disabled 0.000 (0.055) -0.018 (0.053)
Other -0.377 (0.077)*** -0.363 (0.076)***
Subjective income -0.230 (0.015)*** -0.243 (0.015)***
Urbanization -0.059 (0.013)*** -0.064 (0.012)***
Religious involvement -0.014 (0.009) -0.011 (0.009) Left-right placement
Left (ref.cat.)
Centre 0.492 (0.064)*** 0.468 (0.063)***
Right 0.564 (0.105)*** 0.548 (0.105)***
Missing 0.682 (0.079)*** 0.669 (0.078)***
Fixed effects - context variables
Unemp. rate - Longitudinal 0.004 (0.012) -0.012 (0.021) Unemp. - Cross-sectional 0.033 (0.049) -0.051 (0.052) GDP growth - Longitudinal -0.003 (0.012) -0.011 (0.026) GDP growth -
Cross-sectional -0.084 (0.138) -0.198 (0.138)
Education x Unemp. rate -
Longit. -0.003 (0.002)
Random effects
Level 3:
Var. country intercept 0.713 (0.202)** 0.619 (0.184)** 0.673 (0.210)** Level 3: Var. slope time 0.008 (0.004)* 0.008 (0.004)* 0.009 (0.006) Level 2: Var. country-year
intercept 0.034 (0.006)*** 0.034 (0.006)*** 0.083 (0.019)***
Level 2: Var. slope education 0.002 (0.000)***
Level 1: Residual variance 5.344 (0.017)*** 4.917 (0.015)*** 4.885 (0.015)***
Deviance 946739.0 929758.3 928820.8
*p<.05; **p<.01; ***p<.001; Nindividuals= 205,905, Ncountry-years=137, Ncountries=28
The fourth hypothesis – namely, that the longitudinal effects of the eco-nomic context are stronger among low-educated individuals – is tested in Models 3E and 3C. These models now contain a random slope for education (implying that the educational gradient of threat perceptions can vary across countries and time points) as well as a cross-level interaction effects between education and the time-varying component of the unemployment rate (testing whether the longitudi-nal effect of unemployment rates differs across educatiolongitudi-nal groups).5 In the case of economic threat, the longitudinal effects of unemployment are indeed different for various educational groups (see Figure 3). For an individual with an average level of education (12.5 years), represented by the middle line in Figure 3, economic threat perceptions increase by 0.033 point for every percentage point increase in unemployment rate. The negative cross-level interaction parameter (-0.004) indi-cates that this effect of unemployment becomes weaker as education increases. For individuals who have had 19 years of education (i.e., 6.85 years more than the aver-age, corresponding to the 90th percentile in the dataset), the longitudinal effect of unemployment approaches zero, meaning that unemployment rates are no longer related to threat levels. For respondents with only 7 years of formal education (i.e., 5.85 years less than the average, corresponding to the 10th percentile), the impact of unemployment context is twice as strong as for the average person. This signifi-cant cross-level interaction effect shows that contextual labor market processes do not instigate economic threat perceptions uniformly across the whole population. Instead, this sociotropic source of threat seems to affect, in the first place, persons with lower education (i.e., those with a more vulnerable position in the society and the labor market), while the threat perceptions of the highly educated are more immune to the impact of labor market changes.
A similar test (not shown here) revealed that the cross-level interaction between real GDP growth rate and education is insignificant. Hereby, Hypothesis 4 is only partially supported by the data. In the case of cultural threat, none of the cross-level interactions was significant (which is not surprising given that the main effect of the economic context was insignificant for cultural threat).
In sum, this analysis reveals that economic threat perceptions have increased after the 2008 crisis (supporting Hypothesis 1), although the increase was only tem-porary. Furthermore, the changes in threat perceptions are driven by changes in the economic context (supporting Hypothesis 2) and are only observed for the eco-nomic component of threat (Hypothesis 3). Finally, the effects of ecoeco-nomic condi-tions are more outspoken of the lower-educated individuals (Hypothesis 4).
Conclusions and Discussion
The first purpose of this paper is to demonstrate the practical implementation of a statistical model to analyze multi-country repeated cross-sectional datasets. While such datasets are increasingly available, few cross-national studies opti-mally exploit the richness of datasets containing information on citizens surveyed in various countries and at different time points. The second purpose of this paper is to utilize the model to analyze the effect of the economic crisis on threat due to immigration among Europeans. We do this by providing a novel application of the societal growth curve model introduced by Fairbrother (2014) testing whether the 2008 economic crisis has affected perceptions of ethnic threat among Euro-pean citizens. More concretely, drawing on the dynamic version of group conflict theory, the current study addressed the following three research questions: (1) In
This figure represents predicted levels of economic threat for various values of education (10th percentile in the highest curve, 50th percentile in the middle curve, 90th percentile in the lowest curve) and the time-varying component of the unemployment rate (full range), as well as 95% confidence bands for these predictions (the grey zone around the curves).
what way has the prevalence of perceived immigrant threat in European societies evolved in the period before and after the peak of the economic crisis in 2008? (2) Are the observed developments in perceived economic and cultural threat driven by crisis-related changes in economic conditions? (3) Does the crisis affect threat perceptions across the whole population, or are crisis effects instead contingent on socioeconomic status? We answered these questions by analyzing ESS data from 28 different European countries spanning the years 2002 to 2012.
Societal growth curve analysis substantiates in various ways that economic contexts shape the majority group perceptions that immigration poses a threat to the national economy. Between 2008 (just before or during the outbreak of the financial crisis) and 2010 (i.e., when the impact of the crisis on the “real economy” was becoming clear), we detected an increase – albeit short-lived – in economic threat perceptions in 20 European countries. Even more conclusive is the finding that rates of unemployment and economic growth have a longitudinal effect on eco-nomic threat perceptions: In times when unemployment rates increase and growth rates plummet, citizens’ perceptions that immigrants threaten the economy become more widespread. These effects are purely longitudinal in the sense that they refer to the dynamics within countries (instead of cross-sectional differences between countries), and therefore lend strong support to the dynamic version of group threat theory. The deterioration of economic conditions in Europe indeed instigated fears that immigrants threaten economic prerogatives of the majority group, which might in turn open the door to exclusionary attitudes and discriminatory behavior. The difficult economic situation that Europe has been facing over the past years offers a breeding ground in which economic threat perceptions can easily take root. Finally, the model demonstrated that the effect of the economic crisis (i.e., increasing unem-ployment rates) is stronger among individuals with lower educational credentials.
detached from economic dynamics. At least within our window of observation, crisis-induced threat perceptions do not generalize to the idea that immigrants pose a threat to cultural life.
In sum, societal growth curve models offer promising opportunities to inves-tigate the drivers and timing of attitude change. Further research could take this argument and method even further, for example by investigating shorter time spans, and linking public opinion to monthly instead of yearly context data. Our study shows that the societal growth curve models offer opportunities to analyze cross-national repeated cross-sections. Most importantly, by distinguishing between cross-sectional and longitudinal context effects, this approach successfully avoids the problem of weak internal validity that one faces when analyzing single-shot cross-sectional data.
References
Andreß, H. J., Golsch, K., & Schmidt-Catran, A.W. (2013). Applied panel data analysis for economic and social surveys. New York: Springer.
Billiet, J., Meuleman, B., & De Witte, H. (2014). The Relationship between Ethnic Threat and Economic Insecurity in Times of Economic Crisis: Analysis of European Social Survey Data. Migration Studies, 2(2), 135-61.
Blalock, H.M. (1967). Toward a Theory of Minority-Group Relations. New York: John Wi-ley and Sons.
Blumer, H. (1958). Race Prejudice as a Sense of Group Relation. Pacific Sociological Re-view, 1, 3–7.
Campbell, D.T., & Stanley, J.C. (1966). Experimental and Experimental Quasi-Experimen-tal Design for Research. Boston: Houghton Mifflin Company.
Ceobanu, A.M., & Escandell, X. (2010). Comparative Analyses of Public Attitudes toward Immigrants and Immigration Using Multinational Survey Data: A Review of Theories and Research. Annual Review of Sociology, 36, 309-28.
Coenders, M., & Scheepers, P. (1998). Support for Ethnic Discrimination in the Netherlands 1979–1993: Effects of Period, Cohort and Individual Characteristics. European Socio-logical Review, 14(4), 405–22.
Coenders, M., & Scheepers, P. (2008). Changes in Resistance to the Social Integration of Foreigners in Germany 1980-2000: Individual and Contextual Determinants. Journal of Ethnic and Migration Studies, 34, 1-26.
Coenders, M., Lubbers, M., Scheepers, P., & Verkuyten, M. (2008). More than Two Deca-des of Changing Ethnic AttituDeca-des in the Netherlands. Journal of Social Issues, 64(2), 269-85.
Davidov, E., Meuleman, B., Cieciuch, J., Schmidt, P., & Billiet, J. (2014). Measurement Equivalence in Cross-National Research. Annual Review of Sociology, 40, 55-75. Fairbrother, M. (2014). Two Multilevel Modeling Techniques for Analyzing Comparative
Gorodzeisky, A., & Semyonov, M. (2016). Not Only Competitive Threat But Also Racial Prejudice: Sources of Anti-Immigrant Attitudes in European Societies. International Journal of Public Opinion Research, 28(3), 331-354. doi: 10.1093/ijpor/edv024 Hainmueller, J. & Hopkins, D.J. (2014). Public Attitudes Toward Immigration. Annual
Re-view of Political Science, 17, 225-49.
Harell, A., Soroka, S., Iyengar, S., & Valentino, N. (2012). The Impact of Economic and Cultural Cues on Support for Immigration in Canada and the United States. Canadian Journal of Political Science, 45(3), 499-530.
Hercowitz-Amir, A., Raijman, R., & Davidov, E. (2017). Host or hostile? Attitudes towards asylum seekers in Israel and in Denmark. International Journal of Comparative Socio-logy, online first. DOI: 10.1177/0020715217722039
Hopkins, D. J. (2010). Politicized places: Explaining where and when immigrants provoke local opposition. American political science review, 104(1), 40-60.
Kuntz, A., Davidov, E., & Semyonov, M. (2017). The Dynamic Relations between Eco-nomic Conditions and Anti-Immigrant Sentiment: A Natural Experiment in Times of the European Economic Crisis. International Journal of Comparative Sociology. DOI: 10.1177/0020715217690434
Lahav, G. (2004). Immigration and Politics in the New Europe: Reinventing Borders. Cam-bridge: Cambridge University Press.
Lucassen, G., & Lubbers, M. (2012). Who Fears What? Explaining Far-Right-Wing Prefe-rence in Europe by Distinguishing Perceived Cultural and Economic Threats. Compa-rative Political Studies, 45(5), 547-75.
McLaren, L., Boomgaarden, H., & Vliegenthart, R. (2017). News Coverage and Public Con-cern About Immigration in Britain. International Journal of Public Opinion Research.
doi: 10.1093/ijpor/edw033
Meuleman, B., Abts, K., Slootmaeckers, K., & Meeusen, C. (2018). Differentiated threat and the genesis of prejudice. Group-specific antecedents of homonegativity, Islamophobia, anti-Semitism and anti-immigrant attitudes. Social Problems.
Meuleman, B., Davidov, E., & Billiet, J. (2009). Changing Attitudes toward Immigration in Europe, 2002-2007: A Dynamic Group Conflict Theory Approach. Social Science Research, 38,352-65.
Neuhaus, J.M., & Kalbfleisch, J.D. (1998). Between- and Within-Cluster Covariate Effects in the Analysis of Clustered Data. Biometrics, 54(2), 638-45.
Olzak, S. (1992). Dynamics of Ethnic Competition and Conflict. Stanford: Stanford Univer-sity Libraries.
Pichler, F. (2010). Foundations of Anti-immigrant Sentiment: The Variable Nature of Per-ceived Group Threat Across Changing European Societies, 2002-2006. International Journal of Comparative Sociology, 51(6), 1-25.
Quillian, L. (1995). Prejudice as a Response to Perceived Group Threat: Population Com-position and Anti-immigrant and Racial Prejudice in Europe. American Sociological Review, 60, 586–611.
Quillian, L. (1996). Group Threat and Regional Changes in Attitudes toward African Ame-ricans. American Journal of Sociology, 102, 816–60.
Sarrasin, O., Green, E. G. T., Fasel, N., & Davidov, E. (2015). Does survey respondents’ im-migration background affect the measurement and prediction of imim-migration attitudes? An Illustration in Two Steps. International Journal of Public Opinion Research, 27(2),
Schafer, J. L., & Graham, J. W. (2002). Missing Data: Our View of the State of the Art.
Psychological Methods, 7(2), 147–177.
Scheepers, P., Gijsberts, M., & Coenders, M. (2002). Ethnic Exclusionism in European Countries. Public Opposition to Grant Civil Rights to Legal Migrants as a Response to Perceived Ethnic Threat. European Sociological Review, 18, 1-18.
Schlueter, E., & Davidov, E. (2013). Contextual Sources of Perceived Group Threat: Nega-tive Immigration-Related News Reports, Immigrant Group Size and Their Interaction, Spain 1996–2007. European Sociological Review, 29(2), 179-91.
Schlueter, E., Meuleman, B., & Davidov, E. (2013). Immigrant Integration Policies and Per-ceived Group Threat: A Multilevel Study of 27 Western and Eastern European Coun-tries. Social Science Research, 42(3), 670-82.
Schneider, S.L. (2008). Anti-Immigrant Attitudes in Europe: Outgroup Size and Perceived Ethnic Threat. European Sociological Review, 24(1), 53-67.
Semyonov, M., Raijman, R., & Gorodzeisky, A. (2006). The Rise of Anti- Foreigner Sen-timent in European Societies, 1988-2000. American Sociological Review, 71, 426-49. Shadish, W.R., Cook, T. D., & Campbell, D. T. (2001). Experimental and
Quasi-Experimen-tal Designs for Generalized Causal Inference. Boston: Houghton Mifflin
Sides, J., & Citrin, J. (2007). European Opinion about Immigration: The Role of Identities, Interests and Information. British Journal of Political Science, 37(3), 477-504. Sniderman, P., Hagendoorn, L., & Prior, M. (2004). Predisposing Factors and Situational
Triggers: Exclusionary Reactions to Immigrant Minorities. American Political Science Review, 98(1), 35-49.
Verbeke, G., & Molenberghs, G. (2000). Linear mixed models for longitudinal data. Sprin-ger New York.
Wilkes, R., & Corrigall-Brown, C. (2011). Explaining Time Trends in Public Opinion: At-titudes towards Immigration and Immigrants. International Journal of Comparative Sociology, 52(1), 79-99.
Appendices
Appendix 1 Sample sizes per country and year
Round 1
2002 Round 2 2004 Round 3 2006 Round 4 2008 Round 5 2010 Round 6 2012 Total
Austria (AT) 1,973 2,023 2,198 - - - 6,194
Belgium (BE) 1,700 1,574 1,611 1,535 1,473 1,565 9,458
Bulgaria (BG) - - - - 1,179 1,816 1,978 1,844 6,817
Switzerland (CH) 1,610 1,671 1,402 1,338 1,094 1,079 8,194
Cyprus (CY) - - - - 932 1,105 1,000 985 4,022
Czech Republic (CZ) 1,278 2,851 - - 1,937 2,281 1,929 10,276 Germany (DE) 2,648 2,575 2,619 2,459 2,686 2,597 15,584 Denmark (DK) 1,417 1,404 1,404 1,491 1,453 1,518 8,687
Estonia (EE) - - 1,395 958 1,147 1,383 1,714 6,597
Spain (ES) 1,616 1,489 1,682 2,305 1,660 1,633 10,385
Finland (FI) 1,924 1,977 1,824 2,118 1,797 2,079 11,719
France (FR) 1,314 1,621 1,762 1,861 1,532 1,715 9,805
Great Britain (GB) 1,796 1,662 2,086 2,037 2,070 1,946 11,597
Greece (GR) 2,279 2,135 - - 1,886 2,370 - - 8,670
Croatia (HR) - - - 1,272 1,407 - - 2,679
Hungary (HU) 1,562 1,414 1,406 1,433 1,447 1,874 9,136 Ireland (IE) 1,866 2,111 1,538 1,462 2,146 2,218 11,341
Iceland (IS) - - 553 - - - 691 1,244
Italy (IT) 1,171 1,487 - - - 883 3,541
Lithuania (LT) - - - 1,519 1,938 3,457
Luxembourg (LU) 951 1,043 - - - 1,994
Netherlands (NL) 2,167 1,690 1,688 1,572 1,657 1,639 10,413
Norway (NO) 1,881 1,607 1,596 1,394 1,351 1,384 9,213
Poland (PL) 2,027 1,672 1,682 1,576 1,707 1,843 10,507 Portugal (PT) 1,412 1,922 1,995 2,199 1,990 2,002 11,520
Sweden (SE) 1,766 1,745 1,690 1,591 1,300 1,585 9,677
Slovenia (SI) 1,349 1,316 1,338 1,161 1,255 1,127 7,546
Slovakia (SK) - - 1,388 1,558 1,666 1,727 1,719 8,058
Appendix 2 Descriptive statistics
Percent N
Gender
female 53.5 122,057
male 46.5 106,018
Total 100.0 228,075
Age category
16-24 14.0 31,738
25-34 14.8 33,624
35-44 17.2 38,979
45-54 17.1 38,847
55-64 16.4 37,206
65-74 12.6 28,714
75+ 8.0 18,141
Total 100.0 227,249
Employment status
self-employed 6.5 14,626
higher service class 6.3 14,185
white-collar workers 20.9 47,052
blue-collar workers 14.9 33,576
unemployed 5.2 11,835
retired 24.5 55,458
in education 8.6 19,496
homemakers 9.1 20,596
disabled 2.3 5,282
other 1.3 2,922
Total 99.6 225,028
Left-right placement
Left 27.7 63,239
Center 28.82 65,804
Right 30.92 70,598
Missing 12.57 28,690
Mean SD Min Max N
Economic threat perceptions 5.21 2.39 0 10 217917 Cultural threat perceptions 4.50 2.49 0 10 218073
Education (in years) 12.10 4.03 0 30 225821
Subjective income 2.98 0.86 1 4 222897
Urbanization 3.04 1.21 1 5 227676