Comparison of Methods to Generalize Randomized Clinical Trial Results Without
Individual-Level Data for the Target Population
Jin-Liern Hong*, Michael Webster-Clark, Michele Jonsson Funk, Til Stürmer*, Sara E. Dempster, Stephen R. Cole, Iksha Herr, and Robert LoCasale
*Correspondence to Dr. Jin-Liern Hong, Department of Epidemiology, UNC Gillings School of Global Public Health, University of North Carolina at Chapel Hill, 135 Dauer Drive, 2101 McGavran-Greenberg Hall, CB #7435, Chapel Hill, NC 27599-7435 (e-mail: [email protected]); or Dr. Til Stürmer, Department of Epidemiology, UNC Gillings School of Global Public Health, University of North Carolina at Chapel Hill, 135 Dauer Drive, 2101 McGavran-Greenberg Hall, CB #7435, Chapel Hill, NC 27599-7435 (e-mail: [email protected]).
Initially submitted January 4, 2018; accepted for publication October 5, 2018.
Our study explored the application of methods to generalize randomized controlled trial results to a target popu-lation without individual-level data. We compared 4 methods using aggregate data for the target popupopu-lation to
gen-eralize results from the international trial, Justification for the Use of Statins in Prevention: an Intervention Trial
Evaluating Rosuvastatin (JUPITER), to a target population of trial-eligible patients in the UK Clinical Practice Research Datalink (CPRD). The gold-standard method used individual data from both the trial and CPRD to predict
probabilities of being sampled in the trial and to reweight trial participants to reflect CPRD patient characteristics.
Methods 1 and 2 used weighting methods based on simulated individual data or the method of moments,
respec-tively. Method 3 weighted the trial’s subgroup-specific treatment effects to match the distribution of an effect
modi-fier in CPRD. Method 4 calculated the expected absolute benefits in CPRD assuming homogeneous relative
treatment effect. Methods based on aggregate data for the target population generally yielded results between the trial and gold-standard estimates. Methods 1 and 2 yielded estimates closest to the gold-standard estimates when
continuous effect modifiers were represented as categorical variables. Although individual data or data on joint
dis-tributions remains the best approach to generalize trial results, these methods using aggregate data might be use-ful tools for timely assessment of randomized trial generalizability.
cardiovascular diseases; external validity; generalizability; JUPITER trial; randomized clinical trial; statins
Abbreviations: CI, confidence interval; CPRD, Clinical Practice Research Datalink; hsCRP, high-sensitivity C-reactive protein;
JUPITER, Justification for the Use of Statins in Prevention: an Intervention Trial Evaluating Rosuvastatin; RCT, randomized
clinical trial.
There is growing interest in improving the generalizability of randomized controlled trial (RCT) results to real-world popula-tions. RCTs provide protection against confounding; however, participants are often highly selected, leading to differences in some important characteristics between the RCT participants and the target population for whom the treatment would be indicated in the real world. If treatment effects are heteroge-neous across these characteristics, the generalizability of the RCT result to the target population is questionable.
To address this sampling issue and therefore improve gener-alizability of RCT results, weighting methods have been proposed
the JUPITER trial, the final target population included those who had a low-density lipoprotein cholesterol level of<130 mg/ dL and elevated levels of hsCRP (≥2.0 mg/L).
Effect modifiers
Concerns about RCT generalizability arise when there remain overt differences in important characteristics between the trial participants and the target population, and these characteristics modify the treatment effects (1,5). Thus, the variables selected in this study are potential effect modifiers that are plausibly associated with RCT participation, not factors solely associated with RCT participation or the outcome.
We chose 10 effect modifiers on the basis of having previ-ously been shown to modify the effect of rosuvastatin on the cardiovascular risk (6–8) and to be plausibly associated with selection into the trial. Sex, current smoking, chronic kidney dis-ease, and use of aspirin and antihypertensive drugs were defined as binary variables. Age, body mass index, hsCRP, high-density lipoprotein cholesterol, and low-density lipoprotein cholesterol values were considered as continuous variables as well as cate-gorical variables, depending on the generalizing method. To simulate CPRD aggregate data similar to those that would typi-cally be publicly available, we summarized the data as means with standard deviations for continuous variables and propor-tions for binary and categorical variables.
Overall and subgroup-specific treatment effects in the JUPITER trial
In the JUPITER trial, the rosuvastatin effect on the cardio-vascular risk was estimated based on the intention-to-treat approach. We used Cox proportional hazard models to estimate the hazard ratio and 95% confidence interval for the compari-son of major cardiovascular events between rosuvastatin and placebo groups. We also calculated risk differences and risk ratios at 1, 2, 3, and 4 years after randomization using a non-parametric method accounting for noncardiovascular competing causes of death and obtained 95% confidence intervals based on standard deviations of estimates from 200 bootstraps (9). We also repeated these analyses in the various subgroups strat-ified by effect modifiers of interest to obtain subgroup-specific treatment effects.
Cardiovascular risk in the CPRD
The occurrence of cardiovascular disease was defined as hospitalization with the primary discharge diagnosis being for cardiovascular disease or with procedures of arterial revascu-larization, using data from the linked Hospital Episode Statistics data. Eligible CPRD patients were followed from the index date to thefirst cardiovascular event. Follow-up ended at the earli-est of statin initiation, death, migration out of general practice, or end of study. We used a nonparametric method to calculate the cumulative incidences of cardiovascular disease but did not account for noncardiovascular death as a competing event when estimating cumulative incidences because of lack of data on causes of death.
onaggregatedatafromthetargetpopulationcouldbeuseful tools for forecasting RCT generalizability in a timely manner.
Theobjectiveofthisstudywastocompareseveralmethods of generalizing RCT results to a target population when only aggregate data is available for the target population. We applied thesemethodsinthecontextofestimatingtheanticipated rosu-vastatin effect for primary cardiovascular prevention in the Clin-icalPracticeResearchDatalink(CPRD)usingtheresultsfrom Justification for the Use of Statins in Primary Prevention: an InterventionTrialEvaluatingRosuvastatin(JUPITER).With access to individual data for both the trial and the target popula-tion, we were able to compare results using each aggregate-data methodtothegold-standard methodofusingindividual-level data.
METHODS
Studypopulation
The JUPITER trial (ClinicalTrials.gov identifier: NCT-00239681) was a multicenter, randomized, double-blind trial. Thistrialwasconductedin26countriesandrandomized17,802 subjects to receive rosuvastatin 20 mg or placebo daily to pre-ventcardiovasculardisease(4).Eligibleparticipantsweremen aged ≥50 years or women aged ≥60 years who had elevated high-sensitivityC-reactiveprotein(hsCRP)levelsbutnot hyper-lipidemia (i.e., hsCRP of ≥2.0 mg/L, low-density lipoprotein cholesterolof<130mg/dL,andtriglyceridesof<500mg/dL). Subjects were excluded if they had a history of cardiovascular disease,diabetes,orcancer.Theprimaryendpointwasthe occur-rence of a first major cardiovascular event, defined as nonfatal myocardialinfarction,nonfatalstroke,hospitalizationforunstable angina, arterial revascularization procedure, or confirmed death fromcardiovascularcauses.
The target population of interest was the population of Eng-landwhowouldhavebeeneligibletoparticipateintheJUPITER trial (Web Figure 1, available at https://academic.oup.com/aje). Asaproxyforthispopulation,weuseddatafromtheCPRD linked with Hospital Episode Statistics data, and we selected allmenaged≥50yearsandwomenaged≥60yearswith≥2 years of registration after the practice Up-to-Standard date fromJanuary1,2001,throughApril30,2014.Foreachpatient, we defined an eligibility period, starting on the date on which thepatientmetbothageandregistration-timerequirementsand ending with the earliest event of the following: diagnosis of car-diovasculardisease,diabetes,orcancer;initiationofany lipid-lowering agents; death; migration out of general practice; or endofstudy.Next,1visittothegeneralpractitionerduringthe eligibility period was randomly selected for each patient and wasdefinedastheindexdate.Patientswereexcludedifthey had cardiovascular disease, diabetes, or cancer or used any lipid-lowering agents beforemeeting age and registration-time requirements.
Methods for generalizing RCT results to a target population
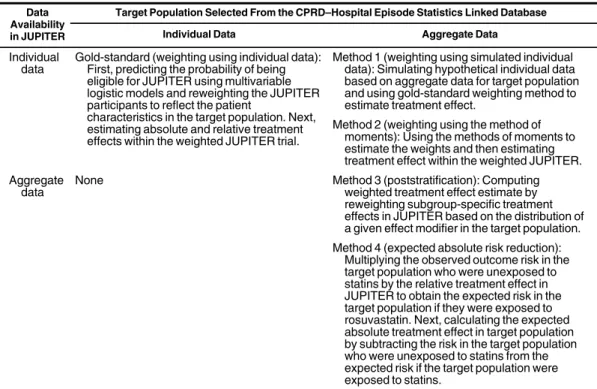
We implemented 4 methods to generalize the results of the JUPITER trial to the target population based on aggregate data of the target population and compared these with the gold-standard method based on individual data of the target population (Table1). Methods 1–2 are based on reweighting the trial pop-ulation after predicting the probability of being sampled in the trial. Method 3 uses subgroup-specific estimates of treatment effect in JUPITER and aggregate data from the target population. Method 4 uses the overall relative treatment effect from the trial and absolute outcome risk estimates from the target population. Because of the properties of these methods, the gold-standard method and methods 1–3 can be used to estimate the expected relative and absolute effects of rosuvastatin on cardiovascular risk in the target population, while method 4 can be used only to estimate the absolute effect in the target. Because the rela-tive effect is assumed to be constant, it will generalize directly from the trial to the target population.
Gold-standard method: weighting using individual data. This method used individual data from both JUPITER and CPRD and is considered the gold-standard for comparison. We combined individual data from the JUPITER trial and the target population to estimate the probability of being sampled in the JUPITER trial (PS=1), using multivariable logistic regres-sion models. The logistic models included all effect modifiers of interest, higher-order terms for continuous covariates, and prod-uct terms for the joint distribution. Wefirst included age and laboratory test values as continuous variables in the model and repeated modeling after grouping them into categorical variables. After estimating the sampling probability, the sampling weights for the JUPITER trial participants were calculated as the inverse odds of the sampling probability [(1−PS=1)÷PS=1] (10) and scaled by multiplying with the marginal odds of being in the trial so that the pseudo-RCT population had a similar sample size (sum of weights) as the original RCT. Within the weighted JUPI-TER trial, we used Cox proportional hazard models with robust variance to calculate hazard ratios and 95% confidence intervals of the rosuvastatin effect. We also used a nonparametric method to estimate risk differences accounting for competing causes of death other than cardiovascular disease and obtained 95% confi -dence intervals based on standard deviations of estimates from 200 bootstraps (9).
Method 1: weighting using simulated individual data. This approach began with individual data from the JUPITER trial and aggregate data from the target population. Given the summary statistics of the effect modifiers and the total number of the target population (n=6,619), we simulated hypothetical individual data for the target population under a strong assump-tion of no correlaassump-tion between the effect modifiers. Details about the simulation setup are provided in Web Appendix 1. All 10 effect modifiers were simulated independently for a sample size of 661,900 to stabilize the sampling distribution. Continuous variables were simulated based on truncated normal distributions to cope with the inclusion/exclusion criteria of the JUPITER trial (e.g., the lower limit for age). With real individual data for the trial and simulated individual data for the target population, we used logistic models to estimate the sampling probability.
We included only main effect terms in the logistic models because adding interaction terms can worsen covariate balance by making the variables appear more uncorrelated in the weighted trial than they were in the true target population (see Web Table 1). After estimating the individual sampling probabilities, we cal-culated sampling weights and estimated the treatment effect within the weighted JUPITER participants as in the gold-standard method.
Method 2: weighting using the method of moments. Signorovitch et al. (11,12) proposed this method for indirect comparison between trials with limited availability of indi-vidual data. Patients in the trial with indiindi-vidual data were re-weighted to have average values of the covariates that match those reported in the target population with aggregate data only. Given that the target population lacks individual data, the coefficients in the logistic models were estimated by the method of moments. The statistical details on using the method of moments to estimate the weights and sample R code have been described previously (12,13). After obtaining the weights, we estimated the treatment effect within the weighted JUPI-TER participants as in the gold-standard method.
Method 3: poststratification. This approach applies only to the scenario with binary or categorical effect modifiers and can be used for 1 effect modifier at a time. We used the subgroup-specific treatment effect estimates in the trial and proportions of the categorical effect modifiers in the target population. We calculated the treatment effect for the target population by weighting the average of the stratum-specific treatment effects according to proportions of a given effect modifier in the target population. The 95% confidence interval was obtained based on the pooled standard deviations across strata. We repeated the calculation for each effect modifier separately, and then summa-rized the poststratification estimates of treatment effect among all effect modifiers by taking the (unweighted) average of the estimated treatment effects. Calculations of relative effect esti-mates were performed on the natural logarithm scale.
Method 4: expected absolute risk reduction. This method has been described previously in detail (14–16). Wefirst ob-tained the cardiovascular risks in the JUPITER-eligible CPRD patients who were naive to statins. We treated these cardiovas-cular risks as the baseline risks in unexposed target-population patients. Next, assuming a uniform relative effect of rosuvastatin, we multiplied the cardiovascular risks in the target population by the relative risk from the trial at each time point to obtain the ex-pected absolute risk in the target population if they were exposed to rosuvastatin. The absolute risk reduction associated with rosu-vastatin in the target population was then calculated as the abso-lute difference between the observed risk in the unexposed patients and the expected risk in the exposed patients. For example, given a 1-year cardiovascular risk of 1.4% in the target population and a 1-year risk ratio of 0.61 observed for rosuvastatin in JUPITER, the expected risk was 0.61×1.4%=0.85% if the target population was exposed to rosuvastatin. Thus, the expected risk reduction at 1 year was 0.85%−1.4%=−0.55 percent-age points. The 95% confidence intervals were obtained based on standard deviations of estimates from 200 bootstraps of the JUPITER data.
effect modifiers marginally. However, method 1 (weighting using simulated individual data) had overt imbalance between the CPRD and the weighted JUPITER trial population.
Figure1compares the hazard ratios of the rosuvastatin effect on cardiovascular prevention after implementing different meth-ods of generalizing RCT results. Compared with the treatment effect observed in JUPITER (hazard ratio=0.56, 95% confi -dence interval (CI): 0.46, 0.69), the expected treatment effects in the target population were attenuated with the gold-standard method and were similar between the scenarios in which we included age and laboratory values as continuous (hazard ratio=0.65, 95% CI: 0.46, 0.91) or as categorical variables (hazard ratio=0.66, 95% CI: 0.48, 0.91). Similarly, methods 1 and 2 also yielded attenuated treatment effects when age and laboratory values were included as categorical variables, with hazard ratios of 0.63 (95% CI: 0.47, 0.86) and 0.62 (95% CI: 0.46, 0.83), respectively. In contrast, when age and laboratory tests were considered as continuous variables, the hazard ratio estimates were close to the estimates observed in the JUPITER trial. In method 3 (poststratification), the estimated hazard ratios varied according to the effect modifiers, ranging from 0.52 to 0.58, and the average hazard ratio was 0.55, which was also close to the JUPITER trial estimates.
Figures2and3show the generalized results of the absolute benefits of rosuvastatin. Based on the gold-standard method, the absolute benefit of rosuvastatin was muted in thefirst 2 years of follow-up and began to emerge afterwards. Method 1
Table 1. Description of Different Methods for Generalizing a Randomized Clinical Trial’s Results to a Target
Population Without Individual Data, Using Data From Justification for the Use of Statins in Primary Prevention: an Intervention Trial Evaluating Rosuvastatin, Multiple Countries, 2003–2008, and the Clinical Practice Research Datalink–Hospital Episode Statistics Linked Database, England, 2001–2014
Data Availability in JUPITER
Target Population Selected From the CPRD–Hospital Episode Statistics Linked Database
Individual Data Aggregate Data
Individual data
Gold-standard (weighting using individual data): First, predicting the probability of being eligible for JUPITER using multivariable logistic models and reweighting the JUPITER participants to reflect the patient
characteristics in the target population. Next, estimating absolute and relative treatment effects within the weighted JUPITER trial.
Method 1 (weighting using simulated individual data): Simulating hypothetical individual data based on aggregate data for target population and using gold-standard weighting method to estimate treatment effect.
Method 2 (weighting using the method of moments): Using the methods of moments to estimate the weights and then estimating treatment effect within the weighted JUPITER. Aggregate
data
None Method 3 (poststratification): Computing
weighted treatment effect estimate by reweighting subgroup-specific treatment effects in JUPITER based on the distribution of a given effect modifier in the target population. Method 4 (expected absolute risk reduction):
Multiplying the observed outcome risk in the target population who were unexposed to statins by the relative treatment effect in JUPITER to obtain the expected risk in the target population if they were exposed to rosuvastatin. Next, calculating the expected absolute treatment effect in target population by subtracting the risk in the target population who were unexposed to statins from the expected risk if the target population were exposed to statins.
Abbreviations: CPRD, Clinical Practice Research Datalink; JUPITER, Justification for the Use of Statins in Primary Prevention: an Intervention Trial Evaluating Rosuvastatin.
Statistical Computing, Vienna, Austria) (13); all other statistical analyseswereperformedwithSAS,version9.3(SAS Insti-tute, Inc., Cary, North Carolina). This study was approved bytheinstitutionalreviewboardoftheUniversityofNorth Carolina at Chapel Hill, and by the Independent Scientific AdvisoryCommitteeforMedicinesandHealthcareProducts Regulatory Agency database research in the United Kingdom.
RESULTS
Duringthestudyperiod,weidentifiedatotalof6,619patients in the CPRD who would have been eligible for the JUPITER trial. Comparedwith theJUPITERparticipants,theCPRD patients were more likely to be female, younger, less obese, and lesslikelytobeusingaspirinbutwithhigherhsCRPand low-density lipoprotein cholesterol levels (Tables 2 and 3). Com-paredwiththeparticipantsinJUPITERwhowererandomized to placebo, the CPRD patients had slightly higher cardiovascular risksatyears1and2butlowerrisksatyears3and4(Table4).
Table 2. Distribution of Continuous or Binary Effect Modifiers Before and After Weighting by Different Methods in Justification for the Use of Statins in Primary Prevention: an Intervention Trial Evaluating Rosuvastatin, Multiple Countries, 2003–2008, and the Clinical Practice Research Datalink–Hospital Episode Statistics Linked Database, England, 2001–2014
Effect Modifier CPRD (n=6,619) JUPITER (n=17,802)
JUPITER Data Weighted by Different Methodsa
Gold-Standard Method Method 1 Method 2
% Mean (SD) % Mean (SD) ASMDb % Mean (SD) ASMDb % Mean (SD) ASMDb % Mean (SD) ASMDb
Age, years 65 (9.5) 66 (7.7) 0.19 65 (9.4) 0.01 67 (7.8) 0.10 65 (9.5) 0.00
Male sex 53.9 61.8 0.16 53.8 0.00 50.6 0.07 53.9 0.00
BMIc 27.9 (5.8) 29 (5.5) 0.22 28 (5.8) 0.02 27.6 (5.5) 0.09 27.9 (5.8) 0.00
Current smoker 17.2 15.8 0.04 17.2 0.00 19.5 0.06 17.2 0.01
Antihypertensives 51.6 49.7 0.04 52.2 0.01 48.4 0.06 51.6 0.00
Aspirin 9.2 18.6 0.27 9.4 0.01 8.8 0.02 9.2 0.00
CKD 19.2 18.3 0.02 18.7 0.01 19.3 0.00 19.2 0.00
hsCRP, mg/L 5.7 (3.9) 5.3 (3.6) 0.08 5.8 (4.0) 0.02 6.2 (4.4) 0.07 5.7 (3.9) 0.01
LDL-C, mg/dL 106 (18.3) 104 (18.7) 0.10 106 (18.1) 0.01 100 (21.3) 0.03 106 (18.3) 0.00
HDL-C, mg/dL 58 (19.0) 51 (15.3) 0.37 58 (19.0) 0.00 59 (20.0) 0.04 58 (19.0) 0.00
Abbreviations: ASMD, absolute standardized mean differences; BMI, body mass index; CKD, chronic kidney disease; CPRD, Clinical Practice Research Datalink; HDL-C, high-density lipo-protein cholesterol; hsCRP, high-sensitivity C-reactive lipo-protein; JUPITER, Justification for the Use of Statins in Primary Prevention; LDL-C, low-density lipoprotein cholesterol; SD, standard deviation.
aThe gold-standard method used individual data from both JUPITER and CPRD to estimate predicted probabilities of being sampled in JUPITER and reweight the JUPITER population to
reflect CPRD patient characteristics. The distributions of sampling probabilities and weights based on the gold-standard method are presented in Web Figure 3 and Web Table 4. The mean (SD) of sampling weights based on the gold-standard method was 1.00 (0.99). Methods 1 and 2 used weighting methods based on simulated individual data (method 1) or the method of mo-ments (method 2) to estimate the sampling weights.
bASMD in baseline characteristics was calculated between the CPRD and the unweighted or weighted JUPITER trial, using SAS macro stddiff% (SAS Institute, Inc., Cary, North Carolina)
(23).
based on aggregate data for the target population were compared with the gold-standard approach, based on individual data for the target population, to estimate the anticipated treatment effect of rosuvastatin on cardiovascular risk in the English population who would have been eligible for the JUPITER trial. The gold-standard method showed that the effects of rosuvastatin on reducing cardiovascular risk were attenuated but remained after generalizing to the target population. We found that meth-ods based on aggregate data for the target population generally yielded results somewhere between the RCT and the gold-standard estimate. Among these methods, weighting methods using simulated individual data (method 1) and the method of moments (method 2) led to the closest estimates when consider-ing effect modifiers as binary or categorical variables.
Table 3. Distribution of Binary or Categorical Effect Modifiers Before and After Weighting by Different Methods in Justification for the Use of
Statins in Primary Prevention: an Intervention Trial Evaluating Rosuvastatin, Multiple Countries, 2003–2008, and the Clinical Practice Research Datalink–Hospital Episode Statistics Linked Database, England, 2001–2014
Effect Modifiers
CPRD
(n=6,619) JUPITER (n=17,802)
JUPITER Data Weighted by Different Methodsa
Gold-Standard
Method Method 1 Method 2
No. % No. % ASMDb % ASMDb % ASMDb % ASMDb
Age, years
<65 3,637 54.9 7,565 42.5 0.34 54.9 0.01 50.2 0.10 54.9 0.00
65–69 1,125 17.0 4,635 26.0 17.0 18.6 17.0
70–74 765 11.6 3,039 17.1 11.5 12.4 11.6
75–79 546 8.2 1,725 9.7 8.2 9.3 8.2
≥80 546 8.2 838 4.7 8.4 9.5 8.2
Male sex 3,565 53.9 11,001 61.8 0.16 53.5 0.01 55.0 0.02 53.9 0.00
BMIc
<25 2,172 32.8 4,009 22.6 0.23 32.8 0.00 36.1 0.07 32.8 0.00
25–29 2,369 35.8 7,010 39.5 35.7 33.7 35.8
≥30 2,078 31.4 6,721 37.9 31.5 30.2 31.4
Current smoker 1,138 17.2 2,821 15.8 0.04 17.2 0.00 20.0 0.07 17.2 0.00
Antihypertensives 3,416 51.6 8,846 49.7 0.04 51.6 0.00 47.4 0.09 51.6 0.00
Aspirin 612 9.2 3,313 18.6 0.27 9.4 0.01 8.7 0.01 9.2 0.00
CKD 1,271 19.2 3,257 18.3 0.02 19.4 0.00 19.1 0.02 19.2 0.00
hsCRP, mg/L
<3.5 2,402 36.3 6,750 39.9 0.31 36.4 0.00 37.2 0.03 36.3 0.00
3.5–4.9 818 12.4 3,703 21.9 12.3 12.2 12.4
≥5.0 3,399 51.4 6,481 38.3 51.3 50.5 51.4
LDL-C≥100 mg/dL 4,686 70.8 11,841 66.6 0.09 71.1 0.01 69.4 0.06 70.8 0.00
HDL-C<60 mg/dL 4,069 61.5 13,333 74.9 0.29 61.1 0.01 58.8 0.00 61.5 0.00
Abbreviations: ASMD, absolute standardized mean differences; BMI, body mass index; CKD, chronic kidney disease; CPRD, Clinical Practice Research Datalink; HDL-C, high-density lipoprotein cholesterol; hsCRP, high-sensitivity C-reactive protein; JUPITER, Justification for the Use of Statins in Primary Prevention: an Intervention Trial Evaluating Rosuvastatin; LDL-C, low-density lipoprotein cholesterol.
aThe gold-standard method used individual data from both JUPITER and CPRD to estimate predicted probabilities of being sampled in JUPI-TER and reweight the JUPIJUPI-TER population to reflect CPRD patient characteristics. The distributions of sampling probabilities and weights based on the gold-standard method are presented in Web Figure 3 and Web Table 4. The mean (standard deviation) of sampling weights based on the gold-standard method was 0.99 (1.27). Methods 1 and 2 used weighting methods based on simulated individual data (method 1) or the method of moments (method 2) to estimate the sampling weights.
bASMD in baseline characteristics was calculated between the CPRD and the unweighted or weighted JUPITER trial, using SAS macro stddiff % (SAS Institute, Inc., Cary, North Carolina) (23).
cWeight (kg)/height (m)2.
withcategoricallaboratoryandagevaluesandmethod2also showed similar trends, but not method 1 with continuous age and laboratory values or method 3 (Figure 3). Method 4 (ex-pected absolute risk reduction) first estimated the expected risk in the target population if they were exposed to rosuvastatin, which is presented in Table 4, and the estimated risk reduction showedstrongerbenefitsthantheJUPITERtrialestimatesin the first 2 years and weaker benefits afterwards (Figure 2).
DISCUSSION
Three key assumptions need to be considered when imple-menting the weighting method with individual data as the gold-standard method. First, we assumed no unmeasured effect modifiers. Based on previous literature, we have captured most
of the potential effect modifiers. Second, we assumed that we cor-rectly specified the logistic models used to predict the sampling probability. Because the true models are unknown, we have included all possible 2-way interactions and have assessed the
Table 4. The Risk of Cardiovascular Disease in the Target Population Selected from the Clinical Practice Research Datalink–Hospital Episode
Statistics Linked Database, England, 2001–2014, and the Placebo Group of Justification for the Use of Statins in Primary Prevention: an Intervention Trial Evaluating Rosuvastatin, Multiple Countries, 2003–2008
Year
Observed Cardiovascular Risk
Risk Ratio in JUPITERa Expected CardiovascularRisk in Exposed CPRD
Patientsa
CPRD Patients JUPITER Placebo Group
Risk, % 95% CI Risk, % 95% CI Risk Ratio 95% CI Risk, % 95% CI
1 1.44 1.12, 1.75 1.20 0.98, 1.42 0.61 0.51, 0.74 0.88 0.61, 1.15
2 2.55 2.12, 2.97 2.44 2.09, 2.78 0.58 0.50, 0.67 1.47 1.08, 1.86
3 3.92 3.30, 4.53 4.57 3.89, 5.25 0.56 0.48, 0.65 2.18 1.57, 2.79
4 5.14 4.40, 5.89 6.19 5.17, 7.20 0.47 0.41, 0.54 2.42 1.73, 3.10
Abbreviation: CI, confidence interval; CPRD, Clinical Practice Research Datalink; JUPITER, Justification for the Use of Statins in Primary Pre-vention: an Intervention Trial Evaluating Rosuvastatin.
aThe 95% confidence intervals were obtained based on the standard deviation of estimates from 200 bootstraps.
0.3 0.5 0.7 1.0 Crude
Standardized to CPRD patients
Continuous or categorical effect modifiers
Categorical effect modifiers JUPITER estimates
GS: Weighting using ILD
M1: Weighting using simulated ILD M2: Weighting using MM
GS: Weighting using ILD
M1: Weighting using simulated ILD M2: Weighting using MM
M3: Estimates after stratification Age
Sex BMI
Current smoker Antihypertensive drugs Aspirin use
CKD hsCRP LDL−C HDL−C Averaged
0.56 (0.46, 0.69)
0.65 (0.46, 0.91) 0.52 (0.40, 0.69) 0.56 (0.41, 0.76)
0.66 (0.48, 0.91) 0.63 (0.47, 0.86) 0.62 (0.46, 0.83)
0.53 (0.37, 0.76) 0.56 (0.40, 0.77) 0.56 (0.39, 0.81) 0.56 (0.40, 0.80) 0.56 (0.41, 0.76) 0.52 (0.38, 0.72) 0.56 (0.41, 0.78) 0.55 (0.37, 0.82) 0.56 (0.41, 0.75) 0.58 (0.41, 0.82) 0.55
Generalizing Methods HR (95% CI)
Hazard Ratio
Figure 1. Hazard ratio (HR) and 95% confidence interval (CI) of the rosuvastatin effect in the primary cardiovascular prevention in Justification for
stringent inclusion and exclusion criteria to select a target popula-tion who would have been eligible for the JUPITER trial.
Weighting methods using simulated individual data (method 1) and the method of moments (method 2) showed discrepant results between the scenarios when we considered age and
Crude
Standardized to CPRD patients
Continuous or categorical effect modifiers
Categorical effect modifiers
Given the outcome risk in target population JUPITER estimates
GS: Weighting using ILD
M1: Weighting using simulated ILD
M2: Weighting using MM
GS: Weighting using ILD
M1: Weighting using simulated ILD
M2: Weighting using MM
M3: Estimates after stratification (averaged)
M4: Expected risk reduction
−0.46 (−0.75, −0.18)
−0.36 (−0.87, 0.15)
−0.70 (−1.14, −0.27)
−0.31 (−0.74, 0.11)
−0.25 (−0.77, 0.27)
−0.33 (−0.74, 0.09)
−0.30 (−0.70, 0.09)
−0.46
−0.55 (−0.82, −0.29) −1.03 (−1.50, −0.55)
−0.72 (−1.49, 0.05)
−1.17 (−1.85, −0.49)
−0.92 (−1.46, −0.38)
−0.63 (−1.35, 0.09)
−0.78 (−1.45, −0.11)
−0.76 (−1.37, −0.15)
−1.01
−1.07 (−1.46, −0.68) −2.03 (−2.93, −1.12)
−1.71 (−3.31, −0.11)
−1.91 (−3.07, −0.76)
−1.83 (−2.93, −0.74)
−1.72 (−3.33, −0.10)
−1.90 (−3.37, −0.44)
−1.81 (−3.28, −0.34)
−1.95
−1.73 (−2.35, −1.12) −3.28 (−4.46, −2.10)
−3.93 (−6.24, −1.63)
−3.07 (−4.46, −1.68)
−3.44 (−4.87, −2.00)
−3.73 (−6.07, −1.39)
−3.41 (−5.16, −1.65)
−3.42 (−5.31, −1.53)
−3.23
−2.73 (−3.41, −2.04) 216 278 142 319 404 307 333 215 180 97 139 86 109 160 128 132 99 93 49 58 52 55 58 53 55 51 58 31 25 33 29 27 29 29 31 37
−6 −5 −3 1 0 1
Generalizing Method and Year RD (95% CI)
No. Needed to Treat
Risk Difference, % 1 1 1 1 1 1 1 1 1 2 2 2 2 2 2 2 2 2 3 3 3 3 3 3 3 3 3 4 4 4 4 4 4 4 4 4
Figure 2. Risk difference (RD, %) and 95% confidence interval (CI) of the rosuvastatin effect in the primary cardiovascular prevention in Justifi
ca-tion for the Use of Statins in Primary Prevenca-tion: an Intervenca-tion Trial Evaluating Rosuvastatin (JUPITER), multiple countries, 2003–2008, and the expected effect in a target population (Clinical Practice Research Datalink (CPRD)–Hospital Episode Statistics Linked Database, England, 2001–2014) using different methods of generalizing trial results. GS, the gold-standard; ILD, individual-level data; M1, method 1; M2, method 2; M3, method 3; M4, method 4; MM, method of moments.
Standardized to CPRD patients Categorical effect modifiers
M3: Estimates after stratification by Age Sex BMI Current smoking Antihypertensive drugs Aspirin use CKD hsCRP LDL−C HDL−C Averaged
−0.53 (−1.18, 0.13)
−0.44 (−0.86, −0.03)
−0.52 (−1.09, 0.06)
−0.46 (−1.16, 0.24)
−0.45 (−0.86, −0.05)
−0.48 (−1.07, 0.11)
−0.45 (−1.05, 0.15)
−0.44 (−0.97, 0.09)
−0.44 (−0.87, 0.00)
−0.44 (−0.92, 0.05)
−0.46
−1.00 (−1.89, −0.11)
−0.99 (−1.61, −0.37)
−1.05 (−1.86, −0.24)
−1.02 (−2.18, 0.13)
−1.01 (−1.65, −0.36)
−1.09 (−1.91, −0.27)
−1.04 (−1.95, −0.13)
−0.97 (−1.75, −0.18)
−1.00 (−1.64, −0.36)
−0.93 (−1.62, −0.24)
−1.01
−1.98 (−3.71, −0.24)
−1.74 (−3.05, −0.43)
−1.98 (−3.62, −0.33)
−2.06 (−4.74, 0.61)
−1.97 (−3.28, −0.67)
−1.87 (−3.46, −0.28)
−1.90 (−3.70, −0.10)
−1.98 (−3.59, −0.37)
−1.95 (−3.31, −0.59)
−2.04 (−3.45, −0.63)
−1.95
−3.28 (−5.54, −1.03)
−3.05 (−4.84, −1.27)
−3.33 (−5.55, −1.10)
−3.40 (−7.17, 0.36)
−3.23 (−4.97, −1.49)
−3.11 (−5.15, −1.07)
−3.01 (−5.48, −0.55)
−3.34 (−5.59, −1.10)
−3.29 (−5.21, −1.37)
−3.25 (−4.99, −1.51)
−3.23 190 225 193 217 221 209 222 227 229 229 215 100 101 95 98 99 92 96 104 100 107 99 51 57 51 48 51 54 53 50 51 49 51 30 33 30 29 31 32 33 30 30 31 31
−6 −5 −3 1 0 1
Generalizing Methods and Year RD (95% CI)
No. Needed to Treat
Risk Difference, % 1 1 1 1 1 1 1 1 1 1 1 2 2 2 2 2 2 2 2 2 2 2 3 3 3 3 3 3 3 3 3 3 3 4 4 4 4 4 4 4 4 4 4 4
Figure 3. Risk difference (RD, %) and 95% confidence interval (CI) of the rosuvastatin effect in the primary cardiovascular prevention in Justifi
Poststratification (method 3) can be considered another form of weighting to assess the generalizability of RCT results by re-weighting the subgroup-specific treatment effects to match the distribution of those subgroups in the target population. The major limitation for this method is that it works only for cate-gorical variables. In addition, while lacking individual data or data on joint distributions, this method standardizes only for the distribution of one effect modifier at a time. We then used the average of the estimates poststratified by effect modifiers as the overall estimate. Although we found that the estimates from poststratification varied considerably according to effect
modi-fiers, the average was very close to the JUPITER original esti-mate. Our results indicate that the range of poststratified estimates across effect modifiers, rather than the average, might be more informative to understand the generalizability of RCT results when lacking individual data on the target population. This method might be particularly useful when there is a strong effect
modi-fier or as a way to identify effect modifiers that could substan-tially influence generalizability of RCT results.
Of greater clinical interest, a simple method has been pro-posed and advocated to estimate the expected absolute treat-ment effect as a function of baseline risk in the target population (method 4) (14,15). This method assumes a homogeneous treat-ment effect on the relative scale within and across the popula-tions. Although it conflicts with the fundamental hypothesis of heterogeneity in our study, this method is easy to implement and to interpret but requires data on the absolute risk for the outcome of interest in the target population. It could be a quick tool for clinicians in combination with, for example, a Framingham risk score, but it might not be the optimal approach to assess the generalizability of randomized trial results. Our study using the JUPITER trial as an example provides evidence on het-erogeneous treatment effect on both the relative and absolute scale. In addition, ideally, this method requires the same defi -nition of the outcome in the trial and target population, which might be improbable when relying on previous publications to get baseline risks in the target population.
In theory, all these generalizing methods are easily imple-mented given wide availability of aggregate data on potential target populations. In practice, however, it will often be difficult to obtain aggregate data from the target population that match the trial’s inclusion and exclusion criteria exactly, thus violating the positivity assumption. Based on our results, weighting meth-ods using simulated individual data (method 1) and the method of moments (method 2) are preferred but require more complex programming techniques. Although the performance of the generalizing methods based on aggregate data depends on the achieved covariate balance and the relationship between these effect modifiers and treatment effects, our study shows that we should avoid using continuous variables when implement-ing weightimplement-ing methods based on aggregate data because of difficulties in understanding actual distributions without individual data. In some circumstances, where a strong effect modifier is suspected or complex programming is not possible, poststratification (method 3) and expected absolute risk reduction (method 4) should be considered.
In conclusion, our study demonstrates the possibility of gen-eralizing trial results to target populations even in the absence of individual data on the target population using a single case study. These methods, using aggregate data about the target laboratorytestresultsascontinuousversuscategoricalvariables
in the analysis. We are not aware of literature exploring the impact ofvariable typeon generalizing trial results, butwe speculate that these differences are likely due to failure to repli-catetruevariabledistributions. Meanandstandarddeviation are commonly used to describe the distribution of continuous variables,buttheydescribethedistributionwellonlyfora nor-mally distributed variable. Thus, for not-normally distributed variables,weareunabletoreweightthetrialparticipantsto match the actual distributions in the target population in the absenceofindividualdata,despiteachievingthesamemean and standard deviation between the weighted trial and target population.Toinvestigatethisfurther,weexaminedthe distri-bution of age before and after weighting in our study and pres-entthehistogramsinWebFigure2.Inthetargetpopulation, age is not normally distributed, with 2 peaks at 50 and 60 yearsbecauseofdifferentage-inclusioncriteriabetweenthe sexes in JUPITER. The gold-standard method based on indi-vidual datareweightedtheJUPITERparticipantstohavethe same distribution of age as the target population; however, meth-ods1and2failedtodoso.Incontrast,thediscretedistribution for a binary or categorical variable can be successfully matchedbetweentheweightedtrialandthetargetpopulation without individual data. Categorization of continuous variables mightbeanissuewhen thereremainsresidualheterogeneity within the category (17). We categorized age in 5-year intervals andcategorizedlaboratorytestresultsbasedonaprioriclinical input to minimize residual heterogeneity within the category.
Weightingmethodsbasedonaggregatedataareinevitably limited in the ability to match multidimensional distributions ofeffectmodifiersbetweentheweightedtrialandtarget pop-ulation due to lack of individual data or data on joint distribu-tions.Althoughweightingmethodsinvolvingparametric modeling require the assumption of correct model specifi ca-tion(18–20),covariatebalanceinjointdistributionsisrarely assessed in confounding control. However, covariate balance injointdistributionsisimportantbecausethegoalhereisto reweight RCT participants to the target population on all effectmodifiers,includingthosespecifictoacertain covari-ate pattern. We examined the variable balance in subgroups stratified bysex after reweightingthe RCT participants to have similar marginal distributions of variables as the target population(WebTables2and3).Wefoundthatcovariates remained balanced after stratifying by sex in the gold-standard methodbutworseneddramaticallyinmethods1and2. Individ-ual data or data on joint distributions of relevant effect
modi-fiersareneededtoovercomethislimitation.
Under the assumption of no correlation between effect
population, could be useful tools for timely assessment of RCT generalizability, including to individual patients in clinical care, although use of individual data or (at a minimum) data on joint distributions remains the best approach to generalize the RCT results to target populations.
ACKNOWLEDGMENTS
Author affiliations: Department of Epidemiology, Gillings School of Global Public Health, University of North
Carolina at Chapel Hill, Chapel Hill, North Carolina (Jin-Liern Hong, Michael Webster-Clark, Michele Jonsson Funk, Til Stürmer, Stephen R. Cole); R&D Information,
AstraZeneca, Waltham, Massachusetts (Sara E. Dempster); and Medical Evidence and Observational Research, AstraZeneca, Gaithersburg, Maryland (Iksha Herr, Robert LoCasale).
This work was supported by AstraZeneca. T.S. is supported by the National Institutes of Health (grants R01/ R56 AG023178, R01 AG056479, R01 CA174453, R01 HL118255, R01 MD011680, UL1 TR001111, and R21-HD080214). M.J.F. is supported in part by the National Institutes of Health (grants R01 HL118255, R01/R56 AG023178, UL1 TR001111, and R01 AG056479) and Health Resources and Services Administration (grant R40 MC29455-01-00). S.R.C. is supported in part by the National Institutes of Health (grants R01 AI100654, R24 AI067039, U01 AI103390, P30 AI050410, and DP2 HD084070).
Portions of this work were presented at the International Society for Pharmacoepidemiology 33rd Annual Meeting, August 26–30, 2017, Montreal, Quebec, Canada.
Conflict of interest: J.-L.H. is currently an employee of Takeda Pharmaceuticals International Co., but the study was conducted while she was a postdoctoral associate at
University of North Carolina. R.L. and S.E.D. were employees of AstraZeneca at the time of the study. I.H. is currently employed by AstraZeneca. T.S. and M.J.F. do not accept personal compensation of any kind from any pharmaceutical company, although they receive salary support from the Center for Pharmacoepidemiology in the Department of Epidemiology, Gillings School of Global Public Health (current members: GlaxoSmithKline, UCB BioSciences, Merck & Co. Inc., and Shire). M.J.F. is a member of the Scientific Steering Committee for a
postapproval safety study of an unrelated drug class funded by GlaxoSmithKline. All compensation for services provided on the Scientific Steering Committee is invoiced by and paid to University of North Carolina Chapel Hill. T.S. owns stock in Novartis, Roche, BASF, AstraZeneca, and Novo Nordisk.
REFERENCES
1. Cole SR, Stuart EA. Generalizing evidence from randomized
clinical trials to target populations: the ACTG 320 trial.Am J
Epidemiol. 2010;172(1):107–115.
2. Stuart EA, Cole SR, Bradshaw CP, et al. The use of propensity scores to assess the generalizability of results from randomized
trials.J R Stat Soc Ser A Stat Soc. 2011;174(2):369–386.
3. Kern HL, Stuart EA, Hill J, et al. Assessing methods for generalizing experimental impact estimates to target
populations.J Res Educ Eff. 2016;9(1):103–127.
4. Ridker PM, Danielson E, Fonseca FA, et al. Rosuvastatin to prevent vascular events in men and women with elevated
C-reactive protein.N Engl J Med. 2008;359(21):2195–2207.
5. Olsen RB, Orr LL, Bell SH, et al. External validity in policy
evaluations that choose sites purposively.J Policy Anal
Manage. 2013;32(1):107–121.
6. Glynn RJ, Koenig W, Nordestgaard BG, et al. Rosuvastatin for primary prevention in older persons with elevated C-reactive protein and low to average low-density lipoprotein cholesterol
levels: exploratory analysis of a randomized trial.Ann Intern
Med. 2010;152(8):488–496.
7. Ridker PM, MacFadyen J, Cressman M, et al. Efficacy of
rosuvastatin among men and women with moderate chronic kidney disease and elevated high-sensitivity C-reactive protein:
a secondary analysis from the JUPITER (Justification for the
Use of Statins in Prevention: an Intervention Trial Evaluating
Rosuvastatin) trial.J Am Coll Cardiol. 2010;55(12):
1266–1273.
8. Ridker PM, MacFadyen JG, Fonseca FA, et al. Number
needed to treat with rosuvastatin to preventfirst
cardiovascular events and death among men and women with low low-density lipoprotein cholesterol and elevated
high-sensitivity C-reactive protein: Justification for the Use
of Statins in Prevention: an Intervention Trial Evaluating
Rosuvastatin (JUPITER).Circ Cardiovasc Qual Outcomes.
2009;2(6):616–623.
9. Cole SR, Lau B, Eron JJ, et al. Estimation of the standardized risk difference and ratio in a competing risks framework: application to injection drug use and progression to AIDS after
initiation of antiretroviral therapy.Am J Epidemiol. 2015;
181(4):238–245.
10. Westreich D, Edwards JK, Lesko CR, et al. Transportability of
trial results using inverse odds of sampling weights.Am J
Epidemiol. 2017;186(8):1010–1014.
11. Signorovitch JE, Sikirica V, Erder MH, et al. Matching-adjusted indirect comparisons: a new tool for timely
comparative effectiveness research.Value Health. 2012;15(6):
940–947.
12. Signorovitch JE, Wu EQ, Yu AP, et al. Comparative effectiveness without head-to-head trials: a method for matching-adjusted indirect comparisons applied to psoriasis treatment with adalimumab or etanercept.
Pharmacoeconomics. 2010;28(10):935–945.
13. Phillippo DM, Ades AE, Dias S, et al. Methods for population-adjusted indirect comparisons in health technology appraisal.
Med Decis Making. 2018;38(2):200–211.
14. Caro JJ, Migliaccio-Walle K. Generalizing the results of clinical trials to actual practice: the example of clopidogrel therapy for the prevention of vascular events. CAPRA (CAPRIE Actual Practice Rates Analysis) Study Group. Clopidogrel versus Aspirin in Patients at Risk of Ischaemic
Events.Am J Med. 1999;107(6):568–572.
15. Collins R, Reith C, Emberson J, et al. Interpretation of the
evidence for the efficacy and safety of statin therapy.Lancet.
2016;388(10059):2532–2561.
16. Spiegelman D, Khudyakov P, Wang M, et al. Evaluating public health interventions: 7. Let the subject matter choose the
effect measure: ratio, difference, or something else entirely.Am
17. Altman DG, Royston P. The cost of dichotomising continuous
variables.BMJ. 2006;332(7549):1080.
18. Drake C. Effects of misspecification of the propensity score on
estimators of treatment effect.Biometrics. 1993:49(4):
1231–1236.
19. Tsiatis AA, Davidian M. Comment: demystifying double robustness: a comparison of alternative strategies for
estimating a population mean from incomplete data.Stat Sci.
2007;22(4):569–573.
20. Smith JA, Todd PE. Does matching overcome LaLonde’s critique
of nonexperimental estimators?J Econom. 2005;125(1–2):305–353.
21. Pingel R, Waernbaum I. Correlation and efficiency of
propensity score-based estimators for average causal effects.
Commun Stat Simul Comput. 2017;46(5):3458–3478. 22. Hong JL, Jonsson Funk M, LoCasale R, et al. Generalizing
randomized clinical trial results: implementation and
challenges related to missing data in the target population.Am
J Epidemiol. 2018;187(4):817–827.
23. Yang D, Dalton JE. A Unified Approach to Measuring the Effect
Size Between Two Groups Using SAS.SAS Global Forum
2012. 2012; paper 335.http://support.sas.com/resources/papers/