DEMAND ANALYSIS
1. This background note begins with a brief description of the educational profile of Kerala. This is followed by an analysis of key employment trends based on India’s National Sample Survey and Annual Survey of Industries to understand the projected trend in demand for skilled labor across the different sectors and sub-sectors within Kerala. The purpose of this exercise is to ascertain the relevance of the vocational courses being offered under the Government of Kerala’s Additional Skill Acquisition Program (ASAP).
A. Kerala – Brief Education Profile
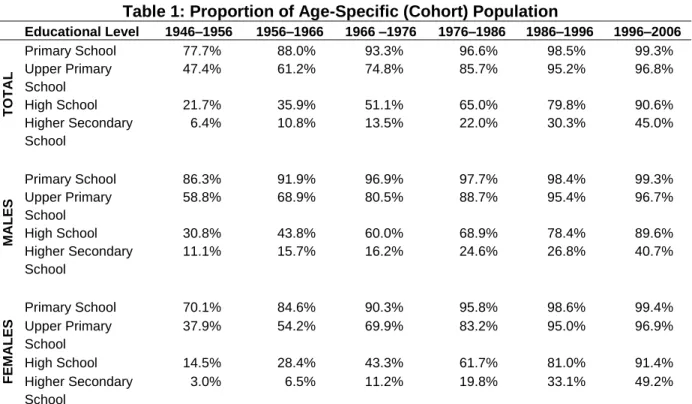
2. Education. The table below details the proportion of age-specific (cohort) population entering each school level:1
Table 1: Proportion of Age-Specific (Cohort) Population
Educational Level 1946–1956 1956–1966 1966 –1976 1976–1986 1986–1996 1996–2006 TOTAL Primary School 77.7% 88.0% 93.3% 96.6% 98.5% 99.3% Upper Primary School 47.4% 61.2% 74.8% 85.7% 95.2% 96.8% High School 21.7% 35.9% 51.1% 65.0% 79.8% 90.6% Higher Secondary School 6.4% 10.8% 13.5% 22.0% 30.3% 45.0% M ALES Primary School 86.3% 91.9% 96.9% 97.7% 98.4% 99.3% Upper Primary School 58.8% 68.9% 80.5% 88.7% 95.4% 96.7% High School 30.8% 43.8% 60.0% 68.9% 78.4% 89.6% Higher Secondary School 11.1% 15.7% 16.2% 24.6% 26.8% 40.7% FEM ALE S Primary School 70.1% 84.6% 90.3% 95.8% 98.6% 99.4% Upper Primary School 37.9% 54.2% 69.9% 83.2% 95.0% 96.9% High School 14.5% 28.4% 43.3% 61.7% 81.0% 91.4% Higher Secondary School 3.0% 6.5% 11.2% 19.8% 33.1% 49.2%
Source: On the Diffusion of School Educational Attainment in Kerala State, Centre for Development Studies, 2011.
3. It is observed that there is a higher degree of drop-outs for males as compared to females during the transition between upper primary to higher school (Male: 7.1%; Female: 5.5%) and high school to higher secondary school (Male: 48%; Female: 42%). Probability of continuing schooling up to higher secondary was observed to be 0.55 for male students and 0.69 for female students. Table 2 shows the female dominance at all levels of higher education:
1
Table 2: Female Dominance in Higher Education
Integrated Certificate Diploma PG Dip. UG PG M Phil PhD
Male 754 650 23,112 30 230,286 24,823 186 1,418
Female 1,040 6,253 32,490 133 300,704 41,909 413 1,451
Source: Annual Status of Higher Education of States and Union Territories in India, November 2013.
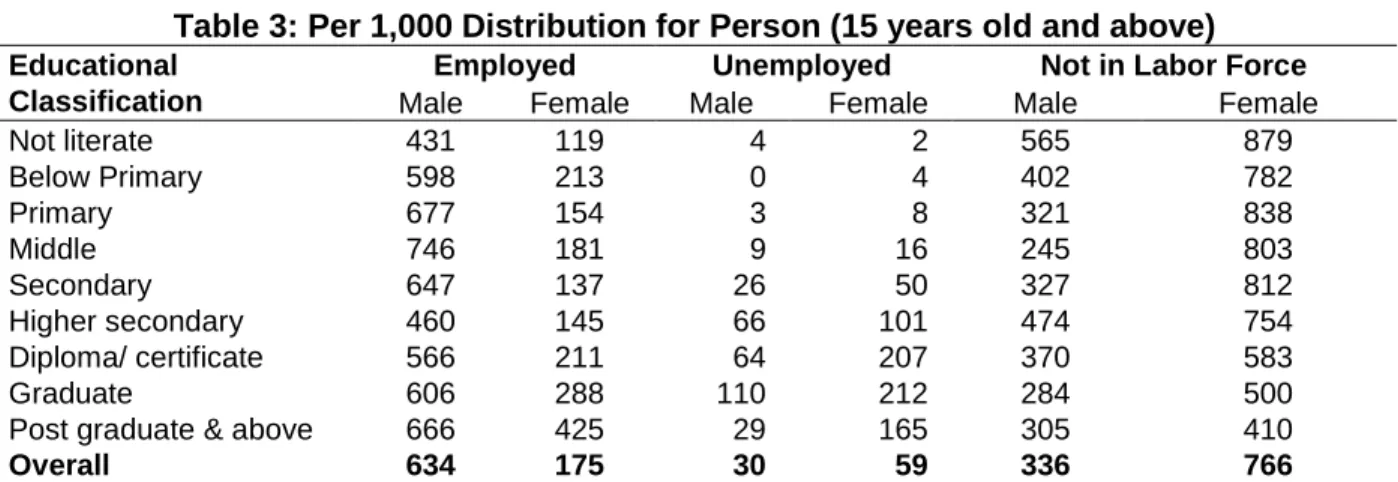
4. The continuance of education by females for a longer duration has also constrained their workforce participation. Table 3 details per 1,000 distributions for persons aged 15 years and above by educational classification according to usual principal status approach:
Table 3: Per 1,000 Distribution for Person (15 years old and above) Educational
Classification
Employed Unemployed Not in Labor Force
Male Female Male Female Male Female
Not literate 431 119 4 2 565 879 Below Primary 598 213 0 4 402 782 Primary 677 154 3 8 321 838 Middle 746 181 9 16 245 803 Secondary 647 137 26 50 327 812 Higher secondary 460 145 66 101 474 754 Diploma/ certificate 566 211 64 207 370 583 Graduate 606 288 110 212 284 500
Post graduate & above 666 425 29 165 305 410
Overall 634 175 30 59 336 766
Source: Government of India, Ministry of Labour and Employment. 2013. Report on Employment & Unemployment Survey, 2012-13. Delhi.
B. Demand Analysis
5. Key assumptions. (i) Industry growth will follow the sector-specific cumulative average rate of growth during the past 7 years; (ii) skills requirements will follow the same rate of growth of the industry; (iii) gender proportion at population, workforce, migration, etc., as recorded in actual by FY2011, will continue to remain through FY2017; and (iv) occupational opportunities and preferences continue to remain the same through FY2011–2017.2 Suitable adjustments are made for new occupation profiles and changing aspirations of the youth.
6. Sector analysis. During the past 7 years, there is evidence of transition in the economic structure of the state—between primary (FY2005: 18% of the gross domestic product [GDP] to FY2012: 9% to GDP) to tertiary (FY2005: 60% of GDP to FY2012: 70% of GDP). The secondary sector seems to be stuck at the 20% range (FY2005: 23% to GDP to FY2012: 20% to GDP). However, given the state’s development plans to promote growth of manufacturing sector,3 there is considerable scope for continued growth.
7. Kerala is faced with a complex challenge, due to the compounded impact of the following factors:
2 The fiscal year (FY) of the Government of India ends on 31 March. “FY” before a calendar year denotes the year in
which the fiscal year starts, e.g., FY2014 begins on 1 April 2014 and ends on 31 March 2015.
3
State Level Actions to Promote Growth of Manufacturing (Resources and Capability Review), Centre for Research, Planning & Action, July 2012.
(i) higher dependence of the economy on growth in tertiary sector, with a constrained secondary sector;
(ii) sudden and rapid decline of agriculture which provided employment opportunities for a large number of women, especially those residing in rural areas;
(iii) over 60% of the population with higher educational attainments (above Class X) emigrating or migrating outside the state for better employment;
(iv) reduction in the proportion of emigrants, coupled with higher return emigrants and inter-state out migrants;
(v) higher proportion of male student drop outs by Class X, in contrast to increase in duration and higher educational attainment of female students not available for the labour market and also not meeting the skills demands that can catalyse industry growth; and
(vi) increase in dependent (aged) population.
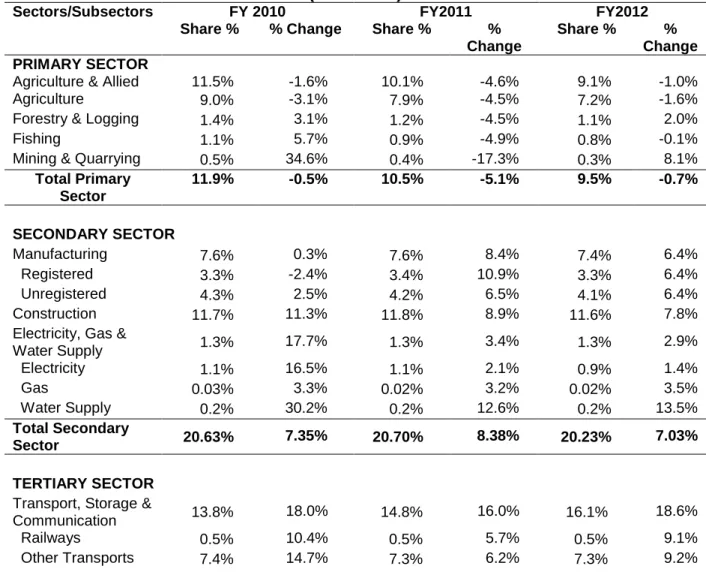
Table 4: Trend in GSDP (at Factor Cost by Industry of Origin) at Constant Prices (2004–2005)
Sectors/Subsectors FY 2010 FY2011 FY2012
Share % % Change Share % %
Change
Share % %
Change PRIMARY SECTOR
Agriculture & Allied 11.5% -1.6% 10.1% -4.6% 9.1% -1.0%
Agriculture 9.0% -3.1% 7.9% -4.5% 7.2% -1.6%
Forestry & Logging 1.4% 3.1% 1.2% -4.5% 1.1% 2.0%
Fishing 1.1% 5.7% 0.9% -4.9% 0.8% -0.1%
Mining & Quarrying 0.5% 34.6% 0.4% -17.3% 0.3% 8.1%
Total Primary Sector 11.9% -0.5% 10.5% -5.1% 9.5% -0.7% SECONDARY SECTOR Manufacturing 7.6% 0.3% 7.6% 8.4% 7.4% 6.4% Registered 3.3% -2.4% 3.4% 10.9% 3.3% 6.4% Unregistered 4.3% 2.5% 4.2% 6.5% 4.1% 6.4% Construction 11.7% 11.3% 11.8% 8.9% 11.6% 7.8%
Electricity, Gas &
Water Supply 1.3% 17.7% 1.3% 3.4% 1.3% 2.9% Electricity 1.1% 16.5% 1.1% 2.1% 0.9% 1.4% Gas 0.03% 3.3% 0.02% 3.2% 0.02% 3.5% Water Supply 0.2% 30.2% 0.2% 12.6% 0.2% 13.5% Total Secondary Sector 20.63% 7.35% 20.70% 8.38% 20.23% 7.03% TERTIARY SECTOR Transport, Storage &
Communication 13.8% 18.0% 14.8% 16.0% 16.1% 18.6%
Railways 0.5% 10.4% 0.5% 5.7% 0.5% 9.1%
Sectors/Subsectors FY 2010 FY2011 FY2012
Share % % Change Share % %
Change
Share % %
Change
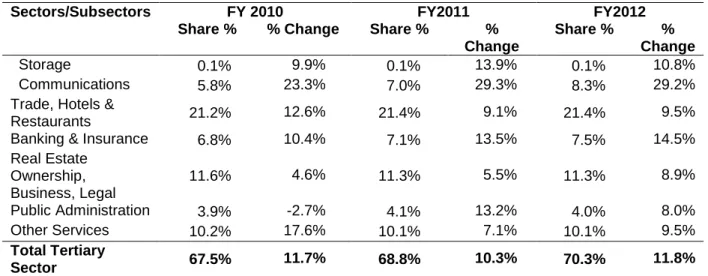
Storage 0.1% 9.9% 0.1% 13.9% 0.1% 10.8%
Communications 5.8% 23.3% 7.0% 29.3% 8.3% 29.2%
Trade, Hotels &
Restaurants 21.2% 12.6% 21.4% 9.1% 21.4% 9.5%
Banking & Insurance 6.8% 10.4% 7.1% 13.5% 7.5% 14.5%
Real Estate Ownership, Business, Legal 11.6% 4.6% 11.3% 5.5% 11.3% 8.9% Public Administration 3.9% -2.7% 4.1% 13.2% 4.0% 8.0% Other Services 10.2% 17.6% 10.1% 7.1% 10.1% 9.5% Total Tertiary Sector 67.5% 11.7% 68.8% 10.3% 70.3% 11.8%
GSDP = gross state domestic product.
Source: Government of Kerala. 2013. Gross Domestic Product of Kerala and India from 2004-05 to 2011-12.
Thiruvananthapuram.
8. The demand analysis (Table 4) shows that the key growth sectors in the state include: (i) Communication, which consistently grew with 2% contribution to GDP in
FY2005 to 8% in FY2012;
(ii) Banking and insurance, which contributed over 5% to the GDP in FY2005 has steadily grown to contributing to over 7%;
(iii) Construction, consistently contributes to over 12% of the GDP between FY2005 to FY2012;
(iv) Tourism sector, especially the Trade, Hotels & Restaurants sub-sectors, continues to dominate the state’s economic structure with its consistent contribution of over 21%; and
(v) Real estate ownership, business, legal, etc., consistently contributes to over 11% of the GDP over FY20015–2012.
9. Table 5 estimates the additional demand for skilled workforce assuming the above growth patterns will continue until FY2017.
Table 5: Estimated Sector and Sub-Sector-Wise Additional Workforce Demand (FY2017) Manpower Demand
Sector/Sub-Sector Male Female
Primary Sector (88,542) (39,905)
Agriculture, Forestry, and Fishing (94,469) (39,905)
Mining and Quarrying 5,927
Secondary Sector 1,607,996 502,799
Manufacturing 479,876 227,033
Electricity, gas, steam, and air conditioning supply 3,072 389
Water supply, sewerage, waste management, and remediation activities
2,047 7,386
Tertiary Sector 3,637,422 1,120,978 Wholesale and retail trade; repair of motor vehicles and
motorcycles
913,384 173,421
Transportation and storage 1,457,904 40,263
Accommodation and Food service activities 137,008 22,297
Information and Communication 198,806 75,493
Financial and Insurance activities 125,345 64,906
Real estate activities 113,842 -
Professional, scientific and technical activities 455,365 572,557
Administrative and support service activities 39,427 5,192
Public administration and defence; compulsory social security 21,403 2,263
Education 16,897 16,906
Human health and social work activities 13,518 9,186
Arts, entertainment and recreation 7,886 133
Other service activities 104,105 37,061
Activities of households as employers; undifferentiated goods and services producing activities of households for own use
32,532 101,300
Total Additional Workforce by FY2017
5,156,876 1,583,872
Source: Asian Development Bank analysis.
10. Table 6 shows details of the sub-sectors with current and projected levels of strong, moderate, and low employment demand in a gender-disaggregated manner.
Table 6: Summarizing Key Current and Emerging Trends in Labor Demand Occupational Profile with STRONG Employment Prospects Occupational Profile with MODERATE Employment Prospects Occupational Profile with VERY LOW Employment Prospects
Occupational Profile Current Projected
Male Female Male Female
Primary Sector
Agriculture, Animal husbandry labourers Cultivator
Fishermen / Fish related work Mining and quarry worker Secondary Sector
Manufacturing Blacksmith
Chemical engineer Fabrication worker
Food processing and related worker Machinery repair worker / Welder Manufacturing labourer Mechanical engineer Shoe maker Construction Brick layer Building electrician Carpenter
Occupational Profile Current Projected
Male Female Male Female
Civil engineer (construction) Civil engineer (design)
Construction worker / labourer Contractor
Crane operator / Lift operator / Safety officer
Electrical engineer Electrician
Floor layer
Plumber / pipe fitter
Electricity, Gas & Water Supply Tertiary Sector
Transport & Storage Automobile Engineer Heavy truck and lorry driver Loading / Unloading worker Locomotive engine driver Motor vehicle driver Motor vehicle mechanic
Porter in railway station / airport Storekeeper
Transport labourer Vehicle cleaner Communication
Computer Professional, Assistant Data entry operator
Cable layer and related work Trade, Hotels & Restaurants
Bakery worker Barber / hairdresser Beautician
Book binding related worker Cook in Hotels and Restaurants Physical Fitness & Dietician Hotel administration staff Proprietor
Shop Salesman Street vender
Tourist Guides & Language Translators Waiter in restaurant
Banking & Insurance Actuary
Credit Analysts
Capital Markets Analysts Commodity Markets Agents Insurance agent
Occupational Profile Current Projected
Male Female Male Female
Money lender
Real Estate Ownership, Business, Legal, etc.
Advocate & Legal service Facilities Management Site agent
Site supervisor Public Administration
Cashier, ticket clerks, clerks, accountant Door keeper and Security staff
Journalists / Newspaper reporter / editor Manager
Messenger
Office clerk / accounting clerk Peon
Politician
Project Management Sweeper and related worker Other Services
Chartered Accountant / Cost Accountant Child care worker / Anganwadi worker Doctor
Domestic helper
Geriatrics/ Palliative Care
Household worker / Maid / Servant Housekeeper / cook in households Laboratory / X-ray Technician Naturopathy/ Nature Therapy Nurse and Nursing assistant Painter
Pharmacist
Photography related worker Physiotherapy
Poojari / Pastor
Repair of electronic equipments Sewer / embroidery related work Tailor / dress maker
Teacher / Lecturer Washer man
Source: Asian Development Bank analysis
11. Table 6 shows that the tertiary sector, in particular communication; banking, finance, and insurance; hospitality and tourism; and health care will see robust growth in terms of labor demand in the coming years. These are also the areas where ASAP is offering vocational training. Some of ASAP’s training courses being offered as of July 2014 are summarized below:
(i) Communication. Vocational courses for basic information technology, data entry operators, mobile communication, PC hardware and networking, optical fibre
communication, mobile handset salesmen, and various business process outsourcing-related jobs.
(ii) Banking, finance, and insurance. Vocational courses to train as certified capital markets professionals, mutual fund and insurance agents, banking services associates, loan advisors, accountants, and customer care executives.
(iii) Allied health care. Certificate courses to train as Dental Assistants, Community Nursing, and Palliative Care Assistants.
(iv) Hospitality. Certificate courses to train in Hospitality Management, Food & Beverages, Front office Management, and Housekeeping Operations.
(v) Electronics. Certificate courses to train in Electronic Product Testing and Printed Circuit Board Manufacturing.
(vi) Other growth areas. Certificate course to train as Retail Associates, Plumbing Associates, Media Correspondent, and Junior Rubber Technicians.
12. It needs to be noted that these areas also match with the emerging youth aspirations as noted in the Kerala Skill-Gap Study, 2013 commissioned by the National Skill Development Corporation.4 Table 7 provides details.
Table 7: Youth Aspirations in Kerala
INCRE ME NT AL MANP O W E R D E MAN
D High Medium Building Construction Food Processing Communication Retail BFSI
Real Estate Services Chemicals and Pharmaceuticals Travel, Tourism, and Hospitality
IT & ITes Health care Engineering Products-MSME Education and Skills Development
Low Handlooms and
Handicrafts
Utilities
Transportation and Logistics Textiles and Garments
Media Entertainment
Low Medium High
YOUTH ASPIRATIONS
BFSI = Banking, Financial Services and Institutions, IT = information technology, ITES = information technology-enabled services, MSME = Ministry of Micro, Small, and Medium Enterprises.
Source: Kerala Skill-Gap Study, 2013
4
Government of India, National Skill Development Corporation. 2013. District-wise Skill-Gap Study of Kerala, 2012–