Power Intelligence and Asset Monitoring
System
Karunakara Rai B
1, Akhilesh Jandhyala
1, Shantharama Rai C
21Dept. of ECE, NMIT, Bangalore, India
2
Dept. of ECE AJIET, Mangalore, India
Abstract - Research showed that manually monitoring the parameters of a transformer at the power grid or at the distribution transformer located in different areas of the city to be rather tricky and difficult. System failures, overloading and leakages account to a major loss in the electricity boards. As a result, a fault tolerant system had to be built in order to forecast and predict these faults and failures in components beforehand based on daily usage. This paper proposes the idea of asset monitoring system in transformers in an intelligent way. The idea was to establish the technique of remote labs and industrial IoT. This wireless form of monitoring the parameters - active power, reactive power, apparent power, three phase voltage and current analysis of a transformer based on predictive analysis, would be a huge turnover to a country’s economy and thereby saving millions of dollars that is associated with these losses.
Keywords-Active power; Apparent power; Distribution transformer; Fault tolerant; Predective Analysis; Reactive power.
I. INTRODUCTION
All around the world extensive usage of electricity is bringing about a considerable amount of stress that is neglected and ultimately it just snaps on us. The importance of an asset monitoring system that not only does a more efficient job but also is done so remotely was needed all around the world. Numerous modules and prototypes have been implemented and tested in different places. As a result, the built-up prototype was tested by localizing it to a city in India. Power pre-dominantly occupies a much healthier part of India‟s annual budget so any significant power outage would directly have adverse effects on the nation‟s wealth. At a certain point in the year 2013, it was recorded that the electricity board needed periodic rescues from the Central Government due the amount of losses faced. About an estimated 40% of loan was made towards the Discoms ( Electricity
Distribution Companies) and SEBs( State Electricity Boards) in the past decade. Since the country‟s economy depends on the amount of work being done and managed, an intelligent power monitoring system device had to be designed and implemented. Time and money are the factors that promise a brighter tomorrow.
As a result, with the present scenario of the problem, proper use of this electricity had to be taken into consideration. As we all know, the Electricity boards are responsible for the distribution of electricity throughout the city. With thousands of houses, offices, hotels, shops, small scale industries within a small area itself, it was rather a stressful job for all the members in the electricity boards to monitor the situation on a daily basis. All these years, the public have been doing their part of just paying their monthly bills on time and enjoying the continuous supply of electricity. In the year 2013, the country incurred losses of about 5 lakh crores in the power sector alone. Recent statistics tell us that India is 4th largest consumer of electricity in the world (also 3rd largest producer of the same). Initiatives have been taken with the help of the private firms getting a green signal from the government to establish a path and tackle this problem. In India the total installed power stations generate about 345.68 Gigawatt (GW) of power. The losses in terms of money as mentioned above accounts to 12-17% of the power that is either wasted or not utilized. Hence if this percentage of power wastage or loss can somehow be put into better use or minimize the same, it could bring about huge economic upfronts and better investments in the country.
their life span is reduced considerably. Under such circumstances, the components tend to degrade and as a result their performance is hindered. In Power grids, the fixing of faulty lines could prove hazardous to the maintenance crew [3]. Now what if this problem can be seen ahead? What if this problem can be forecasted and be dealt with to rectify the same before it has drastic impact on the device? To tackle this situation, we come to the objective of this paper, which is to discuss about the device built and used to enable a 24/7 fault tolerant system alongside the transformer (remotely) and as a result bring about “smart grids” that could benefit the city, or even the entire country in the long run.
To monitor data from a far, it was crucial on how we can transmit the real time data to a location that need not be anywhere near the transformer [2-7]. Before doing this, all the issues at the base stations had to be addressed. We are aware that distribution of electricity stands vital to the fact that we are making optimal use of it and not going overboard [2]. This brought about the idea of remote labs. Remote labs establish a path to communicate and retrieve real time data over the internet whilst the device is present in a different geographical location itself. Transformers have been proven expensive to establish [4][8] As a result, it was important to not hamper any existing components or even for fact, the ongoing working of the device without drastic changes in it. The proposed device can be easily integrated to the existing transformer.
II. LITERATURE REVIEW
As health monitoring of a transformer became more and more important, a number of approaches started finding their way into helping the electricity boards for a better analysis and hence providing an effective risk management crisis. In [1] the technique involves the use of a GSM mobile module as the base of operational transfer of real time data captured or retrieved. The operation mechanism is controlled by the microcontroller where the input data is compared with pre-set values embedded in the EEPROM memory. The GSM provides a bridge of communication between the mobile phone and the microcontroller integrated to the transformer system. On a more complex level, paper [2] tells us about the transfer of data via a more modern approach of IOT and a remote terminal unit. The use of PIC (18F4550) microcontroller and GPRS technology set path for the results obtained. The remote terminal unit is linked to a certain IP address that provides a path
via the internet to help transfer data. With a number of sensors embedded into the module of this proposed idea and a buzzer connected to the RTU side, the data retrieved was saved periodically as well. Power transformers too require continuous monitoring just like the distribution transformers situation within cities for end user capabilities. The design in [3] is done so using a P89V51RD2 Microcontroller. The sensing units are designed using a MSP430 processor that helps collect the vital information from the transformer. With an LCD display used, this approach was undertaken and tested various number of times. In paper [4] provides an insight for implementing the ideology of a smart grid. Smart grids seem to be the rising trend and need of establishing the same to provide a more futuristic approach into handling a situation in hand; which here is mainly been referred to transformers. this particular paper shows us off with the capability of automated switching and restoring service provided by an intelligent server. As a result [4] describes the proposed algorithm for an IDFA (intelligent distribution fault anticipation. Texas A&M university made use of SCADA systems as well to implement this device for usage based on their proposed algorithms. On a similar scale of establishing a smart grid, [5] made use of their own proposed fault diagnosis schemes (FDA) in order to analyse and provide before hand fault corrections in various fields of data being constantly fed at the input and used for calculations. This FDA is used alongside a smart grid simulator designed by the first author in order to gauge upon the faults that are taking place during distribution in the area. These two papers [4-5] showcases the handling of active and passive failures and also make sure the frequency of receiving data is at a faster rate and perform a quantitative assessment study so as to pre-determine the manner or approach to rightfully tackle the situation in hand and hence reduce power outages for a long period of time.
authors in [7] bring us back to necessities of smart grids and how they not only serve the purpose in our dynamic living lifestyle but also how it turns out to be a future trend that helps overcome infrastructure challenges and build future systems and not just keep it old fashioned and think in terms of marketing. The distribution automation and embedded intelligence gives it the state-of-the-art ability to foresee a certain unwanted situation and hence optimize operations so as to provide an uninterrupted form of power supply. Other algorithms like the fuzzy logic has been explained [9]. With the utilization of a common known language, the C++ alongside a hardware module (the Raspberry Pi), the paper still lacks in modern advancement and sticks to the old fashioned cleaning of bushing in transformer and hence monitoring the hardware materials on a timely basis upon analysing the parameters [8] brings to us one of the most advanced mechanisms of monitoring data. With numerous ideas pitching in and efforts all around, the most prominent method had to be chosen and further advancements in the same had to be done. Developed on a base of a single ship computer and monitoring data on at the end user remotely, tells us how much people and technology has evolved in establishing a strong future. Artificial intelligence also steers in the right direction of providing futuristic systems as it is dealt with in [10]. Here the standard computational systems or methods are replaced by a superior neural network prescribed models so analyse and compare with the predefined values. With all these techniques discussed, they all seemed to have their own set of cons. From old fashioned techniques and not keeping up with modernization in technology to just limiting the assessment to only about 5 parameters, this paper establishes a firm ground to tackle this problem and implement the same on a more complex level and thereby enabling monitoring of over 15 parameters.
III. METHODOLOGY
A prototype was designed and tested on a small-scale level. The remote access of any data to be transferred to another location required to be done so wirelessly for obvious reasons. So, the technique used here was industrial IoT (Internet of Things). Internet with the help of electricity supply is something we use most widely considering everything we wish to find out or even wish to know is all available within seconds. So, in this project the two main divisions that we can see is the a) Hardware level and b) Software level. Upon testing the data obtained is first acquired with help of data acquisition and then transferred over the internet (WIFI) and then monitored remotely, as shown in the figure below.
Figure 1. System flow overview block diagram.
IV. IMPLEMENTATION
A code that is programmed to run on the server receives the data from microcontroller through wireless interface and organise it in an explicable manner. This program also consists of a script that notifies the user of any warnings. A 16-bit or 32-bit micro-controller capable of receiving 12- 16 channel analog data at 10 samples/second is connected to different sensors such as thermocouple , Humidity sensor, Gas sensor, proximity, light & motion sensors to keep track of physical parameters along with connections to fault diagnosing lines of the equipment , supply mains and other peripherals . The obtained data is constantly monitored and acquired in real time through the sensors and is pumped wirelessly over TCP/IP or UDP to the server level where it is categorised and analysed. It also writes data with date and time stamp to a storage device – SD card in case of minor applications and Hard Disk in case of major ones. In case of bad connectivity, this data can be retrieved later when connectivity is back on. This serves as a black box for the whole system if the system goes down and the reason for failure can be known by analysing this storage.
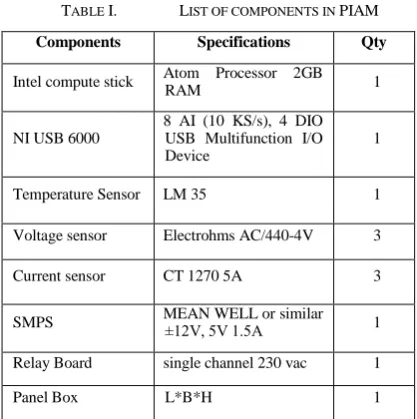
TABLE I. LIST OF COMPONENTS IN PIAM
Components Specifications Qty
Intel compute stick Atom Processor 2GB
RAM 1
NI USB 6000
8 AI (10 KS/s), 4 DIO USB Multifunction I/O Device
1
Temperature Sensor LM 35 1
Voltage sensor Electrohms AC/440-4V 3
Current sensor CT 1270 5A 3
SMPS MEAN WELL or similar ±12V, 5V 1.5A 1
Relay Board single channel 230 vac 1
Panel Box L*B*H 1
Transformer junction box PIAM Remote link
Schneider or similar
make MCB 415Vac, C6 1
panel based 3 phase
connecters 440Vac, 5 amps 1
Exhuast Fan 230Vac Supply 1
4G modem JIO/Airtel 1
Power Regulator /
DC to DC
Converter
I/P 12VDC, O/P
5Vdc,3A 1
Batteries with
charger 12Vdc,2.2A 1
UPS 600 VA, APC 1
power line modem D link, High speed up to
1000 Mbps 1
A fix in case of underflow or overflow of sensor values indicating malfunctioning. Possible solution with stepwise instructions is displayed in simple language so that even a technician can understand it and resolve the issue. In case of some machine faults, which are not detected by a regular fuse, automatic shutdown of the machine is initiated to prevent damage. The table-1 gives a summary of the list of components along with its specifications used to implement the device.
The values obtained from the transformer have to be calibrated as per our requirements. This calibration is done with the help of a LabView code. This code, as a file is dumped onto the intel stick. This calibration not only allows us to manage parameters of input values but also use this raw data to apply for in various formulae. Once these required parameters have been retrieved or gathered with the help of the code and various sensors present in the junction box, it is sent over the internet to the remote user interface system. The Intel-Stick present acts like a mini computer that enables all the processing of the data and calculation work to be done without anyone‟s interference. This provides a platform for a hassle-free acquisition of data on the system. The aim was to handle up to 42 parameters and provisions were made to display real time data for 15 parameters only. All these were stored into a storage device that was like the black box. The precision of the real time data was tested and found to be about 30 seconds per reading. The retrieved data was analysed by importing the data into MATLAB. With the acquired data points, operations such as data forecasting was done. With detailed analysis of required parameters over a period of time, a detailed chart can be obtained. Figure 2 gives the assembly of the device in use.
Figure 2. Assembly of PIAM integrated with the transformer.
PIAM device consists of 5 main regions namely: MCB, Voltage Sensor board, OEM board to FRC board (DAQ), current sensor, SMPS. Voltage sensor directly gives the data and is acquired onto the DAQ, where as the current sensor gets its input from tapping the current lines that are connected to the transformer. MCB controls the entire on/off working of the device. The SMPS delivers 230 volts AC from transformer onto the voltage sensor which converts it to dc supply. Any voltage fluctuations will be reported to the server by this sensor. A UPS is connected to the PIAM to ensure uninterrupted service.
At the remote user interface system, we have a number of different parameters that are enlisted (RYB phases). This image in figure-3 is a screenshot taken during live recording of data with help of remote access to the PIAM.
Figure 3. Monitoring of different parameters obtained from the PIAM junction box.
Power consumption by any system is categorized into three types:
Reactive power – Constitutes inductive power consumption and capacitive power consumption
Apparent power – It is the result of active power and reactive power which can be calculated using Pythagoras formula.
Apparent power (S) can be calculated as,
S = (P2 + Q2)1/2 (1)
where
S = Apparent power consumed by the system
P = Reactive power dissipated in reactive load
Q = Active power consumed by resistive load
KVA is the unit of measurement for the apparent power. The AC power is the product of voltage and AC current. For single phase, the current is the product of electric potential and the underlying current whereas the three phase current (I3p) is measured as in equation 2.
SI3p = 1.732 E I (2)
where „E‟ is the electric potential and „I‟ is the current.
In Active Power measuring unit is KW (Kilo-watts). The single phase current is given by equation 3 and 4.
QI1p = E I cos φ (3)
= E I PF
(4)
where
„φ‟ is phase difference between the current and electrical potential, and Power Factor (PF) is given
by „cos φ‟.
Here the three phase current is given by equation 5.
QI3p = 1.732 E I PF (5)
Reactive power is the result of inductive and capacitive powers. An effort to minimize the reactive power consumption will result in increase of power efficiency of the system.
The unit for measurement of reactive power is kilo volt-amperes reactive (KVAR).
Single Phase Current in reactive power is given by equation 6
PI1p= EI sin φ (6)
„φ‟ is phase difference between the current and electrical potential. In this case three phase current is given by equation 7.
PI3p = 1.732 E I sin φ (7)
The formulae listed above were incorporated into the LabView code in order to calibrate based on the information received directly from the transformer. Intel-Sick helps with the process management of the entire system. It was a
formidable approach to perform the necessary actions and to handle the same in an orderly fashion.
V. RESULT
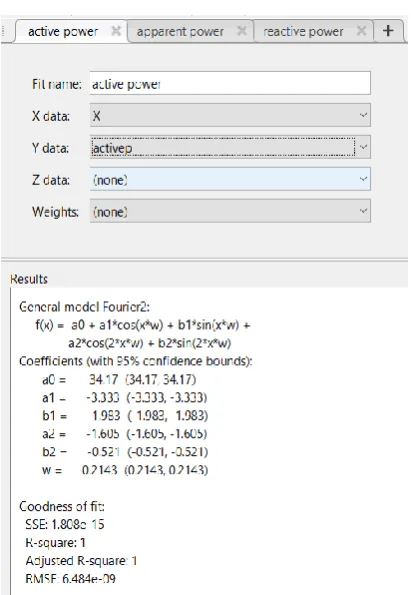
With the help of continuous access to data and acquiring these data points, there was a level of forecasting which was undertaken for about 6 data points with equal intervals (4 hours). With the help of MATLAB, the forecasted value for 24 hours has been plotted into a graph in figure-4.
Figure 4. Forecasted values for active, apparent and reactive power in curve fitting.
Figure 5. Selection of parameters for generating graph.
effective management of the resource in hand and with the geographical location that it was tested in accordance with.
CONCLUSION
This PIAM system has been extensively tested over last 3 months in various remote labs spanning wide variety of machinery. The advantage of this system is customization and adaptability with the existing one. Other key outcomes include effective management of environmental factors due to continuous monitoring and prevention of serious damage because of automatic shutdown in case of a serious fault. The major achievement of this proposal is saving the detection time by 45%. It also synchronizes the software embedded with the existing hardware. The device facilitates real time monitoring thereby providing a well-engineered platform with high level safety. This provides scope for implementing highly complex architectures of remote labs. Further evolution of PIAM can be made possible by adding more functionalities and safety features. Development of Low energy Wi-Fi along with new protocols and spectrum will result in its advancement.
REFERENCES
[1] Sajidur Rahman, Shimanta Kumar Dey, Bikash Kumar Bhawmick and Nipu Kumar Das, “Design and Implementation of Real Time Transformer Health Monitoring System Using GSM Technology”, International Conference on Electrical, Computer and
Communication Engineering (ECCE), February 16-18, 2017.
[2] Rohit R. Pawar, Priyanka A. Wagh, S.B.Deosarkar, “Distribution Transformer Monitoring System Using Internet of Things (IoT)”, 2017 International Conference on Computational Intelligence in Data Science(ICCIDS). [3] K.Gowri, T.Thangam, Rajasaranya, “TRANSINFORMER –
An Integrated System for Health Monitoring of Power Transformers”, IJCSMC, Vol. 2, Issue. 4, April 2013, pp no.105 – 110.
[4] Russell B.D., Benner C.L., “Intelligent Systems for Improved Reliability and Failure Diagnosis in Distribution Systems”, IEEE Transactions on Smart Grid June 2010, Volume: 1, Issue: 1, pp: 48 – 56.
[5] Shahram Kazemi, Member of IEEE, Matti Lehtonen and Mahmud Fotuhi-firuzabad “Impacts of fault diagnosis schemes on distribution system reliability.”IEEE transactions on smart grids, Vol.3, No.2, June 2013, pp. 720-727.
[6] A. A. Nelson, G. C. Jaiswal, M. S. Ballal and D. R. Tutakne, "Remote condition monitoring system for distribution transformer," 2014 Eighteenth National Power Systems Conference (NPSC), Guwahati, 2014, pp. 1-5
[7] El-hawary, Mohamed E. The Smart Grid State-of-the-art and Future Trends Published in journal Electric Power Components and Systems ,Vol 42, Issue 3-4. PY 2014 [8] G. C. Jaiswal, M. S. Ballal, D. R. Tutakne and P. Vishnu,
"Intelligent condition monitoring system for distribution transformer and health status diagnosis," 2018 International Conference on Power, Instrumentation, Control and Computing (PICC), Thrissur, 2018, pp. 1-6. [9] G. C. Jaiswal, M. S. Ballal and D. R. Tutakne, "Health index
based condition monitoring of distribution transformer," 2016 IEEE International Conference on Power Electronics, Drives and Energy Systems (PEDES), Trivandrum, 2016, pp. 1-5.