Asian J Pharmaceut Res Health Care Volume 5 Issue2 81-88
AJPRHC
Research Article
PREPARATION AND EVALUATION OF EXTENDED RELEASE NIMESULIDE TABLET BASED ON DIFFUSION CONTROLLED MECHANISM
VIVEK P. CHAVDA1*, VISHAL RUPAPARA1, MOINUDDIN M. SONIWALA1, JAYANT R. CHAVDA1
1
Department of Pharmaceutics, B. K. Mody Government Pharmacy College, Rajkot-360003, Gujarat (India)
*Corresponding author
E-mail: [email protected]
This paper is available online at www.jprhc.in
ABSTRACT
Now a days the concept of controlled release is quiet popular amongst the formulation scientists. The aim of this study was to develop a once-daily sustained release matrix tablet of Nimesulide using hydroxyl propyl methylcellulose (HPMC K4M) as release controlling factor and to evaluate drug release parameters as per various release kinetic models. The tablets were prepared using wet granulation method. Total of five batches were prepared from which two selected batches were further evaluated. Different dissolution models were applied to drug release data in order to evaluate release mechanisms and kinetics. The “n” Value of both batches indicates that the drug release mechanism follows “Anomalous Transport”. From all these data it is quite clear that batch F2 is optimized as its release kinetic was found to be as per Korsmeyer Peppas model rather than first order of F4.
KEY WORDS: Nimesulide; Carbopol 934 P; HPMC K4M; diffusion controlled.
INTRODUCTION
Since last two decades formulation scientists are more interested in controlled release formulation. This goal can be achieved either using polymer based matrix/reservoir system or by osmotic delivery. The prolonged release dosage forms have many advantages in safety and efficacy over immediate release products in that frequency of dosing can be reduced drug efficacy can be prolonged and the incidence of adverse effects can be decreased. Extended release drug formulations have been used since 1960’s from which drug is available over extended time period after oral administration. By incorporating the dose for 24 h into one tablet from which the drug is slowly released. This formulation helps to avoid the side effects associated with low concentration and high concentrations. The ideal drug delivery system should show a constant zero-order release rate and maintain the constant plasma concentrations.1 it can be utilized for chronomediated drug delivery. With minimum dose improvement in bioavailability is achieved with improvement in treatment efficacy.2
Depending on the part of the release unit in which the drug diffusion takes place, diffusion controlled release systems are divided into matrix systems (also referred to as monolithic systems) and reservoir systems. In matrix systems diffusion occurs in pores located within the bulk of the release unit, and in reservoir systems diffusion takes place in a thin water-insoluble film or membrane, often about 5-20 m thick, which surrounds the release unit. Diffusion through the membrane can occur in pores filled with fluid or in the solid phase that forms the membrane.2,3
Asian J Pharmaceut Res Health Care Volume 5 Issue2 81-88
1. The Liquid that surrounds the dosage from penetrates the release unit and dissolves the drug. A concentration gradient of dissolved drug is thus established between the interior and the exterior of the release unit.
2. The dissolved drug will diffuse in the pores of the release unit or the surrounding membrane and thus be released or alternatively, the dissolved drug will partition into the membrane surrounding the dose unit and diffuse in the membrane.
A dissolution step is thus normally involved in the release process but the diffusion step is the rate-controlling step. The rate at which diffusion will occur depends on four variables: 1. the concentration gradients over the diffusion distance, 2. the area, 3. the distance over which diffusion occurs and 4. the diffusion co-efficient of the drug. Some of these variables are used to modulate the release rate in the formulation.2
MATERIAL AND METHOD
1. Material
The following materials were used: Nimesulide (ACS chemicals, Mumbai) was utilized as active ingredient, HPMC K4M (Color con, Mumbai), Carbopol 934 P (Corel pharma chem), magnesium stearate and PVPK30 (Sd fine chemicals, Mumbai) were obtained and used as received. All other chemicals used were of analytical grade.
2. Method of preparation
Wet granulation method was utilized to prepare tablet.3 Accurately weighed active ingredient (See Table 1) was sifted through sieve #20 and all other ingredients PVP K 30, HPMC K4M, Carbopol 934 P except magnesium stearate were sifted through sieve #20 followed by the lubricant material Magnesium stearate 10.0 mg was sifted through sieve#40. Then the active pharmaceutical ingredient and the intragranular (PVP K30) materials were loaded in a double cone blender and mixed for 15 min. Using a granulating agent(IPA) the dry mix was granulated and granulation was done till it forms uniform granules. The wet granular mass of the above step was taken in to a rapid air dryer. Then the wet mass was dried at an inlet temperature of 500oC and LOD of the dried granules should not be more than3%. Then the dried granules were sifted through sieve # 20. The sifted granules and the sifted extra granular material are loaded in to the double cone blender. They were mixed for 5 min. and the blend was characterized for the different physical parameters. The prepared blend was compressed into tablets by using 16-station rotary press, cadmach Ahmedabad-8,India.
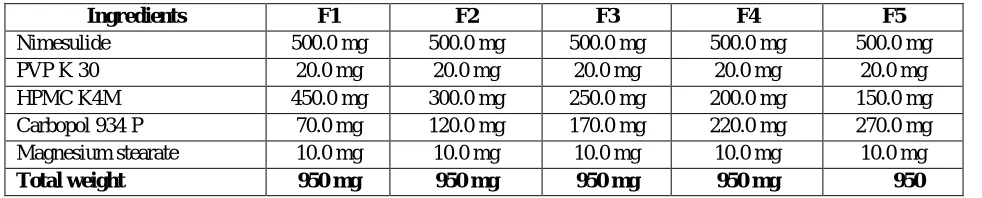
Table 1: Formulation ingredients of prepared batches
Ingredients F1 F2 F3 F4 F5
Nimesulide 500.0 mg 500.0 mg 500.0 mg 500.0 mg 500.0 mg
PVP K 30 20.0 mg 20.0 mg 20.0 mg 20.0 mg 20.0 mg
HPMC K4M 450.0 mg 300.0 mg 250.0 mg 200.0 mg 150.0 mg
Carbopol 934 P 70.0 mg 120.0 mg 170.0 mg 220.0 mg 270.0 mg
Magnesium stearate 10.0 mg 10.0 mg 10.0 mg 10.0 mg 10.0 mg
Total weight 950 mg 950 mg 950 mg 950 mg 950
3. Organoleptic properties6
Asian J Pharmaceut Res Health Care Volume 5 Issue2 81-88
4. Angle of repose
Angle of repose was determined by measuring the height, radius of the heap of the powder blend. A cut system funnel was fixed to a stand and bottom of the funnel was fixed at a height of 2 cm from the plane. Powder blend was placed in funnel and allowed to flow freely and measured the height and radius of the heap.7
tan =h/ Where, h = height of heap
r = radius of heap
Table 2: Angle of repose values
Angle of repose (in degrees) Type of flow < 25 Excellent
25-30 Good
30-40 Satisfactory
>40 Very poor
5. Bulk density
A bulk density is defined as the mass of powder divided by the volume. A bulk density is largely depends on the particle shape, as particles becomes more spherical in shape, bulk density is increase. In addition as granules size increase, bulk density decrease. Powder weighing 10 g was placed into 100 ml measuring cylinder. Volume occupied by the powder was noted without disturbing the cylinder and bulk density was calculated in gm/ml by the following equation.
6. Tapped density
Tapped density is achieved by mechanically tapping a measuring cylinder containing a powder sample. After observing the initial volume, the cylinder is mechanically tapped and volume reading is taken until further volume changes are observed. The mechanical tapping is achieved by raising the cylinder and allowing it to drop under own weight a specific distance. Device that rotates the cylinder during tapping may be preferred to minimize any possible separation of the mass during tapping down.
Asian J Pharmaceut Res Health Care Volume 5 Issue2 81-88
7. Compressibility index (Carr’s index) and hausner’s ratio
Compressibility index of the drug was determined using the following formula
It can be calculated as;
8. Hardness test
Hardness was measured using Monsanto hardness tester. For each batch ten tablets were tested. The force required to break the tablet is recorded. The hardness of tablets of each batch was measured in kg/cm2. 6
9. Uniformity of weight
The weight variation test was carried out by weighing 20 tablets individually, calculating the average weight, comparing the individual tablet weight to average weight. The tablet meet IP test if no tablet differs by more than two times of percentage deviation.8
10. Friability Test
Tablet friability is lower than conventional fast dissolving tablets prepared by low compression. The friability of a sample of 10 tablets was measured using a Roche Friabilator. Twenty pre-weighed tablets were rotated at 25 rpm for 4 minutes /20-rotations. After 20 rotations, the friability (% weight lost) is typically less than 1%. 9
11. Water absorption ratio/Swelling study
A piece of tissue paper is placed in a small Petri dish and a tablet is put on the tissue paper allowing to completely wet. The wetted tablet is then weighted and water absorption ratio, R is determined using following equation;
R = 100 × Wa –Wb/Wa
Where, Wa = Weight of tablet after water absorption Wb = Weight of tablet before water absorption.
12. Dissolution study and model fitting
In-vitro release rate of prepared tablets will be carried out using United State Pharmacopoeia (USP) XXIV dissolution testing apparatus (Paddle type). Phosphate buffer pH 7.4 (900 ml) was utilized as dissolution medium. A sample of 10 ml of the solution is withdrawn from the dissolution apparatus. The sample volume is replaced with fresh dissolution medium. The samples are filtered through Whatman filter paper No 40 and analyzed in UV spectrophotometerat 403 nm. The percentage drug release is calculated using an equation obtained from the calibration curve. The data obtained are fitted in to different model so as to ascertain the release mechanism.
Asian J Pharmaceut Res Health Care Volume 5 Issue2 81-88
Experimental batches were validated to confirm the accuracy and reproducibility of physical and chemical characteristics. Tablets were compressed without any problem and do not require any change in ratio of excipient in formulation. Tablets prepared were smooth, shiny and do not require coating as for experimental purpose. With respect to organoleptic characterizations all batches are smooth, light yellow with slight bitter taste afterward.
1. Granule and tablet characterization
The prepared granules and tablets were evaluated so as to check its efficacy. The attributes that are ascertained are summarizes in Table 3. It can be seen from the table that all are within the phrmacopoeial limits which adjudicates its suitability as a dosage unit.
Table 3: Evaluations of prepared tablets
Test Parameters
Result
F1 F2 F3 F4 F5
Angle of
repose( )
29.02±0.12 30.11±0.34 32.01±0.21 33.21±0.34 39.21 ± 0.72
Tapped density 0.51±0.002 0.54 ±0.0005 0.57±0.001 0.53±0.001 0.52±0.001
Bulk density 0.43±0.002 0.47±0.001 0.39±0.001 0.49 ±0.001 0.48±0.0005
Carr’s index 15.68±1.08 12.96 ±1.10 31.58±1.02 7.5 ± 2 12.87±1.04
Hausner’s ratio 1.18 ±0.02 1.13 ±0.01 1.46 ±0.01 1.08 ± 0.2 1.18±0.016
Hardness 4.2 kg/cm2 ±
0.15
4.33 kg/cm2 ± 0.35
3.8 kg/cm2 ± 0.46
4.5 kg/cm2 ± 0.57
4.8 kg/cm2 ± 0.74
Friability 0.532 % 0.285 % 0.817 % 0.292 % 0.436 %
% swelling (2 h) 52 % ± 2 60 % ± 1 62 % ± 4 67 % ± 2 72 % ± 2
Uniformity of weight
950 ± 2.3 950 ±1.48 950 ±1.08 950 ± 1.8 950 ± 1.67
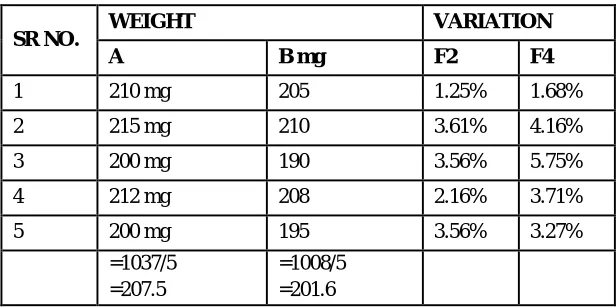
From the results given in table 3 total two batches (F2 and F4) were selected for further evaluation as they were found optimum with respect to desired criteria. Weight variation is being done using five tablets as shown in Table 4.Five tablets are weighed individually and average weight taken. The weight of tablet deviate from average weight is calculated.
Table 4: Weight variation test
SR NO. WEIGHT VARIATION
A B mg F2 F4
1 210 mg 205 1.25% 1.68%
2 215 mg 210 3.61% 4.16%
3 200 mg 190 3.56% 5.75%
4 212 mg 208 2.16% 3.71%
5 200 mg 195 3.56% 3.27%
=1037/5
=207.5
=1008/5
Asian J Pharmaceut Res Health Care Volume 5 Issue2 81-88
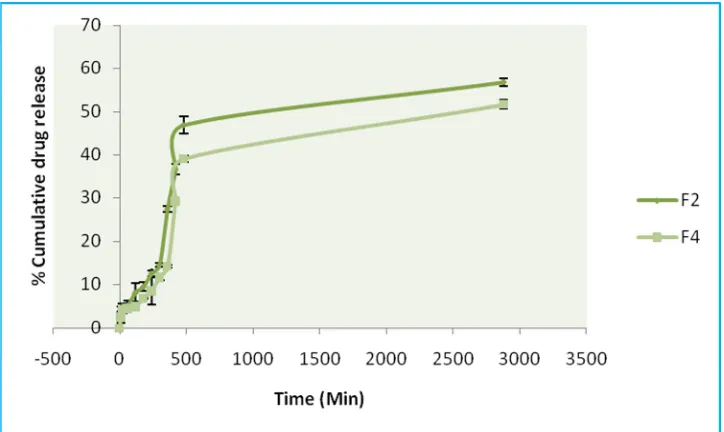
2. Dissolution study and model fitting
For the controlled release under investigation, which is a matrix-tablet comprising drug, and hydrophilic polymer, the release should follow three steps. First step is the penetration of the dissolution medium in the tablet matrix (hydration). Second step is the swelling with concomitant or subsequent dissolution or erosion of the matrix and third step is the transport of the dissolved drug, either through the hydrated matrix or from the parts of the eroded tablet, to the surrounding dissolution medium. The comparative dissolution profiles of both batches are given in
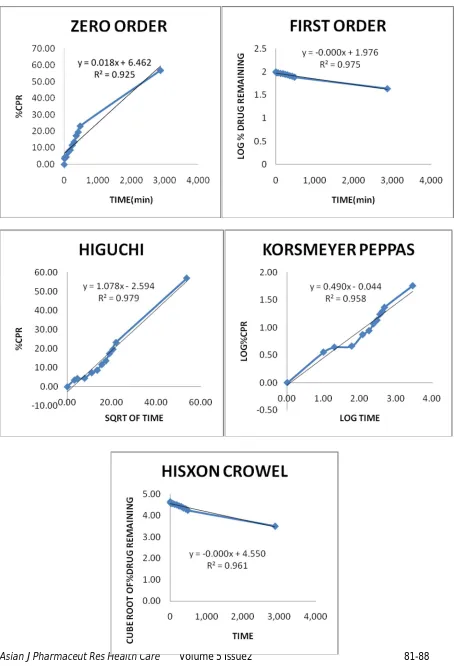
figure 1. Model fitting of obtained data is summarized in Table 5 and Figure 2. From all these data it is quite clear that batch F2 is optimized as its release kinetic was found to be as per Korsmeyer Peppas model rather than first order of F4.
Figure 1: Comparative dissolution profile of selected batches (n = 3, ± SD)
From the dissolution profile it is clearly seen that batch F2 is more reliable in terms of drug release and all other aspects hence it was found to be most cogent from the experimental point of view. Hence it is selected for model fitting.
Table 5: Model fitting of batches
Sr. No. ZERO ORDER
FIRST
ORDER HIGUCHI
KORSMAYER PEPPAS
HIXSON-CROWELL Batch
F2
R2 0.9255 0.9750 0.9791 0.9586 0.9619
SSR 191.18 0.137 35.675 0.094 1.317
Batch F4
R2 0.9198 0.9633 0.9592 0.18 3.542
Asian J Pharmaceut Res Health Care Volume 5 Issue2 81-88
Asian J Pharmaceut Res Health Care Volume 5 Issue2 81-88
CONCLUSION
The study aimed to prepare extended release tablet of Nimesulide. Total five batches were prepared from which two are selected for further evaluation. The weight variation of tablet test was passed for the selected batches. The hardness is enough for conventional dosage route. % CPR is above 50 % after two days. The “n” Value of both batches indicates that the drug release mechanism follows “Anomalous Transport”. Swelling property is good for sustained release. Friability study Test passes in both batches. In short the prepared batches especially F2 matches the desirability criteria.
REFERENCES
1. Karthikeyan M, Arunachalam A, Ravikiran N, Ashutosh Kumar S, Eswaramma P, Manidipa P. Formulation And Evaluation Of Zolpidem Tartrate Extended Release Matrix Tablets. International Journal of Pharmaceutical & Biological Archives 2010;1(5):421 – 8.
2. Pogula M, Nazeer S. Extended Release Formulation. International Journal Of Pharmacy & Technology Review 2010;2(4):625- 84.
3. Chandira M, Venkateswarlul Bs, Shankarraol Ja, Bhowmik D, Jayaka B, Narayana Tv. Formulation and Evaluation of Extended Release Tablets containing Metformin HCl. International Journal of ChemTech Research 2010;2(2):1320-9.
4. Korsmeyer Rw, Von Meerwall E , Peppas Na. Solute and penetrant diffusion in swellable polymers. II. Verification of theoretical models. J Polym Sci PolymPhys Ed, 1986b;24:409-34.
5. Siepmann J, Kranz H, Bodmeier R, Peppas Na. HPMC-matrices for controlled drug delivery: a new model combining diffusion, swelling and dissolution mechanisms and predicting the release kinetics. Pharm Res 1999b;16:1748-56.
6. Gandhi SD, Pandya PR, Jani GK, Upadhyay NN, Nagaich U. Formulation Development and Evaluation of Colon Targeted Tablets of Secnidazole for the Treatment of Amoebiasis. Int J Pharm Sci Rev Res 2010;5(3):64-71. 7. Zade PS, Kwatikwar PS, Sakarkar DM. Formulation evaluation and optimization of fast dissolving tablets
containing tizanidine hydrochloride. International Journal of Pharm Tech Research 2009;1(1):34-42.
8. Uniformity of Weight of Single-Dose Preparations. Indian phamacopoeia 2010;The Indian pharmacopoeia commission,Ministry of health and family welfare:192.