Copyright © 2003, American Society for Microbiology. All Rights Reserved.
Development and Verification of an Automated Sample Processing
Protocol for Quantitation of Human Immunodeficiency
Virus Type 1 RNA in Plasma
Brenda G. Lee,
1Kristin R. Fiebelkorn,
2† Angela M. Caliendo,
2and Frederick S. Nolte
2*
Clinical Laboratories, Emory University Hospital,1and Department of Pathology and Laboratory Medicine,
Emory University School of Medicine,2Atlanta, Georgia
Received 8 November 2002/Returned for modification 30 December 2002/Accepted 7 February 2003
We developed and verified an automated sample processing protocol for use with the AMPLICOR HIV-1 MONITOR test, version 1.5 (Roche Diagnostics, Indianapolis, Ind.). The automated method uses the MagNA Pure LC instrument and total nucleic acid reagents (Roche Applied Science, Indianapolis, Ind.) to extract human immunodeficiency virus type 1 (HIV-1) RNA from plasma specimens. We compared the HIV-1 load results for a dilution series (1 to 5 nominal log10copies/ml) and 175 clinical specimens processed by the
automated method to those for the same samples processed by the manual methods specified by the manu-facturer. The sensitivity, dynamic range, and precision of the viral load assay obtained by automated process-ing of specimens were similar to those obtained by an ultrasensitive manual processprocess-ing method. The results were highly correlated (R2, 0.95), and were in close agreement, with a mean difference of 0.09 log
10(standard
deviation, 0.292). The limits of agreement were ⴞ0.58 log10for results for samples processed by both the
manual and the automated methods. These performance characteristics were achieved with a smaller sample volume (200 versus 500l) and without a high-speed centrifugation step and required only 15 min of labor for a batch of 32 samples. In conclusion, the automated sample preparation protocol can replace both the standard and the ultrasensitive manual methods used with the AMPLICOR HIV-1 MONITOR test and can substantially reduce the labor associated with this test.
The AMPLICOR HIV-1 MONITOR test (Roche Diagnos-tics Corporation, Indianapolis, Ind.) is a PCR assay for the quantification of human immunodeficiency virus type 1 (HIV-1) that can be used with either of two manual sample preparation protocols, the standard protocol or the ultrasen-sitive protocol. By the standard manual protocol, HIV-1 RNA is isolated directly from 200l of plasma by lysis of the virus with a chaotropic agent followed by precipitation of the RNA with alcohol. By the ultrasensitive manual protocol, HIV-1 particles in 500l of plasma are concentrated by high-speed centrifugation, followed by lysis of the virus with a chaotropic agent and precipitation of the RNA with alcohol. These man-ual procedures are labor-intensive and prone to operator er-ror.
We developed and verified an automated sample prepara-tion protocol for use with the AMPLICOR HIV-1 MONITOR test on the MagNA Pure LC (MPLC) system (Roche Applied Science, Indianapolis, Ind.). The MPLC system uses robotics, precision pipettors, and magnetic glass particles to purify DNA, RNA, mRNA, or total nucleic acid from various sample types. The samples are dissolved and simultaneously stabilized by incubation with a buffer containing denaturing agents and proteinase K. Nucleic acids are bound to the surface of the magnetic glass particles, and several washing steps remove the
unbound substances. The purified nucleic acids are then eluted in a low-salt buffer, with variable elution volumes ranging from 50 to 100l. The instrument can process up to 32 samples in 1.5 h. It can also automate the PCR setup and can transfer the purified nucleic acids directly into a wide variety of reaction vessels, including LightCycler capillary tubes (Roche Applied Science), 96-well microplates, standard PCR tubes, and CO-BAS AMPLICOR amplification rings (Roche Diagnostics).
Although originally developed for the research laboratory, the MPLC system is finding increased use in clinical laboratory settings where reproducible and cost-effective alternatives to manual methods for the processing of large numbers of spec-imens are needed (2–5). In this study the effects of the auto-mated sample preparation protocol on the analytical sensitiv-ity, precision, and dynamic range of the AMPLICOR HIV-1 MONITOR test, version 1.5, were investigated. The correla-tion and agreement of viral load results for plasma samples prepared in parallel by the manual and the automated methods were also assessed.
MATERIALS AND METHODS
Plasma samples.Remaining aliquots of EDTA-anticoagulated plasma sam-ples submitted to the Molecular Diagnostic Laboratory, Emory Medical Labo-ratories, for HIV-1 load determination were selected for use in this study. The plasma samples were collected, transported, and stored according to established guidelines for the AMPLICOR HIV-1 MONITOR test. A reference plasma sample, NAC-HIV-1, was purchased from Acrometrix, Benecia, Calif. Dilutions of some plasma samples were made in normal human plasma provided with the AMPLICOR HIV-1 MONITOR test kit to adjust the HIV-1 RNA concentra-tions.
Manual sample preparation.Both the standard and the ultrasensitive manual sample preparation protocols for the AMPLICOR HIV-1 MONITOR test were performed as recommended by the manufacturer.
* Corresponding author. Mailing address: Clinical Laboratories, Emory University Hospital, Room F145, 1364 Clifton Rd. NE, Atlanta, GA 30322. Phone: (404) 712-7297. Fax: (404) 712-4632. E-mail: fnolte @emory.edu.
† Present address: Department of Pathology, University of Texas Health Science Center at San Antonio, San Antonio, Tex.
2062
on May 15, 2020 by guest
http://jcm.asm.org/
MPLC sample preparation.The MPLC total nucleic acid isolation kit was used in conjunction with the MPLC instrument (software version 2.1) to process the plasma samples. The sample volume was 200l, and the total nucleic acid isolation reagents and instrument were used as recommended by the manufac-turer, with the following exceptions. The HIV-1 quantitation standard provided with the AMPLICOR HIV-1 MONITOR test kit was added to the lysis buffer at a ratio of 1.7l per 300l of lysis buffer (0.0057) prior to its addition to the reagent tub. The nucleic acid was eluted from the magnetic glass particles in 65 l of elution buffer. Fifty microliters of each processed sample was added to reaction tubes containing the working master mixture for reverse transcription and PCR amplification. The sample volume factor used to convert the number of copies per PCR mixture to the number of copies per milliliter of plasma for samples processed with the MPLC system was calculated to be 6.4. The high-positive control provided with the AMPLICOR HIV-1 MONITOR test kit diluted in water (12.5l in 200l) and a reference plasma sample, NAC-HIV-1, were processed with the samples on the MPLC instrument as positive controls. Two different lots of total nucleic acid kits were used in this study.
Viral load determinations.Samples were processed in parallel by either the standard or the ultrasensitive manual method and the MPLC protocol for viral load determinations with the AMPLICOR HIV-1 MONITOR test, version 1.5. This test was performed according the instructions of the manufacturer, and two different lots of kits were used in this study. The dynamic range of the test with the standard manual sample processing protocol was from 400 (2.6 log10) to 750,000 (5.87 log10) HIV-1 RNA copies/ml, and that with the ultrasensitive manual sample processing protocol was 50 (1.7 log10) to 100,000 (5 log10) HIV-1 RNA copies/ml.
Statistics.All statistics were calculated by using log10-transformed viral load values. Descriptive statistics, Student’sttests andFtests for variances, and linear regression lines were calculated by using the data analysis tool pack that is part of Microsoft Excel 2000 software. Agreement between viral load results for samples processed by the different methods was assessed by the method of Bland and Altman (1).
RESULTS
Table 1 shows the essential parameters of the three sample processing methods used in this study. For each sample pro-cessing method, the number of HIV-1 copies per milliliter was calculated by the following equation: total HIV-1 OD450/(total
QS OD450 ⫻ input number of QS copies/PCR mixture ⫻
sample volume factor), where OD450is the optical density at
450 nm and QS is the quantitation standard. Only the sample volume factor was changed when the number of HIV-1 copies per milliliter was calculated for samples extracted by different methods (Table 1).
A dilution series was prepared from a pool of three high-titer positive plasma specimens diluted in normal human plasma. It spanned a 5-log10concentration range from
approx-imately 10 to 105copies/ml. Table 2 shows the results of
rep-licate viral load determinations of dilution series samples ex-tracted by both the standard manual and the MPLC protocols. The viral load values for the samples extracted by the two
protocols were highly correlated (R2, 0.97) and in close
agree-ment. The precision of the viral load determinations was sim-ilar for samples extracted by the standard manual and MPLC protocols, with average standard deviations of 0.124 and 0.151, respectively (P⫽0.49, Student’sttest).
The MPLC sample processing protocol detected 100% of the eight replicates containing 1.7 nominal log10copies/ml and
50% of the replicates containing 1 nominal log10copy/ml. The
standard manual protocol was approximately 1 log10less
sen-sitive, detecting 100% of the replicates at a low concentration of 2.7 nominal log10copies/ml. A plot of the measured versus
the expected log10number of HIV-1 copies per milliliter for
samples processed by the MPLC protocol showed a linear response over the concentration range (R2, 0.99) (Fig. 1).
We next processed a total of 140 plasma specimens in par-allel by the manual and the MPLC protocols. The ultrasensi-tive manual method was used for 92 (66%) of the specimens, and the standard manual method was used for 48 (34%) of the specimens. Discrete values were obtained for both viral load determinations with 127 specimens. HIV-1 RNA was not de-tected (HIV-1 OD450⬍0.2) in four specimens processed
man-ually and six specimens processed by the MPLC protocol. The mean log10viral load determined for manually extracted
spec-imens was 3.44 (median, 3.22), with values ranging from a low of 1.12 log10copies/ml to a high of 5.79 log10copies/ml.
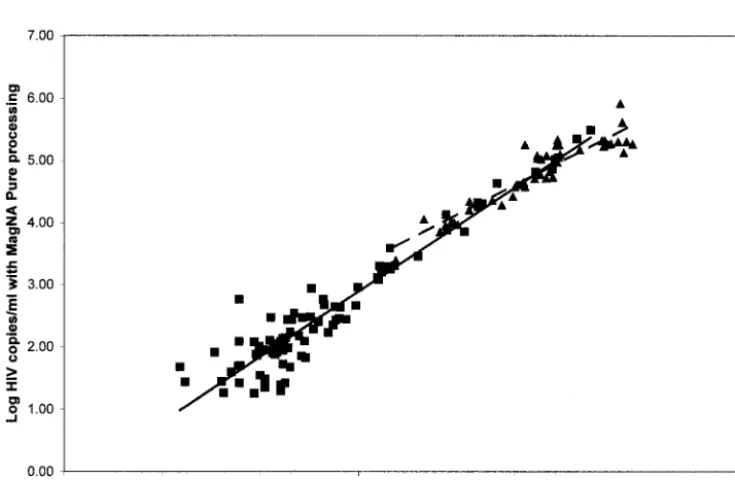
The correlation of the viral load values obtained with spec-imens processed in parallel by the different protocols is shown in Fig. 2. The correlation was higher between values obtained with specimens processed by the manual and the MPLC pro-tocols when the ultrasensitive (R2, 0.91) rather than the
stan-dard manual (R2, 0.86) protocol was used. In addition, the
response of the AMPLICOR MONITOR test appeared to plateau for specimens processed by the MPLC protocol, with viral load values being⬎5 log10.
The agreement between viral load values for the samples processed by different methods was measured by determining the differences in log10viral loads for each sample (i.e., the
loads obtained by the manual protocol minus the loads ob-tained by the MPLC protocol) and calculating the mean and standard deviation of the differences. The values were in good agreement, with a mean log10difference of 0.09 and a standard
[image:2.603.42.284.91.189.2]deviation of 0.291. The 95% confidence interval (⫾2 standard
TABLE 1. Essential parameters for the sample preparation protocols used for AMPLICOR HIV-1 MONITOR Test
Parameter Standardmanual method Ultrasensitive manual method MPLC system
Plasma vol (l) 200 500 200
Ultracentrifugation No Yes No
QSa: lysis buffer (vol:vol) 0.011 0.0028 0.0057
Working lysis buffer vol (l) 600 600 300 Diluent or eluant volume (l) 400 100 65 Vol added to PCR mixture (l) 50 50 50
Sample vol factor 40 4 6.4
[image:2.603.301.542.586.715.2]aQS, quantitation standard.
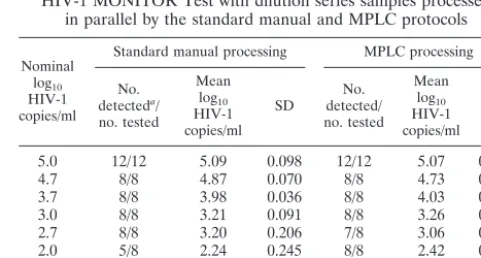
TABLE 2. Sensitivity and intra-assay variation of AMPLICOR HIV-1 MONITOR Test with dilution series samples processed
in parallel by the standard manual and MPLC protocols
Nominal log10 HIV-1 copies/ml
Standard manual processing MPLC processing
No. detecteda/ no. tested
Mean log10 HIV-1 copies/ml
SD detected/No. no. tested Mean log10 HIV-1 copies/ml SD
5.0 12/12 5.09 0.098 12/12 5.07 0.129
4.7 8/8 4.87 0.070 8/8 4.73 0.076
3.7 8/8 3.98 0.036 8/8 4.03 0.175
3.0 8/8 3.21 0.091 8/8 3.26 0.150
2.7 8/8 3.20 0.206 7/8 3.06 0.151
2.0 5/8 2.24 0.245 8/8 2.42 0.096
1.7 4/8 2.29 0.126 8/8 2.09 0.282
1.0 1/8 2.16 5/8 1.70 0.374
aNumber of replicates in which the HIV-1 RNA OD
450was⬎0.2.
VOL. 41, 2003 AUTOMATED SAMPLE PROCESSING FOR HIV RNA 2063
on May 15, 2020 by guest
http://jcm.asm.org/
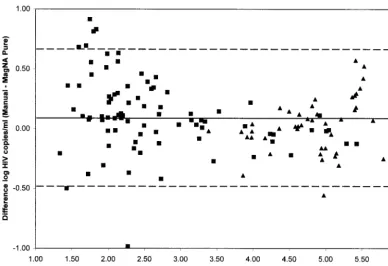
deviations) for the mean difference was⫺0.5 and 0.65 log10. A
plot of the difference versus the average log10viral load for
each sample is shown in Fig. 3. As expected, the differences were larger at the extremes of the dynamic range of the assay,
but the differences did not vary in a systematic way over the range of measurements.
[image:3.603.97.491.70.333.2]On the basis of the data presented above, the dynamic range of the assay with samples processed by the MPLC protocol was
FIG. 1. Plot of measured against expected log10number of HIV-1 copies per milliliter for specimens processed by the MPLC protocol. Each point represents the mean for eight replicates. The equation for the linear regression line wasy⫽0.86x⫹0.73 (R2, 0.996).
FIG. 2. Correlation of viral load results for all clinical specimens processed in parallel by the MPLC and the manual protocols.■, ultrasensitive manual method;Œ, standard manual method; solid line, trend line for values determined by the ultrasensitive manual and MPLC protocols (R2, 0.913); dashed line, trend line for values determined by the standard manual and MPLC protocols (R2, 0.863).
on May 15, 2020 by guest
http://jcm.asm.org/
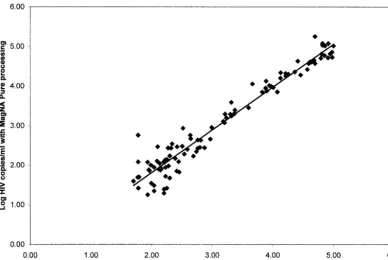
[image:3.603.109.477.454.694.2]similar to that for samples processed by the ultrasensitive man-ual protocol (1.7 to 5 log10). We reassessed the correlation
and agreement of the viral load values for the 102 samples described above that had values between 1.7 and 5 log10
copies/ml when they were processed by the standard or the ultrasensitive manual protocol. The correlation coefficient in-creased to 0.95 when only values in this range were considered (Fig. 4). However, the agreement was essentially the same as described for the larger data set, with a mean log10difference
of 0.09 (standard deviation, 0.292).
An additional 35 specimens with viral loads between 5 and 5.87 log10 copies/ml were diluted 10-fold in normal human
plasma and processed by the MPLC protocol. These same specimens were also processed, undiluted, by the standard manual protocol. The viral load results were compared after correction for the additional dilution factor for the specimens processed by the MPLC protocol. The results were in good agreement, with a mean log10difference of⫺0.09 (standard
deviation, 0.365).
The viral load results for two positive controls processed in parallel by the MPLC and ultrasensitive manual protocols are shown in Table 3. The data were pooled from four MPLC runs using two different lots of total nucleic acid kits. The NAC-HIV-1 positive control had a target concentration of 2 log10
copies/ml. The mean viral load value was 2.37 with automated sample processing and 2.22 with manual sample processing (P⫽0.08). There was a trend to increased variance (standard deviation squared) with automated sample processing (P ⫽
0.06).
Both the mean viral load value and the variance were higher for the AMPLICOR kit high-positive control processed by the
MPLC protocol (P⫽0.005 andP⫽0.04, respectively). How-ever, only 1 (9%) of the 11 replicates processed by the MPLC protocol and none of the replicates processed manually were outside of the target range (4.04 to 4.99 log10copies/ml) given
by the manufacturer. The kit high-positive control must be diluted in water rather than normal human plasma in the MPLC protocol to avoid degradation of the RNA transcript by RNases present in normal human plasma. Both the NAC-HIV-1 plasma sample and the AMPLICOR high-positive con-trol, as described here, appear to be suitable controls for assay by the MPLC sample preparation protocol. However, our data indicate that the small RNA transcript in the high-positive control is not recovered as consistently by the MPLC protocol as it is by the manual method.
DISCUSSION
Although significant progress has been made in automating the amplification and detection steps of nucleic acid amplifi-cation tests, sample preparation is still performed manually in many laboratories. Nucleic acid isolation is technically de-manding and labor-intensive. The response of the diagnostic industry to the growing needs of clinical laboratories for truly integrated systems for sample preparation, amplification, and product detection has been slow.
[image:4.603.97.486.68.333.2]The COBAS AMPLIPREP instrument (Roche Molecular Systems, Pleasanton, Calif.), which was designed to automate sample preparation for COBAS AMPLICOR tests, has been in development for several years but is still not widely available in the United States. In a recent evaluation, this instrument was found to be a suitable replacement for the manual method
FIG. 3. Difference in log10number of HIV-1 copies per milliliter against average log10number of HIV-1 copies per milliliter for specimens processed manually and by the MPLC protocol. Solid line, mean difference (0.086 log10); dashed lines,⫾2 standard deviations (0.568 log10);■, ultrasensitive manual method;Œ, standard manual method.
VOL. 41, 2003 AUTOMATED SAMPLE PROCESSING FOR HIV RNA 2065
on May 15, 2020 by guest
http://jcm.asm.org/
used for sample preparation with the COBAS AMPLICOR HCV MONITOR test (7). However, its expense, lack of ver-satility, and large footprint may limit its use to all but a few laboratories performing large numbers of COBAS AMPLI-COR tests.
The MPLC system is an open platform that allows the user to define protocols for a variety of different applications and formats. We previously developed and verified MPLC sam-ple preparation protocols for the AMPLICOR HCV test, the AMPLICOR CMV MONITOR test, and a variety of PCR tests developed in-house (3). In this study, we describe the development and verification of a sample preparation protocol for use with the AMPLICOR HIV-1 MONITOR test. To our knowledge, this is the first report of an automated sample preparation protocol for this test.
We found that the AMPLICOR HIV-1 MONITOR test with the automated extraction protocol had a sensitivity and a dynamic range similar to those of the ultrasensitive test. In addition, we demonstrated that, on average, the viral load results for samples processed by the MPLC protocol had viral load values approximately 0.09 log10lower than those for
sam-ples processed manually. The limits of agreement, defined as the 95% confidence interval around the mean log10difference,
for samples processed by the different methods were shown to be⫾0.58 log10copies/ml. Since changes in viral load of⬍0.5
log10are generally not biologically significant (6), the MPLC
protocol could replace the manual sample preparation proto-cols without the need to reestablish a patient’s baseline HIV-1 load by the new method. Similar limits of agreement, ⫾0.5 log10, were found between hepatitis C virus (HCV) load results
determined for specimens processed manually and with the COBAS AMPLIPREP instrument (7).
Automated processing of samples did not improve the pre-cision of the viral load values in our study. In fact, there appeared to be a trend to greater imprecision with the MPLC sample preparation protocol. However, the average standard deviation reported here, 0.15 log10, is well within the range of
values reported by others for AMPLICOR MONITOR tests. All of the sample processing was done by one medical tech-nologist who was selected for participation in this study, in part, because of her skill in performing the manual sample processing associated with the AMPLICOR MONITOR test. The manual sample processing is technically demanding, and in practice, there is considerable variation among operators in the recovery of RNA by these methods. The operator-to-op-erator variation should be less with an automated protocol but was not assessed in our study.
The MPLC protocol has several advantages over the
ultra-TABLE 3. HIV-1 load results for positive controls processed in parallel by the MPLC and ultrasensitive manual protocols
Control Processing protocol(vol) replicatesNo. of Mean
log10 HIV-1 copies/ml
SD
NAC-HIV-1a MPLC (200l) 11 2.37 0.267
Ultrasensitive manual
(500l) 8 2.22 0.147
AMPLICOR kit
(high) MPLC (12.5H2O) l/200l of
11 4.61 0.178
Ultrasensitive manual
(12.5l/500l of NHPb) 11 4.42 0.098 aAcrometrix.
[image:5.603.100.489.71.331.2]bNHP, normal human plasma.
FIG. 4. Correlation of viral load results for clinical specimens with viral load values between 1.7 and 5 log10copies/ml processed in parallel by the MPLC and the manual protocols. The equation for the linear regression line wasy⫽1.082x⫹0.354 (R2, 0.945).
on May 15, 2020 by guest
http://jcm.asm.org/
[image:5.603.302.542.594.708.2]sensitive manual protocol. The ultrasensitive manual protocol increases the sensitivity of the AMPLICOR MONITOR test by concentrating virus from 500 l of plasma by high-speed centrifugation. The MPLC protocol achieves the same sensi-tivity with only 200l of plasma and no need for centrifugation to concentrate the virus. It also resulted in significant labor savings. An MPLC run of 32 specimens requires only about 15 min of hands-on time, whereas the manual method requires almost 2 h. It also offers the opportunity to unify the sample preparation protocols used for the assay. At present, labora-tories use different manual sample preparation protocols for low- and high-titer specimens. The high-titer specimens (⬎5 log10copies/ml) can simply be diluted 1:10 in normal human
plasma prior to processing on the MPLC instrument. Automated sample processing adds additional costs to the AMPLICOR MONITOR test. The unit list cost for the re-agents and disposables associated with the MPLC protocol is $3.77/sample, and the list cost of the instrument is approxi-mately $85,000. The labor savings for the AMPLICOR HCV MONITOR test offset the modest incremental cost of the reagents. The ability to use the instrument for sample prepa-ration for a variety of nucleic acid-based tests with different assay formats helps justify the substantial capital investment. Although the throughput of 32 samples in 1.5 h is a good fit for our laboratory, it may be a limitation for those laboratories with larger batch sizes. It is a compact, bench-top instrument measuring 40 in. wide, 26 in. deep, and 35 in. high and weigh-ing 332 lbs. The software interface with the MPLC system is simple and uses graphical representations to guide the user through the setup and run of a batch.
In conclusion, the MPLC sample preparation protocol can replace both the standard and the ultrasensitive manual pro-tocols described for the AMPLICOR HIV-1 MONITOR test without compromising the performance characteristics of the test. The automated protocol described here saved substantial
labor costs, simplified the nucleic acid extraction, and proved reliable in a clinical laboratory setting.
ACKNOWLEDGMENTS
This work was supported by a grant from Roche Applied Sciences. We thank Elizabeth Lytle, Sharon Sheridan, and Matthias Hinz-peter (Roche Applied Sciences) for technical and logistical support.
ADDENDUM IN PROOF
While the manuscript was in press, Ho¨lzl et al. reported the development and evaluation of a MagNA Pure LC protocol for use with the ultrasensitive COBAS AMPLICOR HIV-1 MON-ITOR test (G. Ho¨lzl, M. Sto¨cher, V. Leb, H. Stekel, and Jo¨rg Berg, J. Clin. Microbiol.41:1248–1251, 2003).
REFERENCES
1.Bland, J. M., and D. G. Altman. 1986. Statistical methods for assessing agreement between two methods of clinical measurement. Lanceti:307–310. 2.Espy, M. J., P. N. Rys, A. D. Wold, J. R. Uhl, L. M. Sloan, G. D. Jenkins, D. M. Ilstrup, F. R. Cockerill III, R. Patel, J. E. Rosenblatt, and T. F. Smith.2001. Detection of herpes simplex virus DNA in genital and dermal specimens by LightCycler PCR after extraction using the IsoQuick, MagNA Pure, and BioRobot 9604 methods. J. Clin. Microbiol.39:2233–2236.
3.Fiebelkorn, K. R., B. G. Lee, C. E. Hill, A. M. Caliendo, and F. S. Nolte.2002. Clinical evaluation of an automated nucleic acid isolation system. Clin. Chem. 48:1613–1615.
4.Kessler, H. H., G. Muhlbauer, E. Stelzl, E. Daghofer, B. I. Santner, and E. Marth.2001. Fully automated nucleic acid extraction: MagNA Pure LC. Clin. Chem.47:1124–1126.
5.Loeffler, J., K. Schmidt, H. Hebart, U. Schumacher, and H. Einsele.2002. Automated extraction of genomic DNA from medically important yeast spe-cies and filamentous fungi by using the MagNA Pure LC system. J. Clin. Microbiol.40:2240–2243.
6.Saag, M. S., M. Holodniy, D. R. Kuritzkes, W. A. O’Brien, R. Coombs, M. E. Poscher, D. M. Jacobsen, G. M. Shaw, D. D. Richman, and P. A. Volberding. 1996. HIV viral load markers in clinical practice. Nat. Med.2:625–629. 7.Stelzl, E., A. Kormann-Klement, J. Haas, E. Daghofer, B. I. Santner, E.
Marth, and H. H. Kessler.2002. Evaluation of an automated sample prepa-ration protocol for quantitative detection of hepatitis C virus RNA. J. Clin. Microbiol.40:1447–1450.
VOL. 41, 2003 AUTOMATED SAMPLE PROCESSING FOR HIV RNA 2067