Published by Science and Education Publishing DOI:10.12691/ajmo-8-1-1
Threshold Effect of State Budget Spending on
Economic Growth: the Case of Vietnam
Nguyen Thu Thuy1,*, Ta Van Thang2
1
Fundamental Faculty, Academy of Finance, Hanoi, Vietnam
2
Institute of Economics and Finance, Academy of Finance, Hanoi, Vietnam *Corresponding author: [email protected]
Received April 19, 2020; Revised May 21, 2020; Accepted May 28, 2020
Abstract
To the best of our knowledge, a very few studies have focused on the threshold effect of budget spending on economic growth in developing and developed countries. The purpose of this paper is to study the threshold effect of budget spending on economic growth in the Vietnam. Using a threshold analysis in the period over 1986-2018. The data were collected from Department of Statistics of Vietnam. Our results demonstrate that the optimal ratio of State budget expenditure to Vietnam's GDP is 24.67%. If this threshold is exceeded, the increase of the percentage ratio of State budget expenditure/GDP will have a negative impact on the speed of GDP growth.Keywords: state budget spending, economic growth, threshold effect
Cite This Article:
Nguyen Thu Thuy, and Ta Van Thang, “Threshold Effect of State Budget Spending on Economic Growth: the Case of Vietnam.” American Journal of Modeling and Optimization, vol. 8, no. 1 (2020): 1-6. doi: 10.12691/ajmo-8-1-1.1. Introduction
When we consider the economy as a whole made up of two parts, those are the state and the private sector. The private sector has now become the main sector for the production of material goods, while the state sector has played the role of providing public goods and services to ensure the smooth functioning of the private sector's economic activities effectively. When the scale of state budget spending is too small, the state does not have enough resources to spend on the task of providing public services, the economy thus operates less efficiently than it should, so economic growth also reached a low level. At this time, increasing the scale of budget spending will help the state have more conditions to build, consolidate and improve public services, making economic activities more efficient and leading to higher growth rates. However, if the scale of state budget spending is too large while the level of management is not high, the cash flow for public projects becomes less effective. At the same time, the funding for this budget is derived from the resources to produce private wealth through private revenue, which makes the economy inefficient. This is followed by a decrease in economic growth rate. At this time, increasing the scale of budget spending clearly makes the economic growth rate decrease.
The above analysis shows that, the scale of state budget expenditure exceeds a certain level, the economic growth rate slows down. There is a level of budget spending at which economic resources are most effectively allocated between public and private use. At this level, the economy will grow at the fastest sustained pace. Without exceeding
this threshold, the size of budget spending and economic growth fluctuate in the same direction. Conversely, once the threshold is exceeded, the size of budget spending and economic growth will fluctuate in the opposite direction. Stemming from the goal of determining a reasonable scale of budget spending scale for Vietnam today, the authors have chosen the goal of determining a reasonable budget spending scale for the goal of economic growth in Vietnam.
The structure of the study is as follows. Section 2 discussed the literature review. Section 3 described the data, the research model, and methodology of this study. The empirical analysis is presented in section 4. Section 5 covers the conclusion.
2. Literature Review
government spending and the level of output in the economy, but their estimation methods often faced many mistakes. The Keynesian theory ignores the fact that the government cannot pump purchasing power into the economy before reducing it through taxes and debt. As a result, Keynesian theory faced major challenges when the world economy fell into recession in the 1970s, and when there was an economic boom due to tax cuts combined with tightening spending in the 1980s.
By this time, a wave of opposition to Keynesian views had risen, and many economists believed that cutting the budget deficit was a miraculous remedy for economic growth. They argue that cutting government spending and thus cutting the budget deficit will reduce interest rates, increase investment, increase productivity and ultimately promote growth. This argument is grounded if the relationship between the above variables is close. However, there are many reasons to believe that the above hypothesis about the relationship between budget deficit, interest rate, investment and economic growth has been overemphasized. Specifically, the actual data of many countries in the world have shown that the budget deficit has a very small impact on interest rates, especially for open economies. The interest rate is determined on the international capital market where trillions of dollars are traded each day. Even a big change in the government's budget balance is unlikely to have a significant impact on interest rates. In addition, the main factor determining interest rates must be credit demand, which is why interest rates are often high during periods of strong growth. During these periods, credit demand is often high, and to earn profits financial institutions often impose high interest rates on loans to compensate for risks and inflation. In addition, when the other factors are the same, taxable loans often have a higher interest rate than non-taxable loans. This implies that the tax increase, while reducing the budget deficit, is more likely to raise interest rates and thus is unlikely to stimulate investment and economic growth. In line with these arguments, many empirical studies have been conducted and show that government spending cannot promote growth even with a negative impact on growth such as [6] and [7].
Hence, different theories use different arguments and therefore they do not give a clear answer on the relationship between government spending and economic growth. So, economic theory often does not explicitly indicate the impact of government spending on economic growth. However, most economists agree that there are certain cases where a reduction in government spending will promote economic growth, and there are also cases where an increase in government spending is beneficial for growth. Therefore, more sophisticated studies were conducted, the theory of public spending threshold was first developed by [9]. His model reflects a more comprehensive relationship between the size of public expenditure and economic growth and it is widely used by economists in the world when studying the role of public spending. The Rahn curve implies that economic growth will be maximized when government spending is moderate and distributed to basic public goods such as infrastructure, property protection and law enforcement. However, public spending will be harmful to economic growth when it exceeds this limit, called the public
spending threshold. The public spending threshold is the point where any increase in public spending below this value will have an impact on economic growth, while a larger increase will have a negative effect on economic growth. After that, [2,3,11] and [12] gave similar results.
However, so far, the role of public spending on economic growth remains a controversial topic. There have been a number of large-scale review works done to point out the consistency and differences through studies, and to explain those findings. The author in [8] have compiled 93 articles discussing the impact of fiscal policy on economic growth. Among these, 41 articles provide empirical evidence on the impact of the total size of public expenditure, with 29 percentage supporting the view that government expansion will curb growth, 17 percentage say that the opposite is true and more than half of the studies are inconclusive. The inconsistency in the results stems from some studies focusing on rich nations, while others focus on poor countries or put them all together. For studies that focus on a group of countries that share some characteristics, the findings appear to be more consistent. This is because the nature of public spending in each economy has its own characteristics, governed by certain characteristics (for example, level of development, political regime, institution, position or geography).
Most recently, [5] synthesized 87 empirical studies on the impact of the scale of public expenditure on economic growth. Using the general regression analysis method, the authors showed that the results found in the previous studies depended on the choice of variables, regression methods and national research group. Specifically, the negative effect was often found in developed country group studies, where the explanatory variable was the ratio of public expenditure to GDP and the dependent variable was the average GDP. When researching a developing country group, the estimation results were not statistically significant. And when all countries were included, the relationship was not statistically significant in the case of the explanatory variable as total government expenditure, but it was negative and significant in the case of the total expenditure variable for Government consumption was used. Here, total government expenditure was government expenditures that did not improve productivity.
Many other studies show the existence of thresholds of public expenditure scale such as [10] which showed that there was an Armey curve for Nigeria and the estimated optimal rate was found to be 19.81% of GDP when estimated for GDP per capita and optimal about 13% of GDP when estimates for real GDP; or [1] with their own research have shown that if public spending exceeds 30% of GDP, it will reduce economic growth and have no impact on the quality of life. It can be said that the above-mentioned studies provide a fairly clear picture of the research situation on the topic of relationship between public expenditure scale and economic growth.
3. Data and Methodology
3.1. Data
sample dataset during the period of time from 1986 to 2018 on a yearly basis, the data is analyzed using Stata 15 software. In this study, the data consist of two variables, those are ratio of state budget expenditure to GDP and GDP growth.
Table 1. Measurement of Variables Used in the Study
Dependent Variables Abbreviation Source
GDP growth, % GDP_growth DOS
Independent Variables Ratio of state budget
expenditure to GDP (%) GS
Calculated from data of DOS Ratio of non-state investment
to GDP (%) INV
Calculated from data of DOS Interact variable (product of
state budget expenditure growth and GS)
GOV Calculated from
data of DOS
Threshold Variable Ratio of state budget
expenditure to GDP (%) GS
Calculated from data of DOS
3.2. Research Model
This study focuses on analyzing the threshold of optimal state budget expenditure for economic growth, which is the percentage of total state budget expenditure to obtain Vietnam's optimal GDP, the point at which growth increases. The economy has the highest value and if the percentage of total state budget expenditure over GDP surpasses it, it will be inversely related to the GDP growth rate of Vietnam, thereby determining the total level of state budget expenditure to ensure fast and sustainable growth.
World studies on the threshold of state budget spending on economic growth have also been conducted in a number of countries and by a number of different methods. [13] showed that there existed a nonlinear relationship between government size and economic growth for ASEAN countries. The research model of this topic is also based on the two-region theoretical model of [4] and [9] and was extended by [14]. Then, the estimation of threshold models, with the same independent variable as the economic growth rate with different independent combination of variables, and using SSR, AIC, BIC model selection criteria and HQIC to make a choice of the most appropriate model, corresponding to the most appropriate model which will be the most appropriate threshold of the ratio of state budget expenditure to GDP. In addition, with the independent variables included in the regression model, there are lag variables of the independent variables and threshold variables, rather than fixing a fixed form of function. This has not yet done in [13]. That is, the implementation method has improvements compared to [13]. We will build a series of models as follows to study the effect of budget spending on GDP growth.
1 2 3 4
1 2 3 4
_
if
if t
t t t t t
t t t t t
GDP growth
GS GOV INV GS
GS GOV INV GS
α α α α ε γ
β β β β η γ
+ + + + ≤
= + + + + >
(3.1)
Where:
GDP_growth is real GDP growth (dependent variable); GSt is an explanatory variable and a threshold variable representing state budget expenditure, calculated as the
ratio of state budget expenditure to GDP (compared to 2010 price). This is also the threshold variable.
GOVt = Gt * GSt, Gt is the growth of state budget expenditure, GSt is the above threshold variable.
INVt is an independent variable, representing the ratio of non-state investment to total GDP.
1, 1
α β are the estimated coefficients on each domain.
2, 2
α β are regression coefficients describing the effect of state budget expenditure on real GDP growth rate in each region.
3, 3
α β are regression coefficients that describe the effect of GOVt on real GDP growth rates across each region.
4, 4
α β are the regression coefficients that describe the effect of INVt on real GDP growth rates across each region.
, t t
ε η is the estimated error of the model, which is independent, identically distributed, with a 0 expectation and a constant variance.
t is the year index, showing the differences between the years studied.
4. Results of Economic Modeling
4.1. Descriptive Statistics
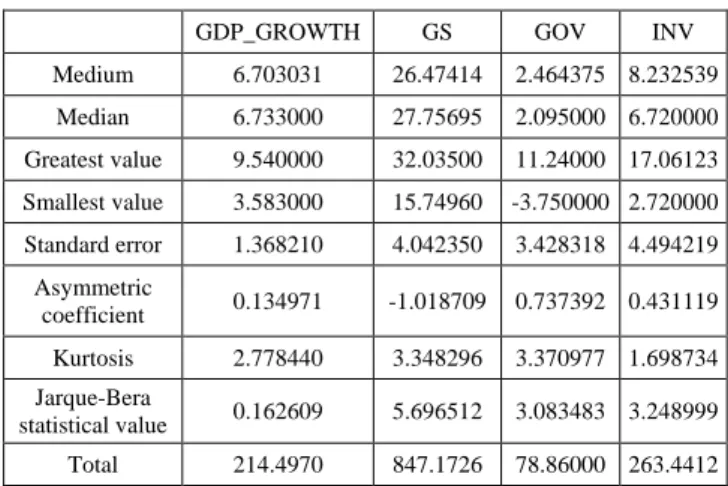
Statistical description of the variables studied in the period from 1986 to 2018 is shown in Table 2 below.
Table 2. Statistical description of variables
GDP_GROWTH GS GOV INV
Medium 6.703031 26.47414 2.464375 8.232539
Median 6.733000 27.75695 2.095000 6.720000
Greatest value 9.540000 32.03500 11.24000 17.06123
Smallest value 3.583000 15.74960 -3.750000 2.720000
Standard error 1.368210 4.042350 3.428318 4.494219
Asymmetric
coefficient 0.134971 -1.018709 0.737392 0.431119
Kurtosis 2.778440 3.348296 3.370977 1.698734
Jarque-Bera
statistical value 0.162609 5.696512 3.083483 3.248999
Total 214.4970 847.1726 78.86000 263.4412
Table 2 shows that the average real growth rate was 6.7%, with the highest rate of 9.54% in 1995, the lowest at 3.58% in 1987. The average budget expenditure in the research period 26.47%, with the highest budget expenditure being 32.03%; in 2007, the highest budget expenditure was 15.75% in 1991.
For visualization, we can look at the graphs of GDP_GROWTH, GS, GOV and INV as in Figure 1.
4.2. Estimation Models
Figure 1. Graph of variables
Table 3. Regression results with a GDP_GROWTH threshold according to GS, GOV and INV
Full sample: 1987 - 2018 Number of thresholds = 1 Thresholds variable: GS Order Thresholds SSR
1 24.6715 17.2018
Number of obs = 32 AIC = -3.8630 BIC = 7.8629 HQIC = 0.0238
GDP
growth Coef. std. Err. z P>|z| [95% Conf. Interval] Regionl
GS -.051463 .1128366 -0.46 0.648 -.2726186 .1696927 GOV .2383586 .076678 3.11 0.002 .0880724 .3886448 INV .5612958 .2926878 1.92 0.055 -.0123618 1.134953 _cons 4.222087 2.496425 1.69 0.091 -.6708161 9.114991 Region2
GS -.2303622 .145811 -1.58 0.114 -.5161465 .055422 GOV .0776394 .0768614 1.01 0.312 -.0730061 .228285 INV -.13984 .0621398 -2.25 0.024 -.2616318 -.0180482 _cons 14.76905 3.644097 4.05 0.000 7.626747 21.91135
The estimated threshold of state budget expenditure is 24.67% of the sample divided into 2 regions. Domain 1 corresponds to parts of the sample where state budget spending is less than or equal to 24.67%. Region 2 corresponds to parts of the sample where state budget expenditure is greater than 24.67%.
However, in Table 3 the estimated coefficients found for the GS threshold variable are negative and are not statistically significant at the 5% significance level. This leads us to estimate a new threshold model whose dependent variable is GDP_GROWTH according to two independent variables GS, GOV, with the threshold variable GS, to verify whether there is a GS threshold for the GDP_GROWTH variable. The results are as in Table 4.
Table 4. Regression results with a GDP_GROWTH threshold according to GS, GOV
Full sample: 1986 - 2017 Number of thresholds = 1 Thresholds variable: GS
Number of obs = 32 AIC = 10.5442 BIC = 19.3386 HQIC = 13.4593 Order
1
Thresholds 24.6715
SSR 30.576 GDP
growth Coef. std. Err. z P>|z| [95% Conf. Interval]
Regionl
GS .3304346 .1301183 2.54 0.011 .0754074 .5854619
GOV .0026499 .0008824 3.00 0.003 .0009204 .0043794
_cons -2.052336 2.846273 -0.72 0.471 -7.630928 3.526257
Region2
GS -.4601409 .1334405 -3.45 0.001 -.7216795 -.1986022
GOV -.0019617 .0011459 -1.71 0.087 -.0042077 .0002842
_cons 20.51926 3.897692 5.26 0.000 12.87992 28.15859
The estimated threshold of state budget expenditure in this model is still 24.67% dividing the research sample into 2 regions. Domain 1 corresponds to parts of the sample where state budget spending is less than or equal to 24.67%. Region 2 corresponds to parts of the sample where state budget expenditure is greater than 24.67%.
effect is reflected in the regression coefficient of 0.0026. In domain 2, that is, at the level of state budget expenditure above 24.67%, state budget expenditure has the opposite effect on economic growth, reflected in the regression coefficient of the state budget expenditure variable is -0.4601, statistically significant at the 5% significance level. GOV in this case also has a negative impact on economic growth, shown in the regression coefficient of -0.0020 with statistical significance at 10%.
The results of this model confirm the inverse U-shaped relationship between economic growth and the scale of budget expenditure in Vietnam during 1986-2018, the optimal threshold of budget spending on economic growth in the period. The review period is 24.67%. However, not all spending or investment can generate revenue at that time, their effectiveness may be delayed by a few lags.
After a series of models with changes in threshold variables and independent variables with additional lags, the best threshold regression model was chosen to determine the optimal threshold of budget spending on economic growth. is a model with dependent variable GDP_GROWTH and two independent variables GS, GOV and GS are threshold variables, as shown in Table 4 aboves.
Before using this threshold model for analysis, we need to perform a test of whether the received threshold is statistically significant. Testing is done by Bootstrap presented in the following Table 5.
Table 5. The result of testing the threshold effect by Bootstrap method
Threshold effect test (bootstrap = 1000):
Threshold RSS MSE Fstat Prob. Crit10 Crit5 Crit1
Single 83.00 2.59 15.64 0.000 9.985 9.985 9.985
Table 5 presents the test statistic according to the probability of the Bootstrap method of threshold values of state budget expenditure to total GDP. With a 5% significance level of the statistical value, Bootstrap results support the threshold effect. Mean threshold value
( )
γ have values consistent with the actual value(
γ =0 24, 67% .)
From this, we can use this model toanalyze the threshold impact of state budget expenditure on economic growth:
_
2.052336 0.3304346 0.0026499
if 24.67%
20.51926 0.4601409 0.0019617
if 24.67%
t
t t t
t
t t t
t GDP growth GS GOV GS GS GOV GS ε η − + + + ≤ = − − + > (4.1)
5. Conclusion
The model results clearly illustrate the expected nonlinear relationship between economic growth and the scale of budget expenditure in Vietnam during 1986-2018. It is expected that, below the threshold, state budget
spending has the same directional effect on economic growth, and above the threshold, state budget spending has the opposite effect on economic growth. And the optimal threshold of budget expenditure for economic growth in the period considered is 24.67%. The optimal threshold of budget spending in relation to economic growth is interpreted as the point where any increase in budget spending below this value will have a positive effect, while a larger amount will have a negative effect on economic growth.
The estimated threshold of 24.67% divides the sample into 2 regions. Domain 1 corresponds to parts of the sample where state budget spending is less than or equal to 24.67%. Region 2 corresponds to parts of the sample where state budget expenditure is greater than 24.67%. GOV in this case also has a negative impact on economic growth, shown in the regression coefficient of -0.0020 with statistical significance at 10%. This indicates that when the GOV increases by 1%, the real GDP growth rate decreases by 0.0020%. The ratio of total state budget expenditure to Vietnam's optimal GDP is 24.67%, if this threshold is exceeded, the increase of the percentage of total state budget expenditure/GDP will have a negative impact on the speed of GDP growth. Thus, the model results show that the ratio of total optimal state budget expenditure on GDP in Vietnam in the period of 1986-2018 is 24.67%.
References
[1] Afonso, A., Schuknecht, L. & Tanzi, V. “Public Sector Efficiency: An International Comparison”, Public Choice, 123 (3-4), 321-347. 2005.
[2] Armey, D. and Armey R., The Freedom Revolution: The New Republican House Majority Leaders Tells why Big Governments failed, Why Freedom works, and How we will rebuild America, Wasgington D.C.; Regnery Publishing Inc. 1995.
[3] Barro, Robert J. (1990) “Government Spending in a Simple Model of Endogenous Growth”, Journal of Political Economy 98, S (5): 103-125.
[4] Chen, S. T. & Lee, C. C., “Government size and economic growth in Taiwan: A threshold regression approach”, Journal of Policy Modeling, 27(9). 1051-1066. 2005.
[5] Churchill, S. A., Yew, S. L. & Ugur, M. Effects of Government Education and Health Expenditures on Economic Growth: A Meta-Analysis, Greenwich Political Economy Research Center, Greenwich University, Greenwich. 2015.
[6] Kormendi, R. C. & Meguire, P. G., “Macroeconomic determinants of growth: Cross-country evidence”, Journal of Monetary Economics, Elsevier, 16(2), 141-163, Sep.1985.
[7] Landau, D. “Government expenditure and economic growth: a cross-country study”, Southern Economic Journal. Jan.1983. [8] Nijkamp, P. & Poot, J. “Meta-analysis of the effect of fiscal
policies on long-run growth”, European Journal of Political Economy, 20, 91-124. 2004.
[9] Rahn, “Government Size and Economic Growth: a New
Framework and Some/Evidence from Cross-Section and Time-Series Data”, The American Economic Review, Mar.1986. [10] Santos, A. R. “Does Optimal Government Size Exist for
Developing Economies? The Case of Nigeria”, AAU Annals of Accounting, Educational & Social Research, 1(1): 15-33, Jun.2014. [11] Scully, G., “What is the optimal Size of government in the US?”,
National Center for Policy Analysis, Policy Report No. 188. 1994. [12] Scully, G., “The Growth-Maximizing Tax-rate”, Pacific Economic
Review, 5(1), 2000.
[14] Odawara, R. “A threshold approach to measuring the impact of government size on economic growth”, The George Washington
University. 2010. Retrieved 10 May 2014 from
http://www.thebrokenwindow.net/papers/J/JobPaper_Odawara.pdf.