Research Article
a
September
2017
Computer Science and Software Engineering
ISSN: 2277-128X (Volume-7, Issue-9)
Characterization of Ischemic Stroke in CT Images using
Image Processing
Amal Alzain*, Suhaib Alameen, Rani Elmaki, Mohamed E. M. Gar-Elnabi College of Medical Radiological Science, Sudan University of Science and Technology,
Khartoum, Sudan
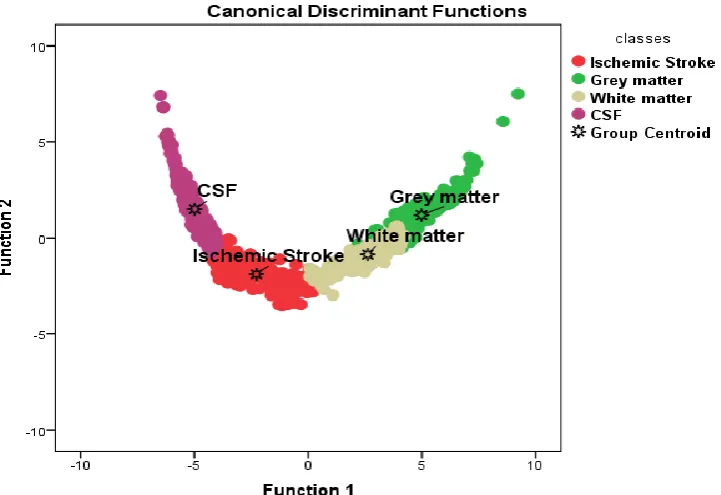
Abstract: This study concern to characterize the brain tissues to ischemic stroke, gray matter, white matter and CSF using texture analysisto extract classification features from CT images. The First Order Statistic techniques included sevenfeatures. To find the gray level variation in CT images it complements the FOS features extracted from CT images withgray level in pixels and estimate the variation of thesubpatterns. analyzing the image with Interactive Data Language IDL software to measure the grey level of images. The results show that the Gray Level variation and features give classification accuracy of ischemic stroke 97.6%, gray matter95.2%, white matter 97.3% and the CSF classification accuracy 98.0%. The overall classification accuracy of brain tissues 97.0%.
These relationships are stored in a Texture Dictionary that can be later used to automatically annotate new CT images with the appropriate brain tissues names.
Keywords: ischemic stroke, gray matter, white matter, CSF, image processing, FOS
I. INTRODUCTION
Stroke is the most common cause of death in most industrialized countries. There are two types of "brain attacks" known as ischemic and hemorrhagic attacks. Hemorrhagic stroke occurs when a blood vessel in the brain breaks or ruptures spilling blood into the brain. Hemorrhagic strokes account for about 15% percent of all strokes, yet are responsible for more than 30% percent of all stroke deaths [1]. Ischemic strokes represent more than 80% of all cases and are characterized by the occlusion of a blood vessel due to a thrombus or embolus [2,3]. In the case of stroke, however, blood clots are dangerous because they can block arteries and cut off blood flow to the brain, a process called ischemia [4]. The time for intervention can be as narrow as 3 hours.
Brain imaging provides an objective basis for the clinical inferences that direct individual patient
management in the acute stroke setting. A brain CT or MRI scan is required for all patients with suspectedstroke or transient ischemic attack. Thrombolytic therapy is arguably the most important aspect ofacute stroke management; however, most decisions in acute stroke do not relate to this treatment. Strokeimaging must, therefore, provide information beyond the presence or absence of intracranial hemorrhage(ICH) and early evidence of a large infarct. Non-contrast CT and gradient-recalled echo MRI show comparableaccuracy in the diagnosis of acute ICH. Diffusion-weighted MRI is more sensitive than non-contrast CT fordifferentiation of acute ischemic stroke from non-stroke conditions. Combined multimodal parenchymal,perfusion and vascular imaging with CT or MRI has the potential to identify patients with an ischemicpenumbra that might be appropriate for acute reperfusion therapies.
CT scanning procedures are more prevalent in various medical centers and less expensive compared with magnetic resonance imaging. CT scan technology plays a key role by helping to discovery stroke in human brain. Therefore, developments have to be carried out facilitate diagnosis of stroke.
CT non-contrast CT: CT is considered to be the gold standard for excluding ICH in the acute setting, although
this role for CT has never been validated with neuropathological studies. Acute extravascular blood appears as hyper dense regions on the CT scan because of the high protein content of the hematoma [5]. The accuracy with which a clinician can detect parenchymal hematoma on CT varies with experience, and ranges from 73% to 87% [6]. CT is also a useful tool in the diagnosis of subarachnoid hemorrhage (sAH). The sensitivity of CT for detection of blood in the subarachnoid space is ˜90% in the first 24 h following sAH onset, but decreases with time [7]. For this reason, a negative CT scan requires follow-up with a lumbar puncture if sAH is strongly suspected[8]. In addition, suspicion of sAH is a contraindication for thrombolysis, even if the CT scan is negative [9].
ISSN(E): 2277-128X, ISSN(P): 2277-6451, pp. 18-23 The information obtained by combining various imaging techniques may help differentiating patients who do not need intravenous or intra-arterial therapy from those who do, and may alter clinical outcomes [10].
CT can detect the effects of ischemia on brain tissue. Ischemia is a functional state of abnormal blood flow that initially leads to neuronal and endo thelial cytotoxic edema and, subsequently, to ionic edema [11]. This increase in the water content of the brain causes X-ray attenuation, and is seen as a hypo density on CT, most commonly in the arterial watershed territories—namely, the insular cortex, the lentiform nucleus, and the gray–white matter junction. [12-15].
The cause of the stroke must beascertained, along with the nature of the vessel pathology,the pattern and extent of the damage, and the acute inter-vention that is indicated.
Image processing techniques can help to differentiate the abnormal tissue growth (tumors) in question from other tissues, providing more detailed information on head injuries, stroke, brain disease and internal structures than do regular X-ray CT scans by using suitable programs such as IDL software.
II. MATERIAL AND METHODS
The study consisted of 100 patients with ischemic stroke; CT brain examination was performed with multi detector helical CT system to carry out the required images and the data as intensities in gray level variation ofischemic zone.
First-OrderStatisticalTextureAnalysis:
First-order texture analysis measuresuse theimagehistogram, or pixeloccurrenceprobability, to calculate texture. Themainadvantageofthisapproachisitssimplicitythroughtheuseofstandard escriptors (e.g.meanandvariance) to characterize the data. However, thepowerof the approach for discriminatingbetween uniquetextures islimited in certain applications because themethoddoesnotconsider thespatialrelationship, and correlation, betweenpixels. For any
surface,orimage,grey-levelsareintherange0≤i≤Ng-1, where Ngisthe total number of distinct
grey-levels.IfN(i)isthenumberofpixelswithintensityiandMisthetotalnumberofpixelsin an image, it follows that the histogram, or pixel occurrenceprobability, isgiven by,
Ingeneral, seven features commonly use dtodescribethepropertiesoftheimagehistogram, and
thereforeimagetexture, arecomputed. Theseare:mean; variance;coarseness;skewness;kurtosis; energy; andentropy.These textural features include First order statistics; (coefficient of variation, stander deviation, variance, signal, energy, and entropy). images were classified the data concerning the brain tissues (ischemic stroke, gray matter, white matter and CSF)and data entered to SPSS to generate a classification score using stepwise linear discriminate analysis; to select the most discriminate features that can be used in the classification ofbrain tissues in CT images.
III. RESULTS
ISSN(E): 2277-128X, ISSN(P): 2277-6451, pp. 18-23 Table 1: Showed the classification accuracy of the brain tissues using linear discriminant analysis:
Classes
Predicted Group Membership Total
Ischemic
Stroke Grey matter White matter CSF
%
Ischemic Stroke 97.6 0.0 .9 1.5 100.0
Grey matter 0.0 95.2 4.8 0.0 100.0
White matter .3 2.4 97.3 0.0 100.0
CSF 2.0 0.0 0.0 98.0 100.0
97.0% of original grouped cases correctly classified.
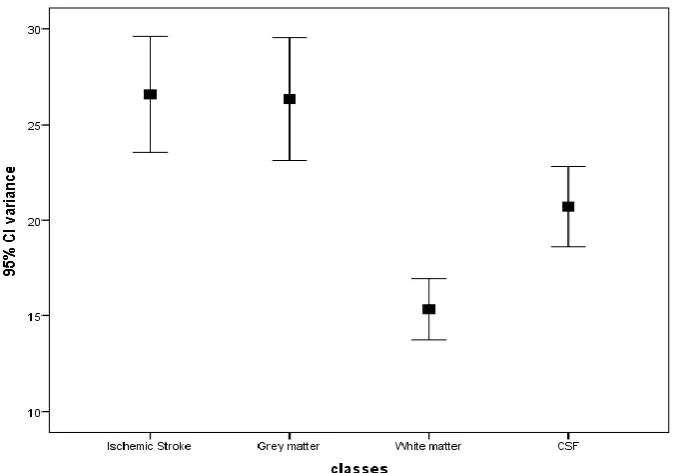
Fig 2. Simple errorbargraph demonstratesthe classification ofbrain tissue(grayand white matter, CSF and brain Ischemic stroke)usingmean feature.
ISSN(E): 2277-128X, ISSN(P): 2277-6451, pp. 18-23
Fig 4. Simple errorbargraph demonstratesthe classification ofbrain tissue(grayand white matter, CSF and brain ischemic stroke)usingCl energy
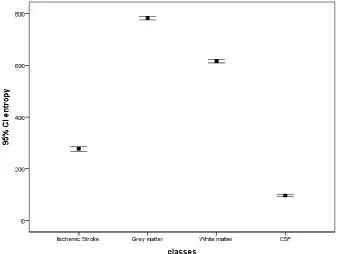
Fig 5. Simple errorbargraph demonstratesthe classification ofbrain tissue(grayand white matter, CSF and brain ischemic stroke)usingCl entropy
IV. DISCUSSION
The classification showed that the ischemic stroke was classified well from the rest of the tissues although it has characteristics mostly similar to surrounding tissue.
ISSN(E): 2277-128X, ISSN(P): 2277-6451, pp. 18-23 discriminate function as a discriminate feature where it discriminates between all features. Fig .4 show error bar plot for the CI energy textural features that selected by the linear stepwise discriminate function as a discriminate feature where it discriminates between all features. Fig 5. show error bar plot for the CI entropy textural features that selected by the linear stepwise discriminate function to discriminates between all features. From the discriminate power point of view in respect to the applied features the entropy can differentiate between all the classes successfully.
V. CONCLUSION
The classification ischemic stroke of CT brain was defining the ischemic stroke, gray matter, white matter and CSF, and carried out using Interactive Data Language (IDL) program as platform for the generated codes. The result of the classification showed that the ischemic stroke was classified well from the rest of the brain tissues although it has characteristics mostly similar to surrounding tissue.
Several texture features are introduced and the classification score matrix generated by linear discriminate analysis and the overall classification accuracy of brain tissues 97.0%, and the classification accuracy of ischemic stroke 97.6%, gray matter 95.2%, white matter 97.3% While the CSF showed a classification accuracy 98.0%.
Using Linear discrimination analysis generated a classification function which can be used to classify other image into the mention classes as using the following multi regression equation;
Ischemic Stroke = (mean × 12.179) + (variance × -0.04) + (energy × -.054) + (entropy × -1.585) -76.543
Grey matter = (mean × 9.042) + (variance × .010) + (energy × -.019) + (entropy × - 1.054) -105.383
White matter = (mean × 11.189) + (variance × -.019) + (energy × -.28) + (entropy × -1.379) -1oo.352
CSF = (mean × 8.386) + (variance × -.001) + (energy × -.010) + (entropy × -1.110) -36.959
REFERENCES
[1] National Stroke Association’s, 2013. Complete Guide to Stroke.
[2] Candelario-Jalil E: Injury and repair mechanisms in ischemic stroke:considerations for the development of novel
neurotherapeutics.CurrOpinInvestig Drugs 2009, 10:644-654.
[3] Durukan A, Tatlisumak T: Acute ischemic stroke: overview of major experimental rodent models,
pathophysiology, and therapy of focal cerebral ischemia. PharmacolBiochemBehav 2007, 87:179-197.
[4] Stam J (April 2005). "Thrombosis of the cerebral veins andsinuses". The New England Journal of Medicine
352(17)
[5] Kucinski, T., Koch, C. &Zeumer, H. In Imaging inStroke (ed. Hennerici, M. G.) 19–42 (RemedicaPublishing, London, 2003).
[6] Schriger, D. L., Kalafut, M., Starkman, S.,Krueger, M. & Saver, J. L. Cranial computedtomography interpretation in acute stroke:physician accuracy in determining eligibility forthrombolytic therapy. JAMA 279, 1293–1297(1998).
[7] Sames, T. A., Storrow, A. B., Finkelstein, J. A. &Magoon, M. R. Sensitivity of new-generationcomputed tomography in subarachnoidhemorrhage. Acad. Emerg. Med. 3, 16–20(1996).
[8] Bederson, J. B. et al. Guidelines for themanagement of aneurysmal subarachnoidhemorrhage: a statement for healthcareprofessionals from a special writing group of theStroke Council, American Heart Association.Stroke 40, 994–1025 (2009).
[9] Adams, H. P. Jr et al. Guidelines for the earlymanagement of adults with ischemic stroke:a guideline from the American HeartAssociation/American Stroke Association StrokeCouncil, Clinical Cardiology Council,Cardiovascular Radiology and InterventionCouncil, and the Atherosclerotic Peripheralvascular Disease and Quality of Care Outcomesin Research Interdisciplinary Working Groups: the American Academy of Neurology affirms the value of this guideline as an educational tool forneurologists. Stroke 38, 1655–1711 (2007).
[10] Ashok Srinivasan, MD. MayankGoyal, MD. Faisal Al Azri, MD., CheemunLum, MD.RadioGraphics 2006;
26:S75–S95. Published online 10.1148/rg.26si065501. State-of-the-Art Imaging of Acute Stroke
ISSN(E): 2277-128X, ISSN(P): 2277-6451, pp. 18-23
[12] Ledezma, C. J. &Wintermark, M.Multimodal CT in stroke imaging: new concepts.Radiol. Clin. North Am. 47,
109–116 (2009).
[13] Tomura, N. et al. Early CT finding in cerebralinfarction: obscuration of the lentiform nucleus.Radiology 168, 463–467 (1988).
[14] Truwit, C. L., Barkovich, A. J., Gean-Marton, A.,Hibri, N. & Norman, D. Loss of the insular ribbon:another early CT sign of acute middle cerebralartery infarction. Radiology 176, 801–806(1990).