http://www.ijorl.com pISSN 2454-5929 | eISSN 2454-5937
Original Research Article
Dyadic wavelet analysis and detection of sinusitis using
near infrared sensor
S. Kamatchi
1*, M. Sundararajan
2INTRODUCTION
Sinusitis is a condition which occurs due to inflammation of the paranasal sinus cavities and the associated nasal cavities which prolongs from 4 weeks in an acute case to more than 12 weeks in a chronic case.1 Majority of the people gets affected by upper respiratory and associated diseases such as sinusitis. Thick green nasal discharge,
thick nasal mucosa, purulent smell, nasal congestion, facial discomfort, headache, fever, cough, dental pain and ear pain were identified as the predominant symptoms of sinusitis.2 Many times the diseased fail to get diagnosed properly at an earlier stage as the symptoms were commonly shared by rhinitis and other upper respiratory diseases as discussed by Jarvis.3 Earlier diagnosis of the disease carried out clinically and under or over treatment ABSTRACT
Background: Sinusitis is a chronic infection or inflammation which affects the paranasal sinus cavities and the associated nasal cavities. As the symptoms of sinusitis greatly resemble upper respiratory infections, diagnosing sinusitis clinically is a major issue. Though imaging techniques serves as a standard in confirming the diagnosis of chronic sinusitis, the availability at the primary care settings, affordability and diagnosing acute cases calls upon an alternative technique in practice. Recent researches confirming the diagnosis of sinusitis using Near-infrared imaging gives us hope in taking up the research using optical sensing. The objective of the study was to successfully diagnose sinusitis using NIR-LED optical sensor and to signal process the data obtained from the patients using Dyadic Wavelet Transform (DyWT) to confirm and to validate diagnosis using regression analysis. The study also correlates the plain radiographic findings with the NIR device sensing to make the device feasible.
Methods: This was a one year pilot study (June 2014–May 2015) conducted with forty patients suspected of sinusitis and with clinical history along with ten healthy individuals as controls.
Results: Patients age ranged from 18-65 years were included in the study. Results from NIR sensing device well correlate with the radiographic examination of the registered candidates. The regression result perfectly matches with the dyadic wavelet results of the patients, confirming the diagnosing of sinusitis using near- infrared sensor. Radiographic examination well correlates with the results from the NIR diagnostic device providing a valuable evidence of the hardware.
Conclusions: NIR-LED sensor device can provide qualitative evidence in differentiating the mild and severe patients based on air-fluid level present in the sinus. The results strongly recommend that NIR sensing device can be a best alternative in case of frequently sinus affected patients and for the unaffordable patients without the risk of radiation.
Keywords: Sinusitis, Dyadic wavelet transform, Near infrared sensor, Regression analysis, Plain radiography, NIR-LED sensor, NIR sensing
1
Sathyabama University, Shollinganallur, Chennai, India
2
Bharath Institute of Higher Education and Technology, Agaram Road, Selaiyur, Chennai, India
Received: 11 December 2017
Revised: 07 February 2018
Accepted: 08 February 2018
*Correspondence:
Dr. S. Kamatchi,
E-mail: [email protected]
Copyright: © the author(s), publisher and licensee Medip Academy. This is an open-access article distributed under the terms of the Creative Commons Attribution Non-Commercial License, which permits unrestricted non-commercial use, distribution, and reproduction in any medium, provided the original work is properly cited.
routines followed. Antibiotics prescribed unnecessarily may provide adverse effects in the long run.4,5
Although imaging techniques serves as a standard in confirming the diagnosis of chronic sinusitis, the unavailability at the clinical settings, unaffordability and diagnosing even acute cases at an earlier stage without going through ionizing procedures with limited spatial and temporal resolution calls upon an alternative technique in practice. Computed tomography (gold standard) as well as the plain radiography used presently in confirming the diagnosis of the disease pertains to more false diagnosis with varying sensitivity and specificity accompanied with risks of radiation doses.6,7,8 Optical sensing through Near-infrared (NIR) sensor is an emerging technique in biomedical field. Recent literature review reveal that there exist very few works in diagnosing sinusitis with NIR optical imaging technique without undergoing the normal imaging routines but still in need of expensive, high resolution cameras.9-11 Diagnostic optical devices and sensors developed from LED-based optical technique finds quite a vast field of applications in recent years which makes us focus towards NIR-LED sensor in diagnosing sinusitis and to validate with the help of wavelet analysis along with radiographic results.12-15
This paper focuses on signal analysis and discrimination of sinusitis affected patients from healthy individuals with the help of Dyadic Wavelet transform. Dyadic Wavelet transform (DyWT) pioneered by Mallat and Zhong proves to be a powerful tool in signal analysis and processing.16 This transform overcomes the problem of using orthogonal and bi-orthogonal wavelet transform by exhibiting translation invariant characteristics. It also exhibits an excellent multi-resolution signal analysis property. DyWT perform decomposition at each scale and the shift invariant property and adaptive resolution analysis makes it a suitable technique for biomedical signal representation. Sun proposed lifting construction algorithm with vanishing moments for spline dyadic wavelets.17 Recently parvathi et al further presents acoustic signal analysis for torque prediction of a three phase induction motor using dyadic wavelet transform.18
The objective of the paper was to successfully diagnose sinusitis using NIR-LED optical sensor and to signal process the data obtained from the patients using Dyadic Wavelet Transform (DyWT) to confirm and to validate diagnosis using regression analysis. Radiographic examination carried out to find the feasibility of the diagnostic device developed.
METHODS
Study design
This retrospective study was carried out for a year (2014 – 2015) with fifty registered patients to undertake this study after getting individual consent from the patients in
Sathyabama dental hospital under the supervision of a medical practitioner. Suspected patients with clinical history of sinusitis and under medication were included along with some newly diagnosed patients.
Inclusion criteria
Inclusion criteria were adults from 18 years of age to 65 years both male and female; patients who had not undergone any prior surgical treatment before undertaking this study; patients with two or more symptoms of sinusitis described earlier, with clinical history and suspected of having the disease at an incidence along with healthy controls.
Exclusion criteria
Exclusion criteria were patients; who have undergone sino-nasal surgery or with a history of surgical treatment at any hospitals in prior to the study; with suspected dental aetiology resulting in maxillary sinus inflammation; with anatomical abnormalities, tumor; acute asthma; pregnant women, children and those who are not willing to undergo radiological examination.
Procedure
The patients volunteered to take up this study were individually diagnosed on the basis of inclusion and exclusion criteria, clinical history with symptoms were assessed and a physical examination of ENT routines were carried out to make a clear diagnosis based on signs and symptoms of the disease.19
Figure 1: Signal recording from a patient with a headband using Sigview software.
help of hardware is further processed using signal processing tool to evaluate the findings from the hardware and compared with the radiographic results. Recording of signal sample were available in the link provided https://www.youtube.com/watch?v=pIItyK1Hp 0A&feature=youtu.be. NIR sensor records the signal from the patients and it is stored in the database with the help of sigview software as shown in Figure 1. Patients were asked to undertake radiographic examination immediately followed by NIR sensing.
Signals recorded from the patients using hardware compared with radiographic images and results obtained using the signal processing tool to diagnose sinusitis. Recorded signals were analyzed using Dyadic wavelet transform in Matlab. Dyadic wavelet transform shows five levels of reconstructed signal output and the level 2 decomposition is considered for analysis.
Similarly, the signals recorded are also analyzed with the help of regression analysis to validate the output obtained using hardware.
Signal acquisition from prototype hardware
Signals were recorded from the patients with the help of NIR-LED optical sensor enabled prototype hardware. OD-850WHT developed by Opto Diode Corporation is a NIR-LED optical sensor, operated at a wavelength of 850nm with a source and a detector properly shielded. Data recorded from the patients for a period of 20 second. The sensor detects the reflected signal from the frontal and the maxillary sinus cavity and further processed to monitor the fluid level present inside individual sinus cavity. The captured signal is interfaced to the system and plotted using serial chart as shown in Figure 2 and Sigview software. Signals recorded from the patients under study were analyzed using serial chart to detect the moisture level inside each of the sinus cavity.
Figure 2: Serial chart and LCD output of signal recorded from a patient.
Radiography
The radiography was performed by occipito-mental or Water’s view projection by a trained radiologist followed
by signal recording through hardware. Positive radiographic examination considered as abnormality condition of paranasal sinus cavity (PNS) if mucosal thickening showed >4 mm or complete opacification of one or more sinuses exists or based on air-fluid level. If mucosal thickening is less than 4mm or if there is no opacification, then it is considered as a normal sinus.
Dyadic wavelet analysis with implementation
Dyadic Wavelet transform samples the input signal and the output signal with the same sampling period presenting translation invariance property. Dyadic Wavelet Transform (DyWT) is shift-invariant and does not require downsampling. The number of wavelet coefficients never reduces between the scales as DWT and even undecimated. The DyWT decomposes the original signal into detail and approximate coefficient. The Detail and approximate coefficients expand high and the low-frequency signals to acquire respective peaks. Dyadic computation can be performed by dilating the mother wavelet with a power of two. Similarly, the dyadic discrete wavelet transform of a signal a (n) can be computed convolving any mother wavelet with its dyadic dilated function given by the function,
{AQa(n), {WQa(n)}qε[1,Q]}nεZ - 8
Where AQa(n) = a*ϕQ(n) represents the approximation or
DC component.
In general, Wavelet transforms can be designed with different reconstruction and decomposition filters. Dyadic wavelet transform uses a pair of Wavelet function, ψ(t) and reconstruction function, χ(t) for decomposition and reconstruction respectively.
In a Multi-resolution analysis, scaling and wavelet function is a function of V0 and V-1. Wavelet function,
Ψ(t) can be represented as a function of scaling function, ϕ(t) and wavelet filter, g= {gm} given below as,
Ψ(t) = ∑ √ ( ) -9
Dyadic Wavelet bases expand L2 function with reconstruction condition. Dual scaling function and dual wavelet function are required to derive reconstruction condition. Dual scale function can be represented as ( ) and ( ) for the wavelet function;
( ) ∑ √ [ ] -10
( ) ∑ √ ( ) -11
( ) ∑ √ ( ) -12
Corresponding Fourier transforms can be given as,
( )
√ ( | ) ( | ) -13
( )
√ ( ) ( )
-14
( )
√ ( ) ( ) -15 ( )
( ) ( ) -16
( ) ( ) ( ) -17 ( ) ( ) ( ) -18
If the following condition is satisfied with dyadic wavelet
filters, h,
and g, .
ω ε [- ] ( ) ( ) ( ) ( ) -19 Then the above equation is Dyadic perfect reconstruction condition.
Reconstructed f ε L2
(R) for a dyadic wavelet transform can be given as,
( ) ∑
√ ( ( ) ) ( )
-20
Single dimension signal Dyadic decomposition equation is given as,
Approximation component, aj+1[n] = ∑ [ ] [
], j= 0,1,…. -21
Detail component, dj+1[n] = ∑ [ ] [ ],
j=0,1,…. -22
The reconstructed signal equation is
aj[n] = ∑ ( [ ] ( ) [ ] [ ])
-23
Dyadic Decomposition
Wavelet decomposition is carried out at five levels using Haar wavelet and the dyadic decomposition at level 2 is taken for analysis with approximate and detail components.
Normal subjects show a constant output even with a change in gender and age. In diseased cases, output varies
with gender, age and severity of the disease. Change in magnitude and frequency is witnessed in diseased cases. In the chronic stage, unpredictable variations exist with both magnitude and frequency. The Chronic person shows an output with magnitude less or higher than the normal but with very high frequency. Extreme variations are witnessed for a diseased case.
Dyadic output of a normal person shows no variation as there is no turbid medium inside the sinus cavity in a fully aerated condition. However, in case of acute or chronic condition the output obtained varies due to fluid filled condition and turbid medium inside the sinus cavity undergoes reflection, refraction, scattering and absorption. Due to all these phenomena, there will be a change in the magnitude with the moving layers of the turbid medium. Sometimes, the signal is fully absorbed or scattered due to which the output will be very less.
Similarly, the signals recorded were also analyzed with the help of regression analysis to validate the output obtained using hardware.
Regression analysis
Signals recorded were analyzed using regression analysis. Regression evaluated for all the observations made with the patients and volunteers under study. Signals analyzed for different stages of the patient with regression analysis in Matlab. Regression analysis is the method of fitting straight lines to the data patterns. Regressing one variable with respect to the other by minimizing errors achieves perfect fit of data patterns. Perfect fit occurs when the data pattern exactly coincides with the target line, Y=T, where T refers to the target matrix or array of data with a total number of data and Y refers to the output matrix or data array of the same size as that of the target matrix.
Normal
When the data pattern exactly fit into the normal distribution curve, then it is a normal case. Irrespective of the gender and age, regression value computed to be 90% or above. Let us consider normal signals for regression analysis.
Acute case
Chronic case
If the prediction line is tilted horizontally with respect to the target line to regress output variable on another group of variables, then the regression is classified as diseased case. In addition, the regression value is negative for an acute case. Therefore, if the regression is a positive value with less than 20%, then it comes under chronic case. If all the cavities are blocked and in extreme chronic stage, then the regression output will be less than 20% with more clustered data unable to map in to the prediction line and for values above 20%, any one of the cavity such as maxillary or frontal sinus cavity is in chronic. The flowchart to illustrate various steps involved in performing regression is shown in Figure 2.
The signals from chronic and acute condition produce multiple data or clustered data away from the target line. In regression analysis, the output curve doesn’t fit in to the prediction line. So for fitting in a linear equation, horizontal line regressing away from the target line is considered. For non-linear data, the output fit can’t be
made in a single line representing clusters due to multiple scattering inside the turbid medium of the sinus cavity. But for normal person, perfect fit occurs with the target line showing no reflection or scattering due to the air medium.
Signals recorded from the patients were recorded and later analyzed using Matlab statistics and machine learning tool box. Statistical parameters were evaluated with statistical analysis. The correlation between the radiographic findings and the data recorded from the patients and the correlation between dyadic wavelet analysis and regression analysis were significant.
RESULTS
Fifty patients at various stages of sinusitis were registered for the study with 32 males and 18 females, ages ranged from 18 to 65 years. Among the registered candidates, positive radiography of maxillary or frontal sinuses corresponds to a sensitivity of 82% and specificity of 81.8% from the prototype hardware.
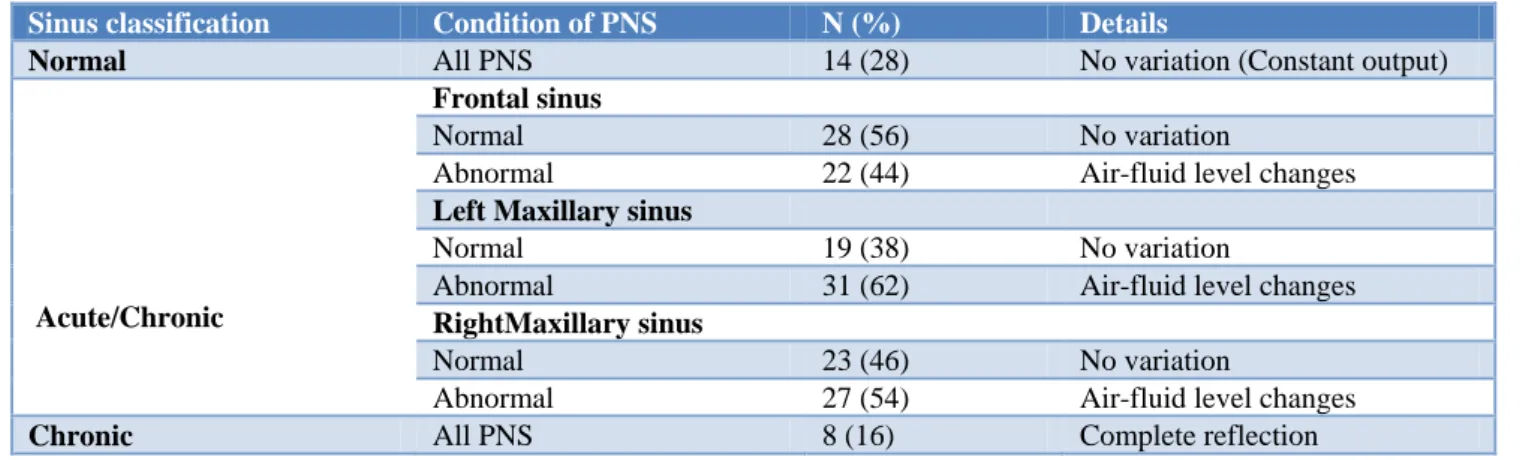
Table 1: Observation of PNS condition from serial chart (n=50).
Sinus classification Condition of PNS N (%) Details
Normal All PNS 14 (28) No variation (Constant output)
Acute/Chronic
Frontal sinus
Normal 28 (56) No variation
Abnormal 22 (44) Air-fluid level changes
Left Maxillary sinus
Normal 19 (38) No variation
Abnormal 31 (62) Air-fluid level changes
RightMaxillary sinus
Normal 23 (46) No variation
Abnormal 27 (54) Air-fluid level changes
Chronic All PNS 8 (16) Complete reflection
Table 2: Distribution of plain radiograph findings within the PNS (n=50).
Radiological findings N (%) Characteristics of abnormal pns:
N (%)
Normal 19 (38) Nil
Frontal sinus
Normal 33 (66) Nil
Abnormal 17 (34) Partial opacification : 12
Complete opacification: 5
Left Maxillary Sinus
Normal 22 (44) Nil
Abnormal 28 (56)
Air-fluid level: 7 Partial opacification: 15 Complete opacification: 6
Right Maxillary sinus
Normal 21 (42) Nil
Abnormal 29 (58)
Table 3: Interpretation from Dyadic wavelet analysis, n=50.
Condition of PNS N (%) Observations
Normal 14 (28)
Magnitude- High (constant), Frequency – Normal (Low) No variation with gender or age
Acute (mild) 24 (48)
Magnitude- Less than normal (constant), Frequency – High
Variation exists with age, gender and severity
Chronic(severe) 12 (24)
Magnitude- Extreme variations, Frequency – Very high
Variation exists with age, gender and severity
Table 4: Regression analysis of PNS condition, n=50.
PNS status N (%) Regression (%)
Normal 14 (28) R>90
Acute 20 (40) R is negative
Chronic (All PNS) 16 (32) R<20
Based on serial chart output analyses 14 candidates had clear cavity, 8 patients had severe opacification in almost all the PNS and the remaining 28 patients had partial or complete opacification in either frontal sinus or left/right maxillary sinus.
Figure 3: Flowchart of the regression analysis.
Nasal congestion or obstruction (n= 45, 90%), post nasal drainage (n=43, 86%) and facial pressure (n=30, 60%) were the predominant symptoms identified among the patients under study. Fatigue was the least common symptom at 10% (n=5). The most commonly affected pns was maxillary sinus on plain radiography. Complete opacification of the sinus was seen in 14 (28%),
Interpretations observed from the Dyadic wavelet analysis were 28% of the registered candidates seem to be normal, 48% had an acute condition and 24% suffers from chronic condition in all the paranasal sinuses as shown in Table 3.
Based on the regression analysis of paranasal condition observed; 28% were identified as normal, 40% had an acute condition, and 32% suffers from extreme chronic condition with both frontal and maxillary sinuses infected and it is shown in Table 4.
Figure 4: Scatter plot of serial chart findings from the prototype hardware and the radiographic findings.
Scatter plot of serial chart findings from the prototype hardware and the radiographic findings is shown in Figure 4.
Normal person shows a significant positive regression analysis (R= 0.9 -1) and positive correlation, acute cases shows a negative regression and the severe or chronic condition shows less than 20% regression value (R varies from 0.01 to 0.3).
0 5 10 15 20 25 30 35
0 10 20 30 40
Finding
s
from
seria
l chart
throug
h
pro
toty
pe
DISCUSSION
This research study indicates that the Optical NIR-LED sensing of Frontal and Maxillary sinus may be very useful for diagnosis of Frontal and Maxillary sinusitis. When compared with the existing imaging techniques such as Computed tomography and Plain radiography; NIR sensors differentiate normal, acute and chronic sinus disease with variation in air-fluid level, partial or complete opacification.21,22
Near infrared sensing technique have numerous benefits. NIR sensing device can be used as a bedside monitoring device or at the clinical settings to readily diagnose the existence and severity of the device and to reduce the adverse effects of prescribing antibiotics in an inappropriate manner. Furthermore, NIR sensing technique can be performed without the risk of ionization and in a most affordable manner by the entire population. However, imaging modalities though serves as a gold standard should still be used along with clinical history and symptoms to diagnose the existence of the disease.
23-25
But, NIR sensing device can be used to clearly differentiate the fluid level inside sinus cavity thereby quite useful in diagnosing frequently at the clinical settings in case of frequent incidence of sinus related symptoms in a radiation free manner.
Serial chart clearly depicts the condition of sinus cavities and the changes in the air-fluid level inside the cavity. Prototype developed along with serial chart can serve as a diagnostic tool to differentiate healthy individuals from mild (acute) and severe (chronic) cases of sinusitis. Radiographic examination of the patients well correlates with the results obtained through the hardware. Moreover, the sensitivity is very good when compared to radiographic examination. Dyadic wavelet analysis of sinusitis and normal person well correlates with the results of regression analysis.
NIR sensing hardware along with dyadic wavelet analysis and regression analysis provides an alternative method of confirming the disease in a non-ionizing and cost effective way. The current study identifies that the maxillary sinus was the most inflammatory sinus than frontal sinus.
Very few publications exist on NIR imaging of sinusitis. Sensitivity and specificity exceeds 70% in many trials. You compared NIR image intensity of sinusitis with the anatomical structures of CT and found a good correlation between them.10 The study can well differentiate air-filled and tissue-filled spaces through signal penetration patterns but offers poor spatial sensitivity in imaging all sinus cavities other than maxillary sinus. Another study did not show much improvement in the statistical assessment parameters such as sensitivity and specificity with symptoms alone and with NIR imaging but provides 20% improvement in sensitivity for differential analysis from symptom alone to NIR images.11 The optical
sensitivity has to be optimized for better results to avoid light escaping from cheeks to improve sensitivity. NIR imaging faces image quality related problem similar to the existing techniques which can be benefitted in case of NIR sensing.
The study with limited cases and in a tertiary environment provides valuable proof in diagnosing at the clinical settings. In order to improve the statistical assessment parameters and effectiveness of sinusitis management with even more population, further investigation can include the patients with clinical history and frequently referring to the primary care alone for the study. Our future work aims at improving the design of sensor operating at various wavelengths to study the performance and efficiency of the device in diagnosing the disease and in differentiating the various abnormalities of sinuses. To identify optimum wavelength of improving accuracy and specificity to reduce false negative outcomes in sinusitis diagnosis. Although, the current performance demonstrated by the developed prototype should be further improved, the outcome can be considered as a successful feasible study of a NIR-LED based sensor for sinusitis detection.
CONCLUSION
Our research work reveals that sinusitis detection can be carried out using Near Infrared Sensor. NIR-LED sensor device can provide qualitative evidence in differentiating the mild and severe patients based on air-fluid level present in the sinus. Serial chart, dyadic wavelet analysis and regression analysis best validate the diagnosis. Radiograph examination well correlates with the NIR sensor results confirming the device to be a diagnostic tool for sinusitis at the primary care settings. However, various abnormalities cannot be differentiated as with the existing imaging techniques, this device can serve as a best alternative in case of frequently sinus affected patients and for the unaffordable patients without the radiation risk.
ACKNOWLEDGMENTS
The authors wish to thank the management of Sathyabama University for rendering their support towards the work in facilitating testing on patients and data collection in Sathyabama Dental hospital and our sincere thanks go to the patients who participated in this study.
Funding: No funding sources Conflict of interest: None declared Ethical approval: Not required REFERENCES
2. Fokkens W, Lund V, Mullol J. European position paper on Rhinosinusitis and Nasal polyps. Rhinology. 2007;45(20):1-139.
3. Jarvis D, Newson R, Lotvall J, Hastan D, Tomassen P, Keil T, et al. P: Asthma in adults and its association with chronic rhinosinusitis: the GA2LEN survey in Europe. Allergy. 2012;67(1):91–8.
4. Gulliford MC, Dregan A, Moore MV, Ashworth M, van Staa T, McCann G, et al. Continued high rates of antibiotic prescribing to adults with respiratory tract infection: survey of 568 UK general practices. BMJ Open. 2014;4(10):1-5.
5. Bell BG, Schellevis F, Stobberingh E, Goossens H, Pringle M. A systematic review and meta-analysis of the effects of antibiotic consumption on antibiotic resistance. BMC Infect Dis. 2014;14:13.
6. Aalᴓkken TM, Hagtvedt T, Dalen I. Conventional sinus radiography compared with CT in the diagnosis of acute sinusitis. Dentomaxillofac Radiol. 2003;32:60-2.
7. Gujrathi PT, Wakode. Haziness in X-Ray Paranasal Sinus Water’s view in Sinusitis: A Fact or Fiction. Indian J Otolaryngol Head Neck Surg. 2013;65(2):S242-6.
8. Chandrasekhar Y, Shaw LJ, Narula J. Diagnostic Imaging, radiation exposure and carcinogenic risk. JACC: Cardiovascular imaging. 2015;8(8):885-7. 9. Mahmood U, Cerussi A, Dehdari R, Nguyen Q,
Kelley T, Tromberg B, et al. Near Infrared Imaging of the sinuses: Preliminary evaluation of a new technology for diagnosing maxillary sinusitis. J Biomed Opt. 2010;15(3):0360111-5.
10. You SJ, Niguel L, Cerussi A, Santa R. et al. Near- Infrared Imaging for Diagnosis of sinusitis. Pub. No.US 2014/0221843A1. 2014.
11. You SJ, Cerussi EA, Kim JH, Ison S, Wong B, Cui H, et al. Near-Infrared imaging for management of chronic maxillary sinusitis. 9314. Proc. SPIE 9314, Optics and Biophotonics in Low-Resource Settings. 2015: 93140D.
12. Galyanin V, Melenteva A, Bogomolov A. Selecting optimal wavelength intervals for an optical sensor: A casestudy of milk fat and total protein analysis in the region 400–1100 nm. Sens. Actuators B Chem. 2015;218:97–104.
13. Mansfield CD, Attas EM, Gall RM. Evaluation of static thermal and near- infrared hyperspectral imaging for the diagnosis of acute maxillary rhinosinusitis. J Otolaryngol. 2005;34:99-108. 14. Bogomolov A, Ageev V, Zabarylo U, Usenov I,
Schulte F, Kirsanov D, et al. LED-based near infrared sensor for cancer diagnostics. Proc SPIE. 2016:9715.
15. Bogomolov A, Zabarylo U, Kirsanov D, Belikova V, Ageev V, Usenov I, et al. Development and Testing of an LED-Based Near-Infrared Sensor for Human Kidney Tumor Diagnostics. Sensors. 2017;17:1914.
16. Mallat S, Zhong S. Characterization of signals from multiscale edges. IEEE Trans. Pattern Anal Mach Intell.1992;14:710-32.
17. Sun YK. Lifting construction of spline dyadic wavelet filters with any number of vanishing moments. Int. J. Wavelets Multiresolution. Information Processing. 2009;7:693-710.
18. Sangeetha P, Hemamalini S. Dyadic wavelet transform-based acoustic signal analysis for torque prediction of a three-phase induction motor. IET signal processing. 2017;1(5):604-12.
19. Eli O. Meltzer, Daniel L. Hamilos. Rhinosinusitis Diagnosis and Management for the Clinician: A Synopsis of Recent Consensus Guidelines. Mayo Clin Proc. 2011;86(5):427-43.
20. Kamatchi S, Sundararajan M. Earlier diagnose of sinusitis in Frontal and Maxillary cavities using NIR radiations. J Computational Theroetical NanoscI. 2017;14:1-4.
21. Bhattacharyya T, Piccirillo J, Wippold FJ. Relationship between patient- based descriptions of sinusitis and paranasal sinus computed tomographic findings. Arch Otolaryngol Head Neck Surg. 1997;123:1189-92.
22. Konen E, Faibel M, Kleinbaum Y, Wolf M, Lusky A, Hoffman C, et al. The value of the occipitomental (Waters') view in diagnosis of sinusitis: a Comparative study with computed tomography. Clin Radiol. 2000;55:856-60.
23. Kolo ES, Ezeanolue BC. Chronic rhinosinusitis in kano: A correlational study of the symptomatology and plain radiographic findings. Nigerian J Otorhinolaryngol. 2010;7:19.
24. Kenny TJ, Duncavage J, Bracikowski J, Yildirim A, Murray JJ, Tanner SB. Prospective analysis of sinus symptoms and correlation with paranasal computed tomography scan. Otolaryngol Head Neck Surg. 2001;125:40-3.
25. Al-Azzawi AA, Al-Umeri KK. Comparison of clinical symptoms, plain radiographs, coronal CT and Antral Lavage in patients with chronic maxillary sinusitis. Medical J Babylon. 2011;8:1.