Mapping impact of intense rainfall on a high-severity burned area using principal component analysis
21
0
0
Full text
(2) Francos et al.. Cartografía del impacto de una lluvia intensa en un área quemada a alta severidad usando el análisis de componentes principales RESUMEN. Los incendios forestales de alta severidad tienen un gran impacto en las propiedades del suelo. Además, las áreas quemadas recientemente son muy sensibles a los eventos de lluvia intensa. Sin embargo, se sabe poco sobre el impacto de las precipitaciones extremas en la relación entre las propiedades del suelo y su distribución espacial. El objetivo de este estudio es examinar los efectos de un evento de lluvia intensa en las propiedades del suelo y su distribución espacial en un área pequeña mediante el análisis de componentes principales (PCA). Las variables estudiadas fueron estabilidad de agregados (AS), nitrógeno total (TN), materia orgánica del suelo (SOM), carbono inorgánico (IC), relación C/N, carbonato cálcico (CaCO3), pH, conductividad eléctrica (EC), fósforo disponible (P), calcio extraíble (Ca), magnesio extraíble (Mg), sodio extraíble (Na) y potasio extraíble (K). Cada PCA (antes y después del evento de lluvia) nos permitió extraer cinco factores. En el PCA del pre-evento de precipitación intenso el factor 1 explicó la varianza de EC, P disponible, Mg y K extraíbles; el factor 2 representa TN, SOM (altas cargas), IC y CaCO3 (bajas cargas); el factor 3 explicó AS, Ca y Na extraíbles; y los factores 4 y 5 representaron C/N y pH, respectivamente. En el PCA después del evento de precipitación el factor 1 explicó la varianza de TN, SOM, EC, P disponible, Mg y K extraíbles (altas cargas) y pH (baja carga); el factor 2 representó IC y CaCO3; el factor 3 explicó Ca y Na extraíbles; el factor 4 representó AS; y el factor 5 para C/N. Los resultados mostraron que el evento de lluvia intensa cambió la relación entre las variables, fortaleciendo la correlación entre ellas, especialmente en el caso de TN, SOM, EC, P disponible, Mg extraíble y Ca extraíble con AS. En el caso del PCA pre-evento de precipitación intensa, los modelos de variogramas más adecuados fueron: factores 1 y 2: linear model; factores 3 y 4: pure nugget effect; y factor 5: spherical model. En el caso de los factores en el PCA después del evento de precipitación intenso, con la excepción del factor 5 (spherical model), el modelo mejor ajustado fue el linear model. Los mapas de los valores del PCA ilustraron un cambio marcado en la distribución espacial de las variables antes y después del evento de lluvia intensa. Se detectaron diferencias importantes en AS, pH, IC de C/N, CaCO3, Ca y Na extraíbles. Key words: wildfire, spatial modeling, principal component analysis, soil chemical properties, intense rainfall. Palabras clave: incendio forestal, modelado espacial, análisis de componentes principales, propiedades químicas del suelo, lluvia torrencial. Received: 15 January 2018 Accepted: 13 July 2018. 602. Cuadernos de Investigación Geográfica 45 (2), 2019, pp. 601-621.
(3) Mapping impact of intense rainfall on a high-severity burned area. *Corresponding author: Marcos Francos, Grup de Recerca Ambiental Mediterrània, Department of Geography, University of Barcelona, Montalegre, 6, 08001 Barcelona, Spain. E-mail address: [email protected] 1. Introduction Wildfires may affect soil nutrients directly (e.g. heating) or indirectly (e.g. ash deposition) (Smithwick et al., 2005). These effects are heterogeneous, determined by varying topographies, fuel amounts, environmental conditions, and present considerable variability at the small scale (Outeiro et al., 2008; Romero-Ruiz et al., 2010). In the postfire period, moreover, this spatial variability undergoes marked changes depending on the erosion agents present and the incorporation of ash into the soil profile (Outeiro et al., 2008). In general, this irregular distribution of soil nutrients has a significant impact on the degree of vegetation recovery and landscape restoration after high-severity wildfires (Francos et al., 2016a). Mapping soil properties after a wildfire is crucial if we hope to identify the areas that have been most severely affected by fire and their capacity for recovery. To date, the majority of studies carried out in this regard have used remote sensing to analyse soil burning severity at the large scale (e.g. Kokaly et al., 2007; Robichaud et al., 2007). However, a number of studies have sought to map the impact of fire on soil properties at the small scale in an effort to understand the more irregular effects of fire on soil properties. Thus, Gimeno-Garcia et al. (2004) mapped the spatial distribution of fire temperature and Outeiro et al. (2008) studied the spatio-temporal effects of a prescribed fire on extractable calcium (Ca), magnesium (Mg), sodium (Na) and potassium (K). Likewise, Pereira et al. (2015) investigated the spatial distribution of extractable aluminium and zinc, zero, two, five, seven and nine months after a lowseverity grassland wildfire, and Rodríguez-Martín et al. (2013) observed the spatial pattern of several nitrogen and phosphorous (P) forms before and after a wildfire. Smithwick et al. (2012) mapped post-fire soil microbiology and Woods et al. (2007) assessed the spatial variability of soil water repellency after a wildfire. Other studies have focused on the small-scale spatial distribution of ash thickness (Pereira et al., 2013), carbon and nitrogen (Pereira et al., 2012) and extractable nutrients (Pereira et al., 2017). Despite the recognition of the importance of the spatial distribution of soil nutrients at the small scale, little is known about the impact of intense post-fire rainfall events on these patterns. Such details are of considerable relevance because torrential rainfall can modify soil nutrient levels at the small scale (Outeiro et al., 2008; De Luis et al., 2013) and, in some environments, notably the Mediterranean, intense rainfall events are common (Pereira et al., 2010). Large numbers of variables are not readily analysed. However, multivariate statistical techniques, such as principal component analysis (PCA), can be extremely useful for understanding data complexity. More specifically, PCA seeks to reduce the number of variables to a small number of uncorrelated factors (or principal components), where each factor is composed of variables that are positively or negatively correlated (Golobocanin et al., 2004; Boruvka et al., 2005). The. Cuadernos de Investigación Geográfica 45 (2), 2019, pp. 601-621. 603.
(4) Francos et al.. results of a PCA can then be mapped to show the spatial variability of the factors extracted. Mapping PCA results has been widely used in soil research based on such geostatistical techniques (e.g. Bocchi et al., 2000; Batista et al., 2001; Facchinelli et al., 2001; Saby et al., 2009) and is useful for illustrating the spatial distribution of a group of variables associated with a given factor. To date, the use of this method in fire-affected soils is limited despite the fact that it should provide considerable insights into their effects on the spatial distribution of soil nutrients. Here, the objective of this study is to identify the impacts of wildfire on the relationships between the properties of fire-affected soils before and after an intense rainfall event, and to map them, using PCA and geostatistical methods. 2. Materials and Methods 2.1. Study area, experimental design and variables studied The study area is located in the village of Colomers, Girona (42°05′17.6″ N 2°59′36.6″ E 38 m a.s.l.) in the North-East of the Iberian Peninsula. The wildfire broke out in the Camallera municipality on 12 November 2013 and burned a total area of 550 ha. The predominant vegetation of the forest area is Pinus halepensis Miller., Quercus ilex L. and Eucaliptus globulus Labill. that was completely combusted. The parent material of the burned site is composed principally of sedimentary rocks from the lower Bartonian and the soils are classified as Fluventic Haploxerept (Soil Survey Staff, 2014). The climate of the study area is Mediterranean, with a mean annual temperature of 15ºC and an annual rainfall between 600 and 800 mm (Pacheco, 2010). The environmental characteristics of the site are described in detail in Francos et al. (2016b). Three days after the fire started, we designed an experimental plot with an area of 72 m2 (18x4 m, comprising a grid with a 2m spacing between sampling points) with a slope of less than 1% in an area affected by a high-severity wildfire. The burned area was classified as high severity. Tree crown was completely combusted and the floor was covered by light grey and white ash (Úbeda et al., 2006; Pereira et al., 2012). Before the first sampling the ash layer was removed. Three days after the fire end, an intense rainfall event occurred –163 mm of rain fell during 4 days, as recorded at the Bisbald’Empordà meteorological station (41°97′ N - 03°04′ E. 29 m a.s.l.)– in the study area (Fig. 1). The second sampling campaign was carried out seven days after the fire, and the soil was bare. A total of 30 samples (0-5 cm deep) were collected per sampling date (Francos et al., 2016b) at the bottom of a gentle slope. In this study, we analysed aggregate stability (AS), total nitrogen (TN), soil organic matter (SOM), inorganic carbon (IC), C/N ratio, carbonates in % (CaCO3), pH, electrical conductivity (EC), available P, and extractable Ca, Mg, Na and K. Laboratory analyses are described in Francos et al. (2016b).. 604. Cuadernos de Investigación Geográfica 45 (2), 2019, pp. 601-621.
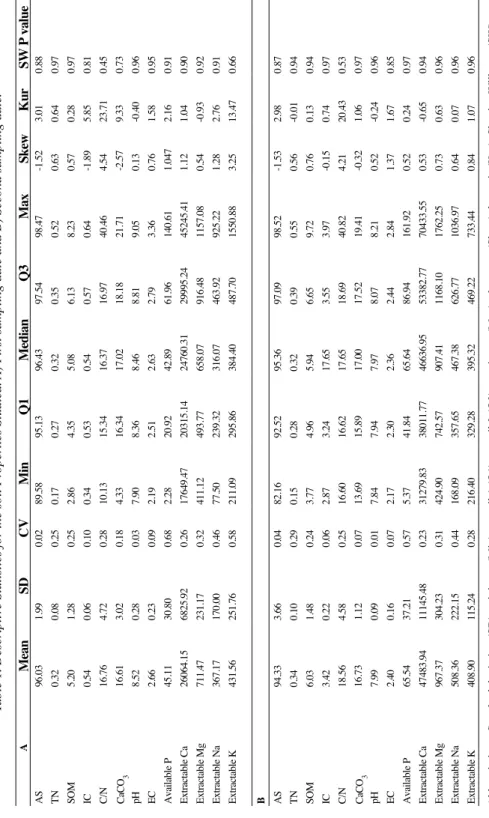
(5) Mapping impact of intense rainfall on a high-severity burned area. Figure 1. A) Termopluviometric graphic of Bisbal d’Empordà meteorological station for the days before and after the fire. Flames represent the days that fire occurred. First sampling (FS) and second sampling (SS). The white numbers in the bars represent the daily maximum precipitation intensity in mm/h. B) Wind velocity.. 2.2. Statistical and spatial analyses Before modelling, normal distribution was checked using the Shapiro-Wilk (SW) test. Data distribution was considered normal at p>0.05. Pearson correlations were performed to test the relationship between the variables. Differences were considered significant at p<0.05. PCAs were performed using the correlation matrix values and the varimax rotation method for each sampling date. The scores obtained from those factors that explained more than one variable were used in the spatial analysis. The spatial structure of the factors extracted was interpreted with a variogram. In fact, we used omni-. Cuadernos de Investigación Geográfica 45 (2), 2019, pp. 601-621. 605.
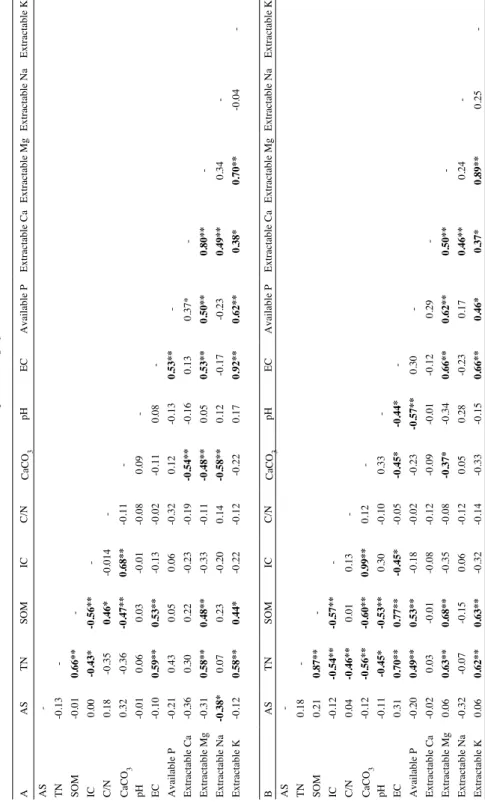
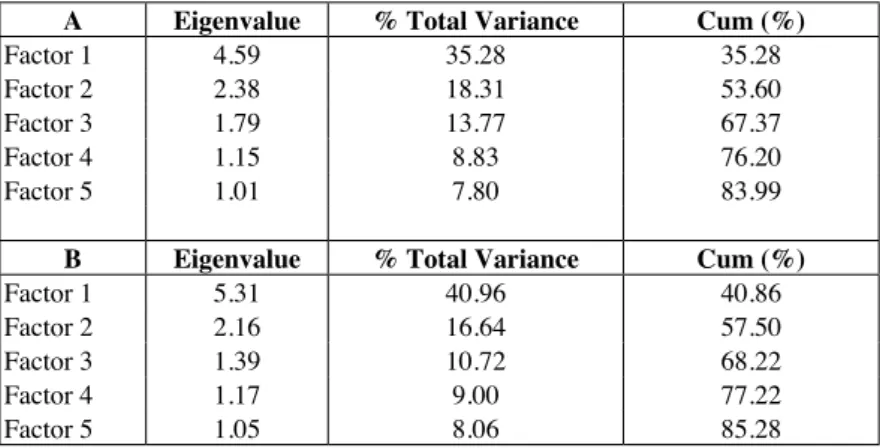
(6) Francos et al.. directional variograms as the number of sampling points (30) was insufficient to detect the presence of anisotropy. According to Webster and Oliver (2007), 150 data points are needed. Spatial dependence was assessed using the nugget:sill ratio. According to Chien et al. (1997), a ratio below 25% indicates a variable with a strong spatial dependency, while a ratio between 25-75% is indicative of a moderate spatial dependency and a ratio greater than 75% of a weak dependency. Factor mapping was carried out using the ordinary kriging method. Statistical and spatial analyses were performed with SPSS 23.0 and Surfer 8 (Golden Software), respectively. 3. Results and discussion 3.1. Descriptive statistics, correlations and PCA The descriptive statistics for the elements studied are shown in Table 1. On average, soil AS, pH, EC and extractable K all fell after the fire, while TN, SOM, IC, C/N, CaCO3, available P, extractable Ca, Mg and Na, increased. With the exceptions of AS and TN, the intense rainfall reduced the coefficient of variation (CV) of all the variables. Pearson correlation results are shown in Table 2 and highlight the significant positive correlations between TN and SOM. Moreover, EC is highly correlated with extractable K. After the intense rainfall event, TN presented high significant positive correlations with SOM and EC, and significant negative correlations with C/N and pH. Moreover, SOM presented significant positive correlations with EC and available P. A comparison of the two correlation tables shows that the intense rainfall event changed the relationship between certain elements. A better understanding of these changes is provided by the PCA. The PCA carried out before the intense rainfall event explained 83.99% of the variance, while the PCA performed for the post-fire sampling explained 85.28% (Table 3). Although these differences are not relevant, the way in which the variables are associated in the factors does differ. Thus, factor 1 in the PCA for the pre-intense rainfall event had high positive loadings on EC, available P, extractable Mg and K. This is in close agreement with previous studies that identified an increase in these elements with EC (Hernández et al., 1997; Behera and Shukla, 2015). For instance, extractable K is one of the main elements responsible for the increase in EC (Úbeda et al., 2009). Factor 2 had high positive loadings on TN and SOM and high negative loadings on IC and CaCO3. The amounts of TN and SOM both decrease with temperature/severity, while the opposite occurs with IC and CaCO3, as observed in previous studies (González-Pérez et al., 2004; Úbeda et al., 2009; Dlapa et al., 2013); as such, this inverse relation is expected. Factor 3 had high negative loadings on AS and positive loadings on extractable Ca and Na. Soil aggregates can be destroyed in soils rich in extractable Na, which is known to be an effective dispersant (Mataix-Solera et al., 2011). Previous studies reported that an increase in extractable Na reduces soil AS, as a consequence of clay dispersion (Badía and Martí, 2003; Mills and Fey, 2004). In this context, we would expect AS and extractable Na to present an inverse relationship. Finally, factors 4 and 5 had high positive loadings on C/N and pH, respectively.. 606. Cuadernos de Investigación Geográfica 45 (2), 2019, pp. 601-621.
(7) Mean. 0.23. Cuadernos de Investigación Geográfica 45 (2), 2019, pp. 601-621 11145.48. 115.24. 222.15. 304.23 0.28. 0.44. 0.31. 0.23. 0.57. 0.07. 0.01. 0.07. 0.25. 0.06. 0.24. 0.04. 0.29. 0.58. 0.46. 0.32. 0.26. 0.68. 0.09. 0.03. 0.18. 0.28. 0.10. 0.25. 0.25. CV. 0.02 0.17. 216.40. 168.09. 424.90. 31279.83. 5.37. 2.17. 7.84. 13.69. 16.60. 2.87. 3.77. 82.16. 0.15. 211.09. 77.50. 411.12. 17649.47. 2.28. 2.19. 7.90. 4.33. 10.13. 0.34. 2.86. Min. 89.58 0.27. Q1. 329.28. 357.65. 742.57. 38011.77. 41.84. 2.30. 7.94. 15.89. 16.62. 3.24. 4.96. 92.52. 0.28. 295.86. 239.32. 493.77. 20315.14. 20.92. 2.51. 8.36. 16.34. 15.34. 0.53. 4.35. 95.13. 395.32. 467.38. 907.41. 46636.95. 65.64. 2.36. 7.97. 17.00. 17.65. 17.65. 5.94. 95.36. 0.32. 384.40. 316.07. 658.07. 24760.31. 42.89. 2.63. 8.46. 17.02. 16.37. 0.54. 5.08. 0.32. Median. 96.43 0.35. Q3. 469.22. 626.77. 1168.10. 53382.77. 86.94. 2.44. 8.07. 17.52. 18.69. 3.55. 6.65. 97.09. 0.39. 487.70. 463.92. 916.48. 29995.24. 61.96. 2.79. 8.81. 18.18. 16.97. 0.57. 6.13. 97.54 0.52. 733.44. 1036.97. 1762.25. 70433.55. 161.92. 2.84. 8.21. 19.41. 40.82. 3.97. 9.72. 98.52 0.55. 1550.88. 925.22. 1157.08. 45245.41. 140.61. 3.36. 9.05. 21.71. 40.46. 0.64. 8.23. Max. 98.47. 0.84. 0.64. 0.73. 0.53. 0.52. 1.37. 0.52. -0.32. 4.21. -0.15. 0.76. -1.53 0.56. 3.25. 1.28. 0.54. 1.12. 1.047. 0.76. 0.13. -2.57. 4.54. -1.89. 0.57. 0.63. Skew. -1.52. 1.07. 0.07. 0.63. -0.65. 0.24. 1.67. -0.24. 1.06. 20.43. 0.74. 0.13. 2.98. -0.01. 13.47. 2.76. -0.93. 1.04. 2.16. 1.58. -0.40. 9.33. 23.71. 5.85. 0.28. 0.64. Kur. 3.01. 0.96. 0.96. 0.96. 0.94. 0.97. 0.85. 0.96. 0.97. 0.53. 0.97. 0.94. 0.87 0.94. 0.66. 0.91. 0.92. 0.90. 0.91. 0.95. 0.96. 0.73. 0.45. 0.81. 0.97. 0.97. SW P value. 0.88. Abbreviations: Standard deviation (SD), minimun (Min), quartil 1 (Q1), quartil 3 (Q3), maximum (Max), skewness (Skew), kurtosis (Kur), Shapiro-Wilk test (SW).. 508.36. 408.90. Extractable Na. Extractable K. 47483.94. 967.37. Extractable Mg. 37.21. 0.09. 0.16. 4.58. 0.22. 1.48. 3.66. 0.10. 2.40. 65.54. Available P. Extractable Ca. 170.00. 251.76. 1.12. 7.99. EC. 6825.92. SD. 231.17. 16.73. 18.56. 3.42. 6.03. 94.33. 0.34. CaCO3 pH. C/N. IC. SOM. TN. AS. B. 367.17. 431.56. Extractable Na. Extractable K. 26064.15. 711.47. Extractable Mg. 30.80. 0.28. 2.66. 45.11. Available P. Extractable Ca. 0.06. 4.72 3.02. 8.52. CaCO3 pH. EC. 0.08. 1.28. 1.99. 16.61. 0.54. 16.76. IC. C/N. 0.32. 96.03. 5.20. TN. A. SOM. AS. Table 1. Descriptive Statistics for the soil Properties Studied. A) First sampling date and B) Second sampling date.. Mapping impact of intense rainfall on a high-severity burned area. 607.
(8) 608. 0.18. -0.21. -0.12. -0.20. Available P. 0.06. -0.32. Extractable K. Extractable Na. 0.06. -0.02. Extractable Mg. Extractable Ca. 0.31. -0.11. 0.68**. 0.63**. 0.62**. -0.07. -0.15. -0.01. 0.63**. 0.03. 0.53**. 0.77**. -0.53**. 0.49**. 0.70**. -0.45*. 0.01. -0.60**. -0.46**. -0.56**. -. SOM. -0.12. -. 0.87**. TN. -0.57**. CaCO3 pH. EC. 0.44*. 0.23. 0.58**. 0.07. 0.48**. 0.22. 0.05. 0.58**. 0.30. 0.43. 0.03. -0.54**. 0.04. 0.53**. 0.59**. 0.06. -0.32. 0.06. -0.35. -0.08. -0.18. -0.45*. 0.30. 0.99**. -. 0.13. IC. -0.22. -0.20. -0.33. -0.23. 0.06. -0.13. -0.01. 0.68**. 0.46*. -0.47**. -0.35. -0.36. -0.014. IC. -. -. SOM. -0.56**. -0.43*. -. 0.66**. TN. -0.12. C/N. IC. 0.21. 0.18. -. AS. SOM. TN. AS. B. -0.38*. Extractable K. Extractable Na. -0.31. -0.36. Extractable Mg. Extractable Ca. -0.10. Available P. EC. -0.01. CaCO3 pH. 0.32. 0.00. C/N. IC. -0.01. SOM. -0.13. -. AS. TN. AS. A. -0.14. -0.12. -0.08. -0.12. -0.02. -0.05. -0.10. -. 0.12. C/N. -0.12. 0.14. -0.11. -0.19. -0.32. -0.02. -0.08. -. -0.11. C/N. -0.16. -0.33. 0.05. -0.37*. -0.09. -0.23. -0.45*. -. 0.33. CaCO3. -0.22. -0.58**. -0.48**. -0.15. 0.28. -0.34. -0.01. -0.57**. -. -0.44*. pH. 0.17. 0.12. 0.05. -0.13. -0.54**. 0.12. 0.08. -. pH. -0.11. -. 0.09. CaCO3. 0.66**. -0.23. 0.66**. -0.12. -. 0.30. EC. 0.92**. -0.17. 0.53**. 0.13. -. 0.53**. EC. 0.46*. 0.17. 0.62**. -. 0.29. Available P. 0.62**. -0.23. 0.50**. -. 0.37*. Available P. 0.70**. -. 0.34. -. -0.04. 0.37*. 0.46**. -. 0.50**. 0.89**. -. 0.24. -. 0.25. Extractable Ca Extractable Mg Extractable Na. 0.38*. 0.49**. -. 0.80**. Extractable Ca Extractable Mg Extractable Na. -. Extractable K. -. Extractable K. Table 2. Pearson coefficient of correlation results. A) First sampling date and B) Second sampling date. Significant correlations at *P<0.05, and **P<0.01. Values in bold represent significant correlations.. Francos et al.. Cuadernos de Investigación Geográfica 45 (2), 2019, pp. 601-621.
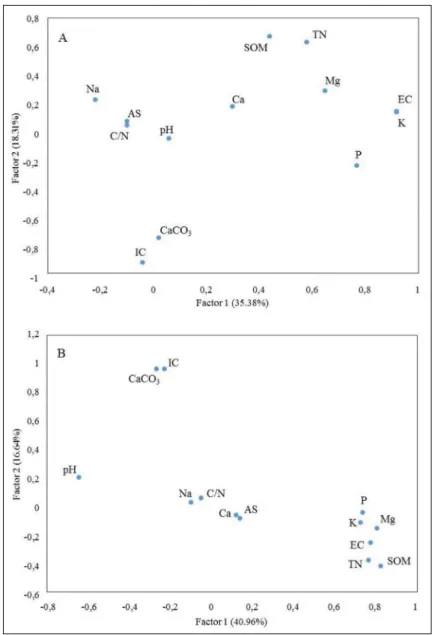
(9) Mapping impact of intense rainfall on a high-severity burned area. Table 3. Eigenvalues Results by Factor. A) First sampling date and B) Second sampling date. A Factor 1 Factor 2 Factor 3 Factor 4 Factor 5. Eigenvalue 4.59 2.38 1.79 1.15 1.01. % Total Variance 35.28 18.31 13.77 8.83 7.80. Cum (%) 35.28 53.60 67.37 76.20 83.99. B Factor 1 Factor 2 Factor 3 Factor 4 Factor 5. Eigenvalue 5.31 2.16 1.39 1.17 1.05. % Total Variance 40.96 16.64 10.72 9.00 8.06. Cum (%) 40.86 57.50 68.22 77.22 85.28. Factor 1 in the PCA performed on samples collected after the intense rainfall event had high positive loadings on TN, SOM, EC, available P, extractable Mg and K, and a high negative loading on pH. This indicates that the presence of certain ions, especially available P and extractable Mg and K, was more dependent on the amount of SOM than they were in the pre-intense rainfall sampling. In addition, the reduction in pH (<8) was more suited to the dissolution of these elements (Pereira et al., 2014). Despite this, pH was negatively correlated with EC, available P, extractable Mg and K. This can be attributed to the existence of pH values >8 that reduced the presence of P, Mg and K in solution, as a consequence of the retention and precipitation of P with the presence of CaCO3 and the reduction in solubility of Mg and K at high pH and the existence of CaCO3 (Pereira et al., 2012). Factor 2 had high positive loadings on IC and CaCO3, while factor 3 had high positive loadings on extractable Ca and Na. The fall in the correlation between extractable Na and AS can be attributed to the marked increase in extractable Ca and Mg in relation to Na, reducing the saline cation dispersant capacity (Mahmoodabadi et al., 2013). Factors 3 and 4 had high positive loadings on AS and C/N, respectively. The PCAs confirmed the results of the Pearson correlation analyses, showing that the intense rainfall episode changed the relation between some of the soil variables. This is apparent from Figure 2. This figure plots the relationship between factors 1 and 2 (the two factors explaining most of the variance) in both PCAs. In general, after the intense rainfall event, the association between the groups of variables was strengthened (dots appear closer together), especially in the cases of TN, SOM, EC, available P and extractable Mg and extractable Ca and AS. Extractable K increased its correlations with all elements, with the exception of EC. The fall in the correlation between EC and extractable K can be attributed to the great mobility of this element (Levula et al., 2000), reducing its influence on soil EC. Correlations increased between extractable Na and C/N, extractable Ca and AS, and CaCO3 and IC. There was a slight reduction in the correlation between extractable Na and AS. This would seem to confirm, as discussed above, that the relative increase in extractable Ca in relation to Na, and the high correlation between the bivalent cation with AS, resulted in the reduced impact of the saline cation. Previous. Cuadernos de Investigación Geográfica 45 (2), 2019, pp. 601-621. 609.
(10) Francos et al.. studies noted that the presence of Ca contributes to soil structure (García-Orenes et al., 2005; Blankinship et al., 2016). A slight decrease in the correlation between C/N and AS was also observed. This may be due to the incorporation of mineralized organic matter (low C/N) into the soil profile. Ash is a good cementing agent and may have reduced the impact of unmineralized organic matter (Bodi et al., 2014).. Figure 2. Relationship between factor 1 and factor 2. A) Before the intense rainfall event, and B) After the intense rainfall event. Aggregate stability (AS), total nitrogen (TN), soil organic matter (SOM), inorganic carbon (IC), C/N ratio, carbonates in % (CaCO3), pH, electrical conductivity (EC), available phosphorus (P), extractable calcium (Ca), magnesium (Mg), sodium (Na) and potassium (K).. 610. Cuadernos de Investigación Geográfica 45 (2), 2019, pp. 601-621.
(11) Mapping impact of intense rainfall on a high-severity burned area. Severe wildfires have been reported to increase the variability of soil properties as a consequence of direct effects (e.g. soil heating) (Inbar et al., 2014; Doerr et al., 2017), and as observed in previous studies (Dodonov et al., 2014; Lombao et al., 2015). Different types of fuel, pack, density, connectivity and moisture induce different conditions of combustion, heat release and, therefore, impacts on soil (Merino et al., 2015; LópezMartín et al., 2016). After the intense rainfall, we observed an increase in the relationship between certain variables and a reduction in spatial variability, which can be attributed to the decrease in the dispersion of the data values relative to the mean. 3.2. Spatial structure analysis The variogram analysis of factors 1 and 2 in the PCA for the pre-intense rainfall event showed that the spatial variability of EC, available P, extractable Mg, K, TN, SOM, IC and CaCO3 (factors 1 and 2) fitted better with the linear model, while AS, extractable Ca, Na and C/N (factors 3 and 4) presented a pure nugget effect. The spherical model provided the best fit for pH (factor 5). The spatial dependence of pH was weak (Table 4a, Fig. 3). For factors 1 and 2, we observed a spatial correlation across the whole study area. Indeed, a linear variogram is evidence that the factor 1 and 2 scores were spatially correlated in all the directions measured (Jeelani et al., 2017). This means that if the spatial distance between two sampling points increases, the difference between the two values also increases (Cambardella et al., 1994). On the other hand, the factor 3 and 4 variables did not show any spatial correlation. A nugget effect can be attributed to the small-scale variance, the limited number of samples and the existence of outliers (Oliver and Webster, 2014; Pereira et al., 2017). In the current case, it might be attributed to the small-scale variance induced by the wildfire or the sampling resolution, despite the fact that the resolution employed herein was quite precise (2-m spacing between sampling points in an area of 18x4m). pH (factor 5) had a range of 5.7 m, making it higher than the sampling density, which shows that the sampling design was appropriate for describing the spatial variability of this factor. In the case of the PCA performed on the samples collected after the intense rainfall event, the linear model provided the best fit for all the variables (factors 1, 2, 3 and 4), with the exception of the C/N ratio (factor 5). The nugget:sill ratios showed that the spatial dependence of factor 5 was weak (Table 5a, Fig. 4). From these results, we observed that the spatial structure of some of the variables, including AS, extractable Ca, Na, C/N and pH, changed between the dates of analysis. The spatial correlations of AS, extractable Ca, Na and C/N increased, while that of pH decreased. Among the variables explained by factor 1 before and after the intense rainfall event (EC, available P, extractable Mg and K), there was a reduction in the spatial correlation. After the intense rainfall sampling period in no instances did we observe a pure “nugget effect”, while in all the factors we observed a spatial correlation. This indicates that the precipitation induced a spatial pattern, albeit small in some cases, in all the variables studied. Our results are in line with those reported by Outeiro et al. (2008), indicating that precipitation was a key factor in changing the spatial structure of soil properties after an episode of rain. The different spatial structure presented by the soil variables after the intense rainfall event can be attributed to three factors: 1) Impact of rain-splash on soil, which contributes to ash and soil detachment and transport (Jordan et al., 2016); 2) Different rates of ash infiltration and leaching of nutrients into. Cuadernos de Investigación Geográfica 45 (2), 2019, pp. 601-621. 611.
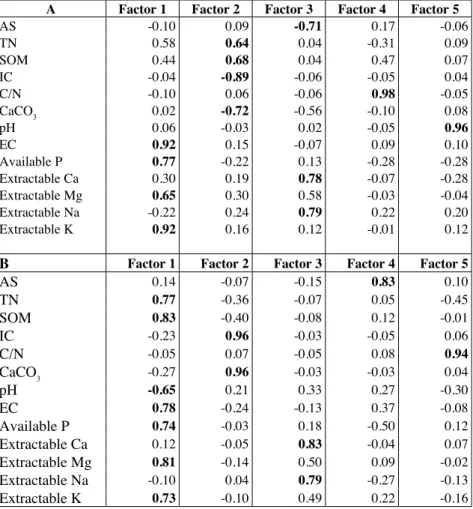
(12) Francos et al.. soil profile (Pereira et al., 2013, 2014); and, 3) Soil and ash transport from the adjacent slope. Previous studies have observed a high rate of erosion after a fire and the deposition of ash and soil in flat areas (Novara et al., 2011; Shakesby et al., 2016). Despite the increase in the spatial correlation, an increase was also recorded in the nugget effect (Table 5) pointing to an increase in small-scale variance, even though there was a slight decrease in the coefficient of variation in most of the variables. This effect has also been observed in previous studies, that is, a high coefficient of variation with a reduced nugget effect (Paz-Ferreiro et al., 2010; Al-Omran et al., 2013; Wang et al., 2014; Kurunc et al., 2016; Usowicz and Lipiec, 2017). This can be attributed to the presence of high and low values in neighboring sampling points. Overall, the intense post-fire rainfall induces a complex change in the spatial structure of the variables studied. On both sampling dates, variograms reached the sill only in relation to factor 5 (pH and C/N). In both cases, the spatial dependence was very weak, showing that both fire and intense rainfall (extrinsic factors) influenced the spatial distribution of pH and C/N, respectively. Table 4. Eigenvalues Results by soil property. A) First sampling date and B) Second sampling date. A AS TN SOM IC C/N CaCO3 pH EC Available P Extractable Ca Extractable Mg Extractable Na Extractable K. B AS TN SOM IC C/N CaCO3 pH EC Available P Extractable Ca Extractable Mg Extractable Na Extractable K. Factor 1 -0.10 0.58 0.44 -0.04 -0.10 0.02 0.06 0.92 0.77 0.30 0.65 -0.22 0.92. Factor 2 0.09 0.64 0.68 -0.89 0.06 -0.72 -0.03 0.15 -0.22 0.19 0.30 0.24 0.16. Factor 3 -0.71 0.04 0.04 -0.06 -0.06 -0.56 0.02 -0.07 0.13 0.78 0.58 0.79 0.12. Factor 4 0.17 -0.31 0.47 -0.05 0.98 -0.10 -0.05 0.09 -0.28 -0.07 -0.03 0.22 -0.01. Factor 5 -0.06 0.09 0.07 0.04 -0.05 0.08 0.96 0.10 -0.28 -0.28 -0.04 0.20 0.12. Factor 1 0.14 0.77 0.83 -0.23 -0.05 -0.27 -0.65 0.78 0.74 0.12 0.81 -0.10 0.73. Factor 2 -0.07 -0.36 -0.40 0.96 0.07 0.96 0.21 -0.24 -0.03 -0.05 -0.14 0.04 -0.10. Factor 3 -0.15 -0.07 -0.08 -0.03 -0.05 -0.03 0.33 -0.13 0.18 0.83 0.50 0.79 0.49. Factor 4 0.83 0.05 0.12 -0.05 0.08 -0.03 0.27 0.37 -0.50 -0.04 0.09 -0.27 0.22. Factor 5 0.10 -0.45 -0.01 0.06 0.94 0.04 -0.30 -0.08 0.12 0.07 -0.02 -0.13 -0.16. Bold numbers remark the properties that explained each factor.. 612. Cuadernos de Investigación Geográfica 45 (2), 2019, pp. 601-621.
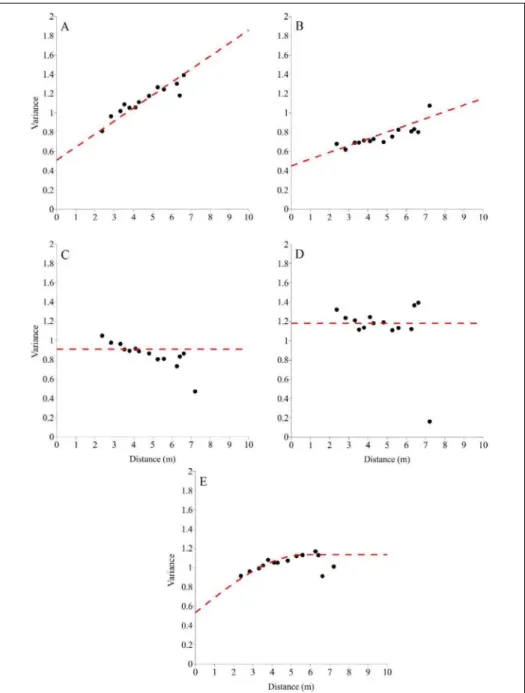
(13) Mapping impact of intense rainfall on a high-severity burned area. Figure 3. Omni-directional variogram calculated according to factor score results in first sampling: A) Factor 1; B) Factor 2; C) Factor 3; D) Factor 4; and E) Factor 5.. Cuadernos de Investigación Geográfica 45 (2), 2019, pp. 601-621. 613.
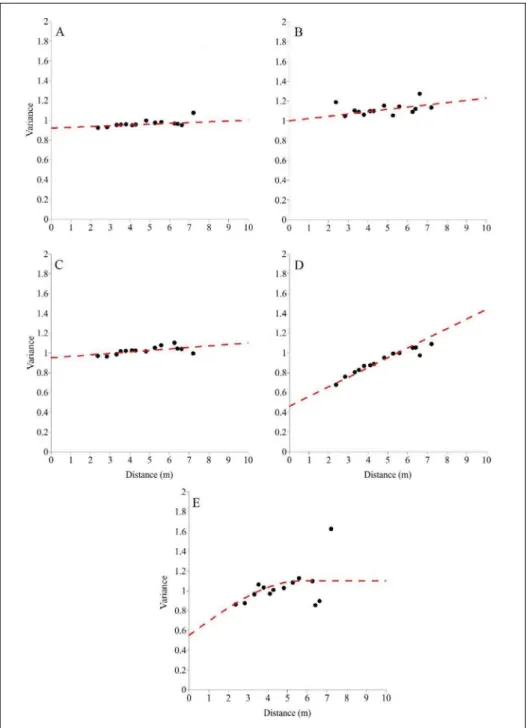
(14) Francos et al.. Figure 4. Omni-directional variogram calculated according to factor score results in second sampling: A) Factor 1; B) Factor 2; C) Factor 3; D) Factor 4; and E) Factor 5.. 614. Cuadernos de Investigación Geográfica 45 (2), 2019, pp. 601-621.
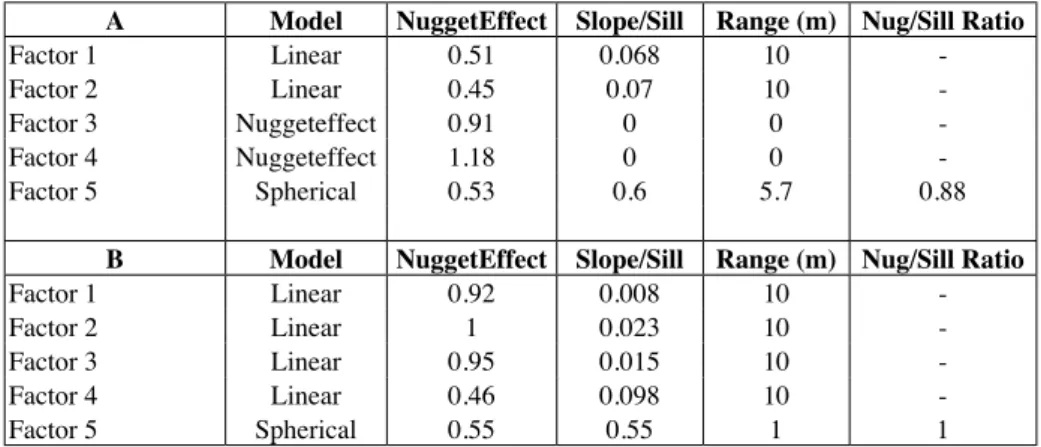
(15) Mapping impact of intense rainfall on a high-severity burned area. Table 5. Variogram properties of factors. A) First sampling date and B) Second sampling date. Factor 1 Factor 2 Factor 3 Factor 4 Factor 5 Factor 1 Factor 2 Factor 3 Factor 4 Factor 5. A. B. Model NuggetEffect Linear 0.51 Linear 0.45 Nuggeteffect 0.91 Nuggeteffect 1.18 Spherical 0.53 Model Linear Linear Linear Linear Spherical. NuggetEffect 0.92 1 0.95 0.46 0.55. Slope/Sill 0.068 0.07 0 0 0.6. Range (m) Nug/Sill Ratio 10 10 0 0 5.7 0.88. Slope/Sill 0.008 0.023 0.015 0.098 0.55. Range (m) Nug/Sill Ratio 10 10 10 10 1 1. 3.3. Factor maps The maps produced using ordinary kriging interpolation are shown in Figure 5. The spatial distribution of factor 1 (EC, available P, extractable Mg and K) in the PCA carried out on the samples collected before the intense rainfall event reveals a hotspot, where the variables explained by this factor have a high content (positive loadings, Table 4) (Fig. 5a). This indicates that the direct impact of fire on the increase in elements explained by factor 1 was mainly observed in this specific area. Factor 2 (TN, SOM, CaCO3 and IC) presented a more heterogeneous distribution; however, some patterns can be detected – notably, high loadings to the north of the area (high TN and SOM/low CaCO3 and IC) and low loadings to the south (Fig. 5b). Factors 3 and 4 (AS, extractable Ca, Na and C/N) presented a clearly heterogeneous distribution, with the existence of several hotspots. This random pattern was confirmed by the variogram analysis (Fig. 5c and d). In the case of factor 3, in those areas where levels of extractable Ca and Na were high, AS was low. The spatial distribution of factor 5 (pH) presents a quite specific pattern, recording high values in certain areas to the north and south of the area (Fig. 5e). The factor maps (Fig. 6) plotted after the intense rainfall event show, in general, larger areas with high and low values. At the same time, what is also apparent is the presence of contiguous points with high and low values, which, as mentioned above, are responsible for the increase in small-scale variation and the nugget effect. Factor 1 (TN, SOM, pH, EC, available P, extractable Mg and K) had high loadings in some zones located to the west and east of the area (high TN, SOM, EC, available P, extractable Mg and K / low pH). A comparison of the map of factor 5 from the samples taken before the intense rainfall event (Fig. 5e) and that of factor 1 from the post rainfall event (Fig. 6a) shows that the intense rainfall led to marked changes in the distribution of soil pH. Factor 2 (IC and CaCO3) had high loadings in the south and east of the area (Fig. 6b). Here, a comparison of the factor 2 maps from the pre- and post-intense rainfall PCAs shows that the spatial distribution of IC and CaCO3 underwent marked changes. Factor 3 (extractable Ca and Na) also had high loadings in the south of the study area (Fig. 6c), the opposite distribution to that observed for factor 3 in the pre-intense rainfall PCA (Fig. 5c).. Cuadernos de Investigación Geográfica 45 (2), 2019, pp. 601-621. 615.
(16) Francos et al.. Factor 4 (AS) also had higher loadings in the south of the area (Fig. 6d), while factor 5 (C/N) had low loadings throughout most of the study area. Only one major hotspot was observed in the north (Fig. 6e). A comparison of the pre-intense rainfall factor 4 (Fig. 5d) with the postintense rainfall factor 5 (Fig. 6e) shows a slightly different C/N spatial distribution, especially as regards the areas presenting high loadings. Overall, therefore, the intense rainfall event resulted in marked changes in the spatial distribution of the nutrients, being especially apparent in the cases of factors 2, 3 and 4 which account for IC, CaCO3, extractable Ca and Na and AS in the southern part of the study area.. Figure 5. Interpolation maps with the results of factor scores in first sampling: A) Factor 1; B) Factor 2; C) Factor 3; D) Factor 4; and E) Factor 5. Figure 6. Interpolation maps with the results of factor scores in second sampling: A) Factor 1; B) Factor 2; C) Factor 3; D) Factor 4; and E) Factor 5.. 616. Cuadernos de Investigación Geográfica 45 (2), 2019, pp. 601-621.
(17) Mapping impact of intense rainfall on a high-severity burned area. 4. Conclusions The intense rainfall event changed the relationship between the soil variables, causing some correlations to increase and others to fall. These changes were also reflected in the spatial structure of the factors extracted from the pre- and post-intense rainfall PCAs. In the pre-intense rainfall PCA, the best-fit variogram of factors 1 and 2 was provided by the linear model, while for factors 3 and 4 it was provided by the pure nugget effect and for factor 5 by the spherical model. In the post-intense rainfall event PCA, with the exception of factor 5, the linear variogram provided the best-fit for the rest of the factors extracted and also showed a spatial correlation. However, the nugget effect was also high in the post-intense rainfall variograms due to the high, small-scale variability. The spatial distribution of the variables after wildfire was different, especially as regards AS, pH, C/N, IC, CaCO3, extractable Ca and Na. All in all, this study has highlighted the importance of intense rainfall events for the spatial distribution of soil properties in fireaffected areas. Further studies are currently ongoing to determine the impact of extreme rainfall events on the spatial distribution of soil properties on slopes of different aspects. Acknowledgments This study was supported by the POSTFIRE Project (CGL2013-47862-C2-1 and 2-R) and the POSTFIRE_CARE Project (CGL2016-75178-C2-2-R) sponsored by the Spanish Ministry of Economy and Competitiveness and AEI/FEDER, EU. Support was also received from the FPU Program (FPU 014/00037), sponsored by the Ministry of Education, Culture and Sports; EST16/00183 – a short-stay grant at MykolasRomeris University (Vilnius, Lithuania), provided by the Ministry of Education, Culture and Sports; and the Program2017SGR1344 of the Generalitat de Catalunya. We also wish to thank the University of Barcelona’s technical services for the English revision of the manuscript. The authors acknowledge the valuable suggestions of two anonymous reviewers who have contributed to the quality of this study. References Al-Omran, A.M., Al-Wabel, M.I., El-Maghraby, S.E., Nadeem, M.E., Al-Sharani, S. 2013. Spatial variability for some properties of wastewater irrigated soils. Journal of the Saudi Society of Agricultural Science 12, 167-175. https://doi.org/10.1016/j.jssas.2012.12.001. Bada, D., Martí, C. 2003. Plant ash and heat intensity effects on chemical and physical properties of two contrasting soils. Arid Land Research and Management 17, 23-41. https://doi. org/10.1080/15324980301595. Batista, A.C., Sousa, A.J., Batista, M.J., Viegas, L. 2001. Factorial kriging with external drift: a case study on the Penedono region, Portugal. Applied Geochemistry 16, 921-929. https://doi. org/10.1016/S0883-2927(00)00069-X. Behera, S.K., Shukla, A.K. 2015. Spatial distribution of surface soil acidity, electrical conductivity, soil organic carbon content and exchangeable potassium, calcium and magnesium in some cropped acid soils of India. Land Degradation & Development 26, 71-79. https://doi.org/10.1002/ldr.2306. Blankinship, J.C., Fonte, S.J., Six, J., Schimel, J.P. 2016. Plant versus microbial control on soil aggregate stability in seasonally dry ecosystem. Geoderma 272, 39-50. https://doi. org/10.1016/j.geoderma.2016.03.008.. Cuadernos de Investigación Geográfica 45 (2), 2019, pp. 601-621. 617.
(18) Francos et al.. Bocchi, S., Castrignano, A., Fornaro, F., Maggiore, T. 2000. Application of a factorial kriging for mapping soil variation at field scale. European Journal of Agronomy 13, 295-308. https://doi. org/10.1016/S1161-0301(00)00061-7. Bodí, M., Martin, D.A., Santin, C., Balfour, V., Doerr, S.H., Pereira, P., Cerdà, A., Mataix-Solera, J. 2014. Wildland fire ash: production, composition and eco-hydrogeomorphic effects. Earth-Science Reviews 130, 103-127. https://doi.org/10.1016/j. earscirev.2013.12.007. Boruvka, L., Vacek, O., Jehlicka, J. 2005. Principal component analysis as a tool to indicate the origin of potentially toxic elements. Geoderma 128, 289-300. https://doi.org/10.1016/j. geoderma.2005.04.010. Cambardella, C.A., Moorman, T.B., Novak, J.M., Parkin, T.B., Karlen, D.L., Turco, R.F., Konopka, A.E. 1994. Field scale variability of soil properties in central Iowa soils. Soil Science Society of America Journal 58, 1501-1511. https://doi.org/10.2136/sssaj1994 .03615995005800050033x. Chien, Y.L., Lee, D.Y., Guo, H.Y. 1997. Geostatistical analysis of soil properties of mid-west Taiwan soils. Soil Science 162, 291-298. https://doi.org/10.1097/00010694-19970400000007. De Luis, M., González-Hidalgo, J.C., Raventós, J. 2003. Effects of fire and torrential rainfall on erosion in a Mediterranean gorse community. Land Degradation & Development 14, 202213. https://doi.org/10.1002/ldr.547. Dlapa, P., Bodí, M., Mataix-Solera, J., Cerdà, A., Doerr, S.H. 2013. FT-IR spetroscopy reveals that ash water repellency is highly dependent on ash chemical composition. Catena 108, 35-43. https://doi.org/10.1016/j.catena.2012.02.011. Dodonov, P., Oliveira Xavier, R., Santos Tiberio, F.C., Lucena, I.C., Zanelli, C.B., Silva Matos, D.M. 2014. Driving factors of small-scale variability in savanna plant population after a fire. Acta Oecologica 56, 47-55. https://doi.org/10.1016/j.actao.2014.02.003. Doerr, S.H., Santin, C., Reardon, J., Mataix-Solera, J., Stoof, C., Bryant, R., Miesel, J., Badia, D. 2017. Soil heating during wildfires and prescribed burns: a global evaluation based on existing new data. Geophysical Research Abstracts. EGU2017-17957-1. Facchinelli, A., Sacchi, E., Mallen, L. 2001. Multivariate statistical and GIS-based approach to identify heavy metals sources in soils. Environmental Pollution 114, 313-324. https://doi. org/10.1016/S0269-7491(00)00243-8. Francos, M., Úbeda, X., Tort, J., Panareda, J.M., Cerdà, A. 2016a. The role of forest fire severity on vegetation recovery after 18 years. Implications for forest management of Quercus suber L. in Iberian Peninsula. Global and Planetary Change 145, 11-16. https://doi.org/10.1016/j. gloplacha.2016.07.016. Francos, M., Pereira, P., Alcañiz, M., Mataix-Solera, J., Úbeda, X. 2016. Impact of an intense rainfall event on soil properties following a wildfire in a Mediterranean environment (NorthEast Spain). Science of the Total Environment 572, 1353-1362. https://doi.org/10.1016/j. scitotenv.2016.01.145. García-Orenes, F., Guerrero, C., Mataix-Solera, J., Navarro-Pedreno, J., Gómez, I., MataixBeneyeto, J. 2005. Factors controlling the aggregate stability and bulk density in two different degraded soils amended with biosolids. Soil & Tillage Research 82, 65-76. https:// doi.org/10.1016/j.still.2004.06.004. Gimeno-García, E., Andreu, V., Rubio, J.L. 2004. Spatial patterns of soil temperatures during experimental fires. Geoderma 118, 17-38. https://doi.org/10.1016/S0016-7061(03)00167-8. Golobocanin, D., Skrbic, B.D., Miljevic, N.R. 2004. Principal component analysis for soil contamination with PAH’s. Chemometrics and Intelligent Laboratory Systems 72, 219-223. https://doi.org/10.1016/j.chemolab.2004.01.017.. 618. Cuadernos de Investigación Geográfica 45 (2), 2019, pp. 601-621.
(19) Mapping impact of intense rainfall on a high-severity burned area. González-Pérez, J.A., González-Vila, F.J., Almendros, G., Knicker, H. 2004. The effect of fire on soil organic matter. Environmental International 30, 855-870. https://doi.org/10.1016/j. envint.2004.02.003. Hernández, T., García, C., Reinhardt, I. 1997. Short-term effect of wildfire on the chemical, biochemical and microbiological properties of Mediterranean pine forests. Biology and Fertility of Soils 25, 109-116. https://doi.org/10.1007/s003740050289. Inbar, A., Lado, M., Sternberg, M., Tenau, H., Ben-Hur, M. 2014. Forest fire effects on soil chemical and physicochemical properties, infiltration, runoff, and erosion in a semiarid Mediterranean region. Geoderma 221-222, 131-138. https://doi.org/10.1016/j.geoderma.2014.01.015. Jeelani, J., Kirmani, N.A., Sofi, J.A., Mir, S.A., Wani, J.A., Rasool, R., Sadat, S. 2017. An overview of the spatial variability of soil microbiological properties using Geostatistics. International Journal of Current Microbiology and Applied Science 6, 1132-1145. https:// doi.org/10.20546/ijcmas.2017.604.140. Jordán, A., Zavala, L., Granjed, A., Gordillo-Rivero, A., García-Moreno, J., Pereira, P., BárcenasMoreno, G., de Celis, R., Jiménez-Compán, E., Alanis, N. 2016. Wettability of ash conditions splash erosion and runoff rates post-fire. Science of the Total Environment 572, 1261-1268. https://doi.org/10.1016/j.scitotenv.2015.09.140. Kokaly, R.F., Rockwell, B.W., Haire, S.L., King, T.V.V. 2007. Characterization of post-fire surface cover, soils, and burn severity at the Cerro Grande Fire, New Mexico, using hyperspectral and multispectral remote sensing. Remote Sensing of Environment 106, 305-325. https://doi. org/10.1016/j.rse.2006.08.006. Kurunc, A., Ersahin, S., Sonmez, N.K., Kaman, H., Uz, I., Uz, B.Y., Aslan, G.E. 2016. Seasonal changes on spatial variation of some groundwater quality variables in a large irrigated coastal Mediterranean region of Turkey. Science of the Total Environment 554, 53-63. https://doi. org/10.1016/j.scitotenv.2016.02.158. Levula, T., Saarsalmi, A., Rantavaara, A. 2000. Effects of ash fertilization and prescribed burning on macronutrient, heavy metal, Sulphur and 137Cs concentration in lingonberries (Vaccinium vitis-idaea). Forest Ecology and Management 126, 269-279. https://doi.org/10.1016/S03781127(99)00110-3. Lombao, A., Barreiro, A., Carballas, T., Fonturbel, M.T., Martin, A., Vega, J.A., Fernández, C., Díaz-Ravina, M. 2015. Changes in soil properties after a wildfire in Fragas do Eume Natural Park (Galicia, NW Spain). Catena 135, 409-418. https://doi.org/10.1016/j. catena.2014.08.007. López-Martín, M., Velasco-Molina, M., Knicker, H. 2016. Variability of the quality and quantity of organic matter in soil affected by multiple wildfires. Journal of Soils Sediments 16, 360370. https://doi.org/10.1007/s11368-015-1223-2. Mahmoodabadi, M., Yazdanpanah, N., Rodríguez-Sinobas, L., Pazira, E., Neshat, A. 2013. Reclamation of calcareous saline sodic soil with difference ammendements (I): Redistribution of soluble cations within the soil profile. Agricultural Water Management 120, 30-38. https:// doi.org/10.1016/j.agwat.2012.08.018. Mataix-Solera, J., Cerdà, A., Arcenegui, V., Jordán, A., Zavala, L.M. 2011. Fire effects on soil aggregation. Earth-Science Reviews 109, 44-60. https://doi.org/10.1016/j. earscirev.2011.08.002. Merino, A., Chávez-Vergara, B., Salgado, J., Fonturbel, M.T., García-Oliva, F., Vega, J.A. 2015. Variability in the composition of charred litter generated by wildfire in different ecosystems. Catena 133, 52-63. https://doi.org/10.1016/j.catena.2015.04.016. Mills, A.J., Fey, M.V. 2004. Frequent fires intensify soil crusting: physicochemical feedback in the pedoderm of long-term burn experiments in South Africa. Geoderma 121, 45-54. https://doi. org/ 10.1016/j.geoderma.2003.10.004.. Cuadernos de Investigación Geográfica 45 (2), 2019, pp. 601-621. 619.
(20) Francos et al.. Novara, A., Gristina, L., Bodí, M.B., Cerdà, A. 2011. The impact of fire on redistribution of soil organic matter on a mediterranean hillslope under maquia vegetation type. Land Degradation & Development 22, 530-536. https://doi.org/10.1002/ldr.1027. Oliver, M.A., Webster, R. 2014. A tutorial guide to geostatistics: Computing and modelling variograms and kriging. Catena 113, 56-69. https://doi.org/10.1016/j.catena.2013.09.006. Outeiro, L., Asperó, F., Úbeda, X. 2008. Geostatistical methods to study spatial variability of soil cations after a prescribed fire and rainfall. Catena 74, 310-320. https://doi.org/10.1016/j. catena.2008.03.019. Pacheco, E. 2010. Dinámicas hidrológicas en la cuenca mediterránea litoral del río Daró. Años 2004 - 2010. Trabajo Fin de Máster, Universitat de Barcelona. 77 pp. Paz-Ferreiro, J., Vázquez, E.V., Vieira, S.R. 2010. Geostatistical analysis of geochemical dataset. Bragantia 69, 121-129. http://doi.org/10.1590/S0006-87052010000500013. Pereira, P., Brevik, E.C., Cerdà, A., Úbeda, X., Novara, A., Francos, M., Rodrigo-Comino, J., Bogonovic, I., Khaledian, Y. 2017. Mapping ash CaCO3, pH and extractable elements using principal component analysis. In: P. Pereira, E.C. Brevik, M. Muñoz-Rojas, B. Miller (Eds.), Soil Mapping and Process Modeling for Sustainable Land Use Management. Elsevier, Netherlands, pp. 319-334. Pereira, P., Cerdà, A., Úbeda, X., Mataix-Solera, J., Martin, D., Jordán, A., Burguet, M. 2013. Spatial models for monitoring the spatio-temporal evolution of ashes after fire-a case study of a burnt grassland in Lithuania. Solid Earth 4, 153-165. https://doi.org/10.5194/se-4-153-2013. Pereira, P., Oliva, M., Baltrenaite, E. 2010. Modelling extreme precipitation in hazardous mountainous areas. Contribution to landscape planning and environmental management. Journal of Environmental Engineering and Landscape Management 18, 329-342. https://doi. org/10.3846/jeelm.2010.38. Pereira, P., Pranskevicius, M., Bolutiene, V., Jordán, A., Zavala, L., Úbeda, X., Cerdà, A. 2015. Short term spatio-temporal variability of soil water extractable Al and Zn after a low severity grassland fire in Lithuania. Flamma 6, 50-57. Pereira, P., Úbeda, X., Martín, D. 2012. Fire severity effects on ash chemical composition and water-extractable elements. Geoderma 191, 105-114. https://doi.org/10.1016/j.geoderma. 2012.02.005. Pereira, P., Úbeda, X., Martín, D., Cerdà, A., Mataix-Solera, J., Burget, M. 2014. Wildfire effects on ash extractable elements in a Quercus suber forest located in Portugal. Hydrological Processes 28, 3681-3690. https://doi.org/10.1016/10.1002/hyp.9907. Robichaud, P.R., Lewis, S.A., Laes, D.Y.M., Hudak, A.T., Kokaly, F., Zamudio, J.A. 2007. Postfire soil burn severity mapping with hyperspectral image unmixing. Remote Sensing of Environment 108, 467-480. Rodríguez-Martín, J.A., Ramos-Miras, J.J., Boluda, R., Gil, C. 2013. Spatial relations of heavy metals in arable and greenhouse soils of a Mediterranean environment region (Spain). Geoderma 200-201, 180-188. https://doi.org/10.1016/j.geoderma.2013.02.014. Romero-Ruiz, M., Etter, A., Sarmiento, A., Tansey, K. 2010. Spatial and temporal variability of fires in relation to ecosystems, land tenure and rainfall in savannas of northern South America. Global Change Biology 16, 2013-2023. https://doi.org/10.1111/j.1365-2486.2009.02081.x. Saby, N.P.A., Thioulouse, J., Jolivet, C.C., Ratie, C., Boulonne, L., Bispo, A., Arrouays, D. 2009. Multivariate analysis of the spatial patterns of 8 trace elements using French soil monitoring data. Science of the Total Environment 407, 5644-5652. https://doi.org/10.1016/j. scitotenv.2009.07.002. Shakesby, R.A., Moody, J., Martin, D.A., Robichaud, P.R. 2016. Synthesizing empirical results to improve predictions of post-wildfire runoff and erosion response. International Journal of Wildland Fire 25, 257-261.. 620. Cuadernos de Investigación Geográfica 45 (2), 2019, pp. 601-621.
(21) Mapping impact of intense rainfall on a high-severity burned area. Smithwick, E.A.H., Naithani, K.J., Balser, T.C., Romme, W.H., Turner, M.G. 2012. Post-fire spatial patterns of soil nitrogen mineralization and microbial abundance. PLoS ONE 7 (11), e50597. https://doi.org/10.1371/journal.pone.0050597. Smithwick, E.A.H., Turner, M.G., Mack, M.C., Chapin, III F.S. 2005. Post-fire soil N cycling in northern conifer forests affected by severe, stand-replacing wildfires. Ecosystems 8, 163-181. https://doi.org/10.1007/s10021-004-0097-8. Soil Survey Staff. 2014. Keys to soil taxonomy, 12th ed. USDA-Natural Resources Conservation Service, Washington, DC. Úbeda, X., Outeiro, L.R., Sala, M. 2006. Vegetation regrowth after a differential intensity forest fire in a Mediterranean environment, northeast Spain. Land Degradation & Development 17, 429-440. https://doi.org/10.1002/ldr.748. Úbeda, X., Pereira, P., Outeiro, L., Martin, D. 2009. Effects of fire temperature on physical and chemical characteristics of the ash from two plots of cork oak (Quercus suber). Land Degradation & Development 20, 589-608. https://doi.org/10.1002/ldr.930. Usowicz, B., Lipiec, J. 2017. Spatial variability of soil properties and cereal yield in a cultivated field sandy soil. Soil & Tillage Research 174, 241-250. https://doi.org/10.1016/j.still.2017.07.015. Wang, L., Coles, N., Wu, C., Wu, J. 2014. Effect of long-term reclamation on soil properties on a coastal plan, Southwest China. Journal of Coastal Research 30, 661-669. https://doi. org/10.2112/JCOASTRES-D-13-00129.1. Webster, R., Oliver, M.A. 2007. Geostatistics for environmental scientists. John Wiley & Sons. 333 pp. Woods, S.W., Birkas, A., Ahl, R. 2007. Spatial variability of soil hydrophobicity after fires in Montana and Colorado. Geomorphology 86, 465-479. https://doi.org/10.1016/j.geomorph. 2006.09.015.. Cuadernos de Investigación Geográfica 45 (2), 2019, pp. 601-621. 621.
(22)
Figure

+7

Related documents
AIRWAYS ICPs: integrated care pathways for airway diseases; ARIA: Allergic Rhinitis and its Impact on Asthma; COPD: chronic obstructive pulmonary disease; DG: Directorate General;
The program also offers 20 courses of Bachelor’s Degree in Education to students, namely Curriculum and Pedagogy, Malay Language Education, Islamic Education, TESL,
KEY WORDS : Ship’s routeing and Port zoning Audit Scheme (SPAS), Marine Casualties and Incidents, Marine Accident Investigation, Statistics of Marine Accidents, Human Element
A group of proteins involved in the growth process and actin regulation, comprising Spo20, Bgs4, activated Cdc42, and Crn1, are all concentrated at the growing tip, unlike
The scattergram represents the distribution with age of 69 determinations of concentration of potassium in serum of 39 premature infants with respiratory distress syndrome (Table
Figure 1 shows the effect of pH on the BOD of POME in 21 days. It could be observed that the E. crassipes was able to reduce BOD level at all the four pH conditions studied. The
Figure 6 below shows the graph for different values of network loss v/s the simulation run-time keeping the total number of nodes fixed at 3000..
The present article concerns one of the most topical issues in teaching English as a foreign language (EFL) - assessment, in particular, formative assessment
