Supporting Information
Concomitant Magnetic Memory Effect in CrO2-Cr2O3 Core-Shell Nanorods: Implications
for Thermal Memory Devices
Ashish Chhaganlal Gandhi,1 Tai-Yue Li,1 Jen-Chih Peng,2 Chin-Wei Wang,2 Ting Shan Chan,2
Jauyn Grace Lin,3 and Sheng Yun Wu1,*
1Department of Physics, National Dong Hwa University, Hualien 97401, Taiwan
2National synchrotron radiation research center, Hsinchu 30076, Taiwan
3Center for Condensed Matter Science, National Taiwan University, Taipei 106, Taiwan
S2
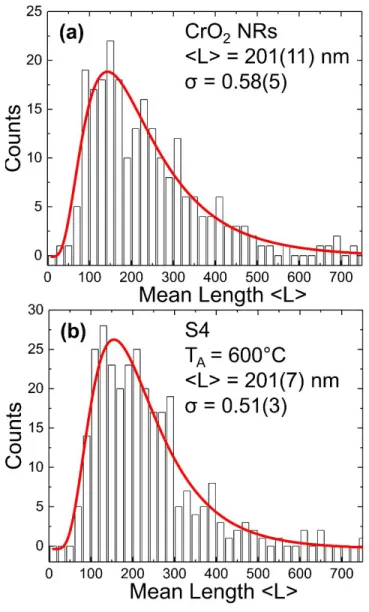
Figure S1 Distribution in mean length <L> with a step of 20 nm of (a) CrO2 and (b) S4 NRs, where
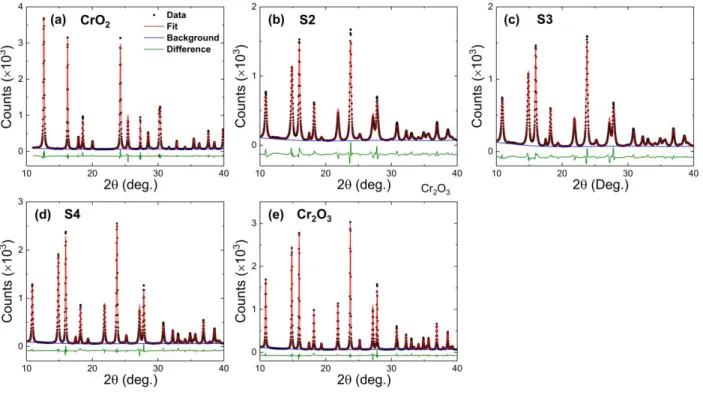
Figure S2 (a)-(e) The best fitted Rietveld refined (red curve) XRPD spectrum (dots) from CrO2,
S2, S3, S4, and Cr2O3 NRs, where green and blue line corresponds to the difference between fitted
S4
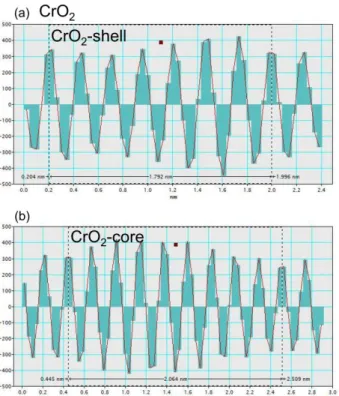
Figure S3 Line-plot representing inter-plane distance d obtained from (a) CrO2-shell, (b) CrO2
Figure S4 shows the temperature dependence of calculated effective g-factors (gi) g𝑖=ℎ𝜈 𝛽𝐻𝑟𝑖 (i
= 1, 2, 3, 4 corresponds to l1, l2, l3, and l4 resonance lines, respectively; stacked vertically, top to bottom) for S1-S4 NRs along with Cr2O3 NRs. We do not analyze the temperature dependency of
line l5 to avoid the complication of analysis. The horizontal dashed lines correspond to g = 2. The g1 (~ 2.6 at 300 K), which was assigned to the CrO2 component, shows increasing behavior with
the decrease of measuring temperature from all CrO2-Cr2O3 NRs, indicating an enhancement of
magnetic interactions. Particularly g1 of S2, S3, and S4 show almost similar value up to 280 K,
whereas slightly higher value with a linear increasing behavior up to 240 K is obtained from S1. However, in the low-temperature region, all NRs are characterized by a slope change. These effects could be correlated to an increase of effective anisotropy resulting in EB coupling at the vicinity of CrO2 and Cr2O3 interface. The g2, which is assigned to theCr2O3 component has avalue close
to ~ 1.98 of Cr2O3 NRs at 300 K for all samples, which is also in excellent agreement with the
previously reported values from Cr3+ ion. However, as the temperature decreases, further line l2 of
samples S4, S3, S2, and S1 disappear at 295 K, 290 K, 270 K, and 250 K, respectively. In the low-temperature region, additional Gaussian (l3) and Lorentzian resonance lines (l4) appear from all samples. The line l3 from S2 (g3 = 2.52), S3 (g3 = 2.05) and S4 (2.12) appears at 290 K, whereas
from S1 at 240 K (g3 = 2.86). On cooling, g3 from all samples have shown an increasing behavior
similar to that of line l1, indicating that spurious line l3 could have been originated from the clusters of Cr4+. Note that the highest value of g
3 is observed from S2. The line l4 from S1 (g4 = 4.12), S2
(g4 = 2.25), S3 (g4 = 1.87) and S4 (g4 = 1.87) appear at 240 K, 260 K, 280 K and 290 K, respectively
which is just below the TN of Cr2O3 phase. Similar to g3, on cooling g4 from S1 has shown a linear
increasing behavior and that from S2 an exponential increasing behavior but with a relatively higher rate. g4 from S3 and S4 has a value close to ~ 1.9 to 2, and it does not show any temperature
S6
dependency, which is the characteristic of free spins, and therefore, it can be assigned to frozen spins.
S8
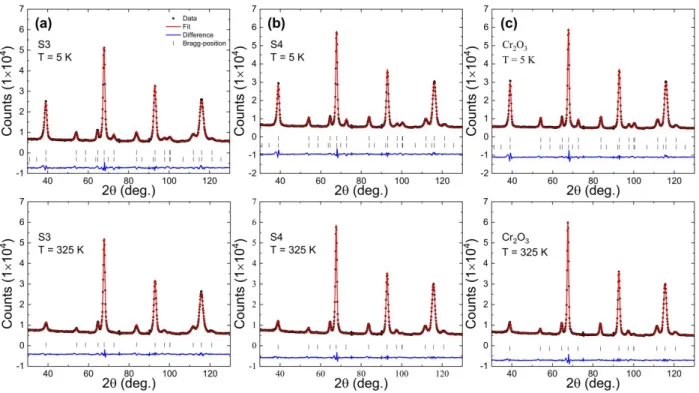
Figure S6 (a)-(c) Rietveld refined (solid red line) NPD spectra (dots) from S3, S4 and Cr2O3 NRs
taken at 5 K (top panel) and 325 K (> TN ~ 308 K) (bottom panel). Vertical lines at the bottom of
the figure represent the Bragg-positions, and the blue line represents the difference between fitted and experimental NPD spectra.
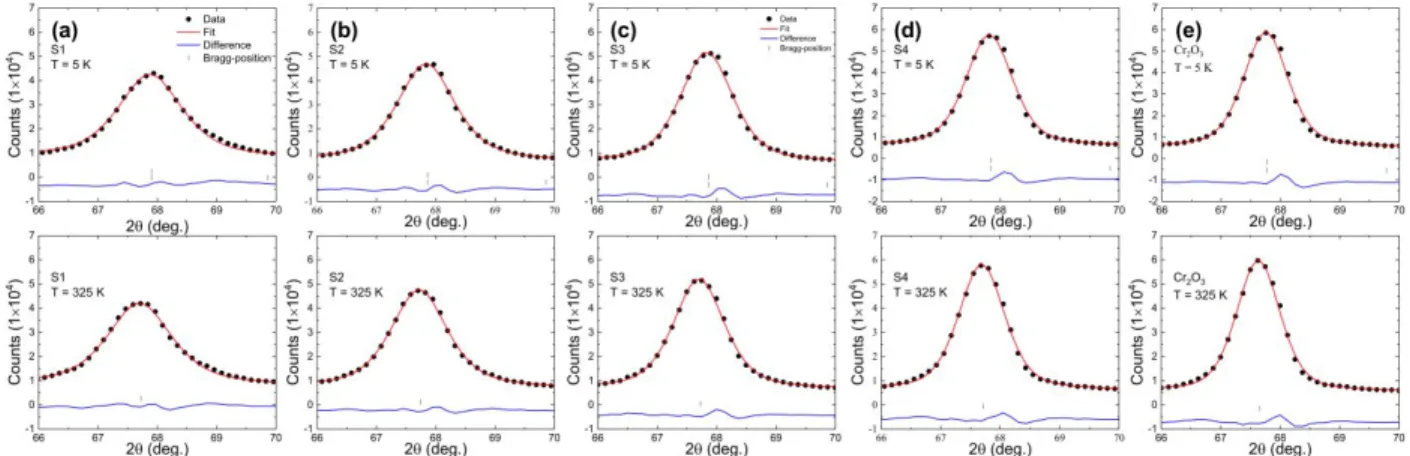
Figure S7 (a)-(e) Zoomed version of Rietveld fitting of NPD spectra of highest intensity peak from S1 to S4 and Cr2O3 NRs taken at 5 K (top panel) and 325 K (bottom panel), respectively.
S10
Figure S8 (a)-(e) Zoomed version of Rietveld fitting of NPD spectra of magnetic sub-phase from S1 to S4 and Cr2O3 NRs taken at 5 K (top panel) and 325 K (bottom panel), respectively.
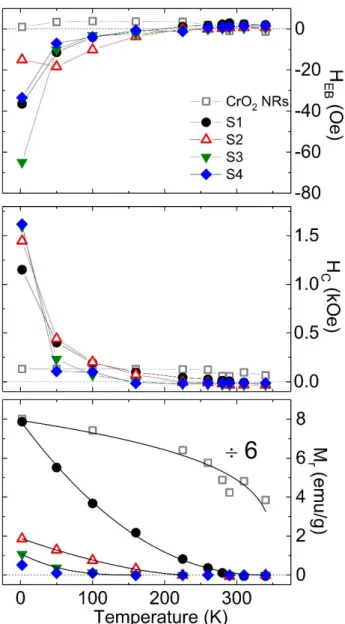
Figure S9 Plot of temperature dependency of HEB, HC, and Mr (top to bottom). where the solid
S12
Figure S10(a)-(b) ZFC-FC M(T) curves obtained from CrO2 and S1 NRs, respectively. (c)-(d)
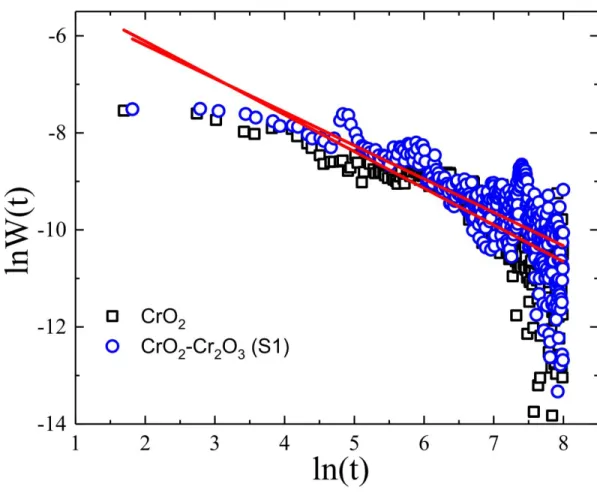
Figure S11 ln(t) dependence of lnW(t) from CrO2 and S1 NRs, where solid line represents a
S14
Figure S12 (a) ZFC magnetic relaxation measured at 20 K with the magnetic field decreasing from 1 kOe to 0 Oe during the temporary cooling to 10 K. (b) FC magnetic relaxation measured at 20 K with the magnetic field increasing from 0 Oe to 1 kOe during the temporary cooling to 10 K. (c) ZFC magnetic relaxation measured at 20 K with a decrease in the temperature to 10 K in 1 kOe field. Inset of (c) shows the continuous increase in magnetization with time at 20 K. (d) Time dependence of ZFC magnetization relaxation measured at 20 K after temperature temporarily warms up to 30 K.
Figure S13(a)-(d) A simulated M(Ha) loop (open symbol) of CrO2, S2, S3, and S4 NRs have been
S16
Table S1 Summary of saturation magnetization Ms at 2 K, mean diameter <d> of NRs and its standard deviation σ, mean length <L> of NRs and its standard deviation σ, calculated values of shell thickness <tCr2O3> and core diameter <d core> using CSSM model discussed in the text.
Sample Ms(2K) (emu/g) <d> (nm) σ <L> (nm) σ <tCr2O3> (nm) <d core> (nm) CrO2 138.02 25.5(7) 0.23(3) 201(11) 0.58(5) 3 19.5 450 18.88 28.5(8) 0.23(3) 10.08 8.33 500 5.52 30.9(7) 0.27(3) 13.06 4.79 550 4.48 33(2) 0.36(12) 14.20 4.60 600 2.06 34.6(5) 0.24(2) 201(7) 0.51(3) 15.67 3.26