DISTINCT STRATEGIES BY BLOOM-FORMING DIATOMS TO FREQUENTLY-ENCOUNTERED SHIFTS IN THEIR ENVIRONMENT
Robert H. Lampe
A thesis submitted to the faculty at the University of North Carolina at Chapel Hill in partial fulfillment of the requirements for the degree of Master of Science in the Department of Marine Sciences in the
College of Arts and Sciences.
Chapel Hill 2018
iii ABSTRACT
Robert H. Lampe: Distinct strategies by bloom-forming diatoms to frequently-encountered shifts in their environment
(Under the direction of Adrian Marchetti)
In the world’s oceans, diatoms perform approximately 40% of the total primary production and are the most prominent group of eukaryotic phytoplankton. Recent advances in diatom genomics are
revealing numerous insights into diatoms’ unique evolution and metabolic adaptations that contribute to their ecological success. Here I present two studies that explore some of these distinct strategies within bloom-forming diatoms in their natural environment by combining environmental transcriptomics with additional measures of diatom physiology. First, the response to upward vertical transport during coastal upwelling events was examined. Diatoms display a distinct transcriptional response that includes
frontloading nitrogen-related genes in order to outcompete other groups. Laboratory-based simulations of upwelling show that this diatom response occurs over relatively short time scales. Secondly, iron storage mechanisms were investigated with iron addition and removal incubations from varying iron
environments. We show that a specific storage mechanism, the protein ferritin, may provide a competitive advantage for ferritin-utilizing diatoms in areas of the world’s oceans that undergo prolonged iron
ACKNOWLEDGEMENTS
I wish to thank my advisor, Dr. Adrian Marchetti, and committee members, Dr. Scott Gifford and Dr. Harvey Seim, for their guidance and support in the completion of this thesis. I would also like to thank my undergraduate research advisor from North Carolina State University, Dr. Astrid Schnetzer, for providing me with an introduction to the wonders of diatom research.
The research in this thesis was supported by many collaborators across several institutions. In particular, Liz Mann (Bigelow), Ben Twining (Bigelow), and Natalie Cohen (UNC) made significant contributions to the work presented in Chapters 1 and 2. Gus Hernandez (UNC) was instrumental in completing Appendix C. Extremely valuable contributions were also made by Ken Bruland (UCSC, Ch. 1 & 2), Mark Brzezinski (UCSB, Ch. 1 & 2), Kelsey Ellis (UNC, Ch. 1), Maite Maldonado (UBC, Ch. 1), Claire Till (HSU, Ch. 1 & 2), and Kim Thamatrakoln (Rutgers, Ch. 1 & 2).
This thesis was also directly supported by a fellowship from the UNC Graduate School and the National Science Foundation via the Graduate Research Fellowship Program (DGE-1650116) and OCE-1334935 (to A.M.). Data presented within this thesis was also funded by National Science Foundation grants OCE-1259776 (to K.B.), OCE-1334387 (to M.B.), OCE-1341479 (to A.M.), OCE-1333929 (to K.T.), OCE-1334632 (to B.T.), and Natural Sciences and Engineering Research Council of Canada (NSERC) grant 261521-13 (to M.M.)
v
TABLE OF CONTENTS
LIST OF TABLES ... viii
LIST OF FIGURES ... ix
LIST OF ABBREVIATIONS... xii
CHAPTER 1: DIVERGENT GENE EXPRESSION AMONG PHYTOPLANKTON TAXA IN RESPONSE TO UPWELLING ... 1
Introduction ... 1
Materials and Methods ... 2
Sample Collection ... 2
Chlorophyll ... 3
Biogenic Silica ... 3
Particulate Carbon, Particulate Nitrogen, and Nitrate Uptake ... 3
Dissolved Inorganic Carbon Uptake ... 4
RNA Extraction and Sequencing ... 4
Metatranscriptome Assembly, Annotation, and Read Quantification ... 5
Differential Expression Analysis ... 5
Data Deposition ... 6
Results and Discussion ... 7
Experimental Overview and Physiological Observations... 7
Taxonomic Composition ... 9
Comparative Gene Expression of Phytoplankton Groups ... 10
Molecular Characterization of the Nitrogen Assimilation Response ... 13
Chaetoceros and Pseudo-nitzschia Expressed Genes ... 16
Conclusions ... 18
CHAPTER 2: DIFFERENT IRON STORAGE STRATEGIES AMONG BLOOM-
FORMING DIATOMS ... 23
Introduction ... 23
Materials and Methods ... 25
Experimental Design ... 25
RNA-Seq Overview ... 26
Synchrotron X-ray Fluorescence (SXRF) Preparation and Analysis ...28
Data Deposition ... 28
Results and Discussion ... 28
Iron States within the Initial Phytoplankton Communities and Incubations ... 28
Taxonomic Distributions ... 31
Iron Quotas among Diatom Genera ... 33
Ferritin Expression in Pseudo-nitzschia and Other Diatoms ... 35
Vacuolar-associated Gene Expression ... 39
Biogeochemical and Ecological Implications ... 41
References ... 44
APPENDIX A: CHAPTER 1 SUPPLEMENTARY INFORMATION ... 48
Materials and Methods ... 48
Text ... 53
Figures ... 56
Tables... 69
References ... 73
APPENDIX B: CHAPTER 2 SUPPLEMENTARY INFORMATION ... 75
Materials and Methods ... 75
Text ... 76
Figures ... 79
Tables... 95
References ... 99
vii
Introduction ... 100
Materials and Methods ... 101
Results and Discussion ... 104
LIST OF TABLES
Table 2.1 – Incubation site identifiers, location, and initial iron conditions ... 26
Table A.1 – Summary of environmental RNA sequencing with Illumina HiSeq 2000... 69
Table A.2 – Summary of transcriptome sequencing, assembly, and gene prediction for isolates from the California Upwelling Zone ... 70
Table A.3 – Summary of functional and taxonomic annotation for the environmental RNA assembly ... 71
Table A.4 – Cell abundances from microscopic counts ... 72
Table B.1 – Time points and initial collection depths for each incubation site ... 95
Table B.2 – Significance test results for differences in site parameters ... 96
Table B.3 – Significance in differential expression of FLDA1 and ISIP3 expression for Thalassiosira and Chaetoceros determined by DESeq2 and shown in Figure B.3 ... 97
ix
LIST OF FIGURES
Figure 1.1 - Measurements from the initial upwelled water and incubations at 72
and 120 hours ... 7 Figure 1.2 – Average taxonomic distribution by mapped reads from each time point ... 9 Figure 1.3 – KEGG Ortholog (KO) gene expression comparison among the four main
detected phytoplankton groups ... 11 Figure 1.4 – Diatom gene expression ... 15 Figure 2.1 – Map of field incubation locations with interpolated statistical means of nitrate
concentrations (µmol L-1) on a 1° grid of all decades from World Ocean Atlas 2013 ... 26
Figure 2.2 - Macronutrient (µmol L-1), size-fractionated chlorophyll a (µg L-1), and
biogenic silica (µmol L-1) concentrations and maximum photochemical yields of
photosystem II (Fv:Fm) from the initial collected seawater (t = 0) and incubations at
various time points ... 30
Figure 2.3 - Differences in relative proportions of taxonomically annotated transcripts between the iron addition and control (Fe-C), control and iron removal (C-DFB), and
iron addition and iron removal (Fe-DFB) at each site ... 32
Figure 2.4 – (a) Cellular iron quotas (µmol Fe:mol C) in Chaetoceros and
Pseudo-nitzschia from incubations. (b) Time course for site C-Low1 ... 33
Figure 2.5 – Pseudo-nitzschia normalized ferritin (FTN) expression for all initial
conditions and incubations ... 36
Figure 2.6 - Heatmap of log2 fold change values for ferritin (FTN),
natural resistance-associated macrophage protein (NRAMP), and ZIP1 expression in
Pseudo-nitzschia, Chaetoceros, and Thalassiosira ... 38 Figure A.1 – Satellite-derived sea surface temperature prior to the incubations ... 56 Figure A.2 – Wind speed (m s-1) and direction from the R/V Melville for the 48 hours
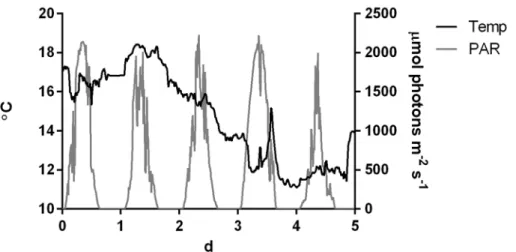
prior to starting the incubations ... 57 Figure A.3 - CTD (conductivity-temperature-depth) measurements ... 58 Figure A.4 - Temperature and on-deck photosynthetically active radiation (PAR) during
the incubations ... 59 Figure A.5 - Biological coefficient of variation (square root of dispersion) for diatom
genes ... 60 Figure A.6 - Additional measurements from the simulated upwelling incubation
experiment ... 61 Figure A.7 - Histograms of KEGG Ortholog (KO) gene expression between 72 and 120
Figure A.9 - Counts and proportions of significantly overrepresented KEGG orthologs
within KEGG module class level two groups at 0 and 72 hours ... 64 Figure A.10 - Heatmap of nitrogen related genes for Chaetoceros, Pseudo-nitzschia,
other diatoms, dinoflagellates, chlorophytes, and haptophytes at 0 and 72 hours ... 65 Figure A.11 - Phylogenetic tree of guanylate cyclase soluble subunit beta (GUCY1B) ... 66 Figure A.12 - Phylogenetic tree of nitrate reductase (NR) in diatoms ... 67 Figure A.13 - Quantitative Metabolic Fingerprint (QMF) depicting relative expression of
KEGG modules for each of the four major phytoplankton groups at each time point. ... 68 Figure B.1 – Bathymetry of the California Upwelling Zone ... 79 Figure B.2 – Molecular indicators of iron stress or limitation in diatoms ... 80 Figure B.2 – Average taxonomic distribution by mapped reads for the whole community
(phylum-based) and diatom genera within all diatom assigned reads ... 81 Figure B.4 – Light and synchrotron X-ray fluorescence micrographs of Chaetoceros
and Pseudo-nitzschia cells from the control and iron (+Fe) incubations at 48 hours at
C-Low1 ... 82 Figure B.5 – Normalized transcript abundances for ferritin (FTN), natural
resistance-associated macrophage protein (NRAMP), and ZIP1 in Pseudo-nitzschia,
Chaetoceros, and Thalassiosira ... 83 Figure B.6 – Phylogenetic tree of Pseudo-nitzschia internal transcribed spacer 1 (ITS1)
sequences with environmental sequences from the metatranscriptome ... 84 Figure B.7 – Phylogenetic tree of Pseudo-nitzschia ferritin sequences with
environmental sequences from the metatranscriptome ... 85 Figure B.8 – Fold changes in Pseudo-nitzschia FTN expression versus fold changes in
iron quotas for the Fe or DFB treatments compared to the control treatment ... 86 Figure B.9 – Midpoint-rooted phylogenetic tree of diatom ferritins ... 87 Figure B.10 – Midpoint-rooted phylogenetic tree of diatom ferritins ... 88 Figure B.11 – Normalized transcript abundances for ferritin (FTN) and natural
resistance-associated macrophage protein (NRAMP) in Fragilariopsis ... 89 Figure B.12 – Phylogenetic tree of natural resistance-associated macrophage protein
(NRAMP) homologous genes ... 90 Figure B.13 – Normalized transcript abundances for ZIP7 in Pseudo-nitzschia,
Chaetoceros, and Thalassiosira ... 91 Figure B.14 – Midpoint-rooted phylogenetic tree of ZIP1 homologous genes ... 92 Figure B.15 – Domoic acid (DA) concentrations from C-Low2 ... 93 Figure B.16 – Three day average of satellite derived sea surface temperature from
xi
Figure C.1 – Conceptual model of the upwelling conveyer belt cycle ... 103 Figure C.2 – Fv:Fm and C:N ratios for C. decipiens and E. huxleyi throughout the UCBC
simulations under iron-replete and iron-stressed conditions ... 105 Figure C.3 – Raw fluorescence units (RFUs) of each sample of C. decipiens and
LIST OF ABBREVIATIONS CUZ California Upwelling Zone
DFB Desferoxamine B
KEGG Kyoto Encyclopedia of Genes and Genomes
KO KEGG Ortholog
RFU Raw fluorescence unit
SXRF Synchrotron X-ray Fluorescence TMC Trace metal clean
1
CHAPTER 1: DIVERGENT GENE EXPRESSION AMONG PHYTOPLANKTON TAXA IN RESPONSE TO UPWELLING
Introduction
Wind-driven coastal upwelling associated with eastern boundary currents delivers rich supplies of nutrients to illuminated surface waters. This phenomenon provides ideal conditions for blooms of phytoplankton that render coastal upwelling regimes centers of new production even though their relative ocean area is small (Capone and Hutchins 2013). Typically dominated by large chain-forming diatoms, phytoplankton blooms in upwelling zones rapidly sequester carbon dioxide and are the base of short, efficient food chains that comprise a significant percentage of the global fish catch (Estrada and Blasco 1985, Lachkar and Gruber 2013, Lassiter et al 2006, Ryther 1969).
The phytoplankton community in upwelling zones is postulated to undergo a ‘conveyer belt cycle’ in which viable cells are upwelled into sunlit waters to seed a surface bloom. The community is then advected away from the upwelled source, and some cells eventually sink out of the photic zone. Surviving cells at depth and positioned in future upwelled waters are able to act as seed stock once winds are favorable for upwelling (Wilkerson and Dugdale 1987, Wilkerson and Dugdale 2008). This continuity between a subsurface population and surface bloom during an upwelling event has been observed through a combination of glider and remote sensing techniques (Seegers et al 2015).
physiological response at a molecular level, however, is lacking. Only upregulation of the nitrogen assimilation gene, nitrate reductase, has been observed in Skeletonema costatum under lab-simulated upwelling conditions, indicating that there is a molecular basis for the shift-up response (Smith et al 1992). Metatranscriptomics is increasingly being applied to eukaryotic phytoplankton communities to provide a deeper understanding of molecular responses among resident phytoplankton groups (Caron et al 2017). With the growing availability of reference transcriptomes and genomes of eukaryotic phytoplankton, unprecedented levels and confidence in gene annotation are being obtained from environmental sequences (Alexander et al 2015, Keeling et al 2014). Here we apply comparative metatranscriptomics to a simulated upwelling event in a shipboard incubation experiment to characterize the phytoplankton community’s response and investigate the molecular basis for shift-up. Our results indicate that phytoplankton functional groups exhibit highly distinct transcriptional responses to being upwelled in which diatoms constitutively express genes involved in nitrogen assimilation. This strategy possibly allows diatoms to outcompete other groups for available nitrogen once physical conditions are optimal for growth.
Materials and Methods Sample Collection
3 throughout the incubation are provided in Figure A.4.
Based on macronutrient drawdown, triplicate cubitainer were harvested following 72 hours and 120 hours of incubation. Subsamples from each cubitainer were preserved or measured for chlorophyll a, species composition (by microscopy and FlowCAM), biogenic silica, Fv:Fm, domoic acid, nutrients,
particulate carbon and nitrogen, carbon and nitrogen uptake, and RNA. Chlorophyll a, particulate carbon and nitrogen, and nitrate uptake rates were size fractionated using a series filter cascade. Carbon uptake rates were size fractionated using a mesh spacer. Additional methods are described in Appendix A.
Chlorophyll
Four hundred mL of seawater was gravity-filtered through a 5 µm polycarbonate filter (47 mm) followed by a GF/F filter (25 mm) under gentle vacuum pressure (<100 mm Hg). Filters were rinsed with 0.45 µm filtered seawater and immediately frozen at -80°C until analysis. Chlorophyll a extraction was performed using 90% acetone at -20°C for 24 h and measured via in vitro fluorometry on a 10-AU fluorometer (Turner Designs, San Jose, CA, USA) using the acidification method (Parsons et al 1984).
Biogenic Silica
Biogenic silica was determined via filtration of 335 mL onto 1.2 µm polycarbonate filters (45 mm). Concentrations were measuring using a NaOH digestion in teflon tubes (Krause et al 2009) and a colorimetric ammonium molybdate method (Brzezinski and Nelson 1995).
Particulate Carbon, Particulate Nitrogen, and Nitrate Uptake
Particulate nitrogen (PN), carbon (PC) and nitrate (NO3-) uptake was obtained by spiking 618 mL
of seawater with 15N-NaNO3 at no more than 10% of ambient nitrate concentration and incubating for 8
wrapped in tin capsules, and pelletized in preparation for analysis of the atom % 15N, PN, and PC using an
elemental analyzer paired with an isotope ratio mass spectrometer (EA-IRMS). Absolute uptake rates (ρ,
NO3 taken up per unit time) were calculated using a constant transport model (Eq. (3) from Dugdale and
Wilkerson (1986)). Biomass-specific NO3 uptake rates (V, NO3 taken up per unit PN per unit time) were
also calculated according to the constant specific uptake model (Eq. (6) Dugdale and Wilkerson (1986)).
15NO3 uptake rates were not corrected for possible losses of 15N in the form of dissolved organic nitrogen
(Bronk et al 1994); therefore, the reported values are considered conservative estimates or net uptake.
Dissolved Inorganic Carbon Uptake
Sixty mL samples from each cubitainer were distributed into light and dark bottles cleaned with 1.2 mol L-1 HCl. For each bottle, 1.2 µCi of NaH14CO
3 was added and mixed. A 1 mL subsample was taken
and added to vials containing 6 mol L-1 NaOH to trap and validate the initial inorganic H14CO3 quantities.
The light and dark bottles were incubated on-deck for 6.5-8 hours. Samples were filtered onto stacked polycarbonate filters (5 µm and 1 µm) separated with a mesh spacer. Blank control bottles also containing 1.2 µCi of NaH14CO
3 were filtered onto a GF/F filter after 5 minutes and had counts similar to dark bottles.
Filters were vacuumed dried, placed in scintillation vials with 0.5 Ml of 6 mol L-1 HCl, permitted to degas for
24 hours, and counted using a Beckman Coulter LS 6500 scintillation counter. Reported values are light bottles minus dark bottles. Biomass-specific dissolved inorganic carbon (DIC) uptake rates (VDIC) were calculated by normalizing DIC uptake to PC.
RNA Extraction and Sequencing
5
for the second time point (T120). Library prep was conducted with the Illumina TruSeq Stranded mRNA Library Preparation Kit and HiSeq v4 reagents. Sequencing of barcoded samples was performed on an Illumina HiSeq 2000 (125bp, paired-end).
Metatranscriptome Assembly, Annotation, and Read Quantification
Reads were trimmed for quality and adapter removal using Trimmomatic v0.32 (paired-end mode, adaptive quality trim with 40 bp target length and strictness of 0.6, minimum length of 36 bp; Bolger et al 2014). Trimmed paired reads that overlap were merged into single reads with BBMerge v8.0. Merged pairs and non-overlapping paired-end reads were then used to assemble contigs using AbySS v1.5.2 with varied k-mer sizes (Birol et al 2009). Assemblies were merged using Trans-AbySS v1.5.3 to remove redundant contigs (Robertson et al 2010), and those shorter than 125 bp were discarded. Read counts were obtained by mapping raw reads to contigs with Bowtie2 v2.2.6 (Langmead and Salzberg 2012) and filtered by mapping quality with SAMtools v1.2 (Li et al 2009). Mapping percentages are provided in Table A.1.
Annotation was assigned by best homology (lowest E-value) to protein databases using BLASTX v2.2.31 (E-value ≤ 10-5). For taxonomic identification, MarineRefII, a custom reference database was used.
MarineRefII contains predicted protein sequences of marine microbial eukaryotes and prokaroytes including all sequenced transcriptomes from the Marine Microbial Eukaryote Transcriptome Sequencing Project (Keeling et al 2014). MarineRefII was supplemented with transcriptomes of isolated phytoplankton from these incubations adding increased confidence in the taxonomic annotation of some contigs (Table A.2). To assign gene function to contigs, the same methodology with the Kyoto Encyclopedia of Genes and Genomes (KEGG; Release 75) was used (Kanehisa et al 2017). The best hit with a KEGG Ortholog (KO) number from the top 10 hits was chosen. Similarly, analysis of module annotations (MO) was conducted by selecting the top BLASTX hit with a KEGG MO number from the top 10 hits. A summary of annotation results is provided in Table A.3.
Differential Expression Analysis
Definition or KEGG Orthology (KO) annotation. EdgeR v3.12.0 was used to calculate normalized fold change and counts-per-million (CPM) from pairwise comparisons within each taxonomic group using the exactTest function (Robinson and Smyth 2008, Robinson et al 2010). Significance (P-value < 0.05) was calculated by using edgeR’s estimate of tagwise dispersions utilizing the available replication of all treatments from the second time point (T120; Figure A.5; Chen et al 2014). ExactTest output in combination with the taxonomic distributions per gene were plotted using a custom plotting function available at https://github.com/marchettilab/mantaPlot.
Shared expression of gene was considered when a gene was detected in at least one of the libraries under comparison for each taxonomic group. For binning of genes displayed in heatmaps, a positive or negativefold change, variance greater than the number of taxonomic groups, and fold change greater than or less than all other groups were used. Genes with a log2 fold change greater than 2 or less
than -2 but had a variance less than the number of taxonomic groups were considered similarly overrepresented by all groups. Otherwise, the expression level was considered similar on the basis of fold change. These data were visualized with pheatmap v1.0.8.
Data Deposition
7
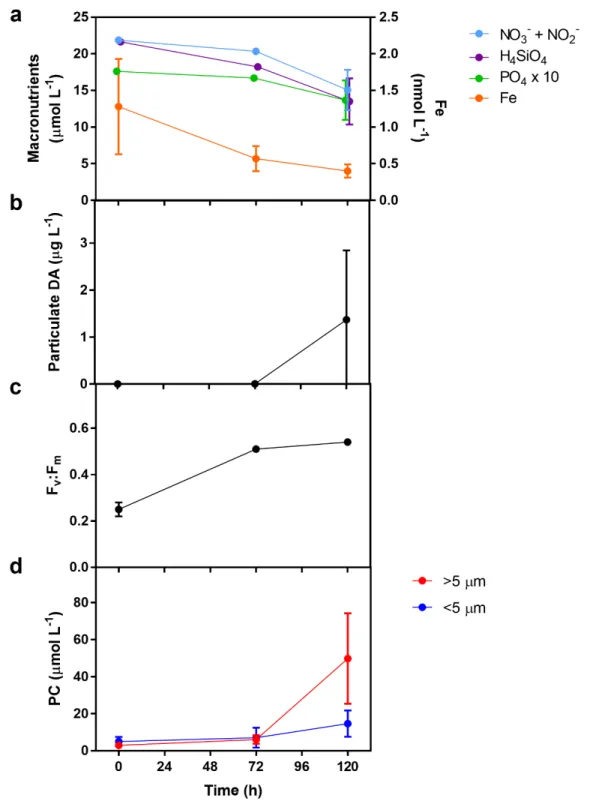
Figure 1.1 - Measurements from the initial upwelled water and incubations at 72 and 120 hours: >5 µm (red) and <5 µm (blue). (A) Chlorophyll a (closed circles), particulate nitrogen (open circles), and biogenic silica (green). (B) Primary productivity expressed as inorganic carbon uptake (µmol C L-1 d-1). (C)
Absolute nitrate (NO3-) uptake rates (ρ, NO3- taken up per unit time). (D) Ratios of particulate carbon to
particulate nitrogen. (E) Biomass-specific dissolved inorganic carbon uptake rates (VDIC), i.e. inorganic
carbon uptake normalized to biomass as particulate carbon (µmol C L-1 d-1 / µmol C L-1 or d-1) (F)
Biomass-specific nitrate uptake rates (VNO3), i.e. nitrate uptake rates normalized to biomass as particulate
nitrogen (µmol N L-1 d-1 / µmol N L-1 or d-1). Error bars indicate standard deviation of the mean (n = 3).
Results and Discussion
Experimental Overview and Physiological Observations
Results from the simulated upwelling experiment indicate that a bloom of large phytoplankton (>5 µm) was induced with observations of shift-up in terms of growth, primary production, and nitrate uptake within these large cells. Macronutrient concentrations in the upwelled waters remained high throughout the incubations; however, significant growth in the large (>5 µm) phytoplankton community was observed (Figure 1.1a and Figure A.6a). The initial dissolved iron concentration was approximately 1.28 nmol L-1
which is marginally higher than the normal values (<1 nmol L-1) observed in the region. For complete
drawdown of nitrate, an iron to nitrate ratio of 8 nmol L-1:20 µmol L-1 is typically required (Bruland et al
2001). The initial ratio of 1.28 nmol L-1:21.86 µmol L-1 in the incubations therefore indicates that iron had
the potential to be a limiting nutrient which resulted in 15 µmol L-1 of unused nitrate after 120 hours.
domoic acid also suggests a considerable presence of the diatom genus Pseudo-nitzschia (Lelong et al 2012). Concentrations were below the detection limit until 120 hours when the average concentration was 1.34 µg L-1 (Figure A.6b). Although this concentration is lower than peak concentrations observed during
blooms in California coastal waters (Schnetzer et al 2013), it nevertheless indicates that Pseudo-nitzschia spp. were abundant within the incubations by 120 hours.
This success of large phytoplankton is consistent with previous studies showing phytoplankton from large size fractions as the significant contributors to growth and new production during upwelling. Large phytoplankton consistently have greater increases in biomass and outcompete small cells for nutrients during a bloom (Fawcett and Ward 2011, Wilkerson et al 2000). These large phytoplankton are commonly characterized as chain-forming colonial diatoms such as Chaetoceros spp. but include Pseudo-nitzschia spp. (Estrada and Blasco 1985, Lassiter et al 2006).
The large phytoplankton community also exhibited clear physiological responses to being upwelled. Maximum photochemical yields (Fv:Fm) of the whole community increased from 0.25 to 0.51 within the first
72 hours (Figure A.6c). Dissolved inorganic carbon and nitrate uptake in the large cells increased throughout the experiment and was significantly higher than the small cells (Figures 1.1b, 1.1c). The particulate carbon-to-nitrogen ratio (C:N) was initially 31.5:1 in the >5 µm size fraction but decreased to approach the expected elemental composition of 6.6:1 (Redfield et al 1963), while C:N values remained fairly constant and above the Redfield ratio for the small size fraction (Figure 1.1d). This return to Redfield stoichiometry for the larger community was coupled with increasing biomass-specific NO3- uptake rates
(VNO3) that were approximately double that of biomass-specific carbon uptake rates (VDIC) (Figures 1.1e,
1.1f).
These data are also a clear indication of a positive response from light limitation, or potentially a resting stage, to high growth for the larger phytoplankton. The initial low Fv:Fm signifies that the community
9
phytoplankton controlling the total C:N as time progresses. It is also possible that there was C-rich detrital material elevating the initial measurement (Fawcett and Ward 2011), but acceleration of nitrate uptake, especially in relation to carbon uptake, to drive the community toward the Redfield-predicated ratio is clear. The larger cells are able to take advantage of nitrate as conditions become optimal and dominate the community since they uptake nitrate at higher rates than the smaller cells.
Figure 1.2 - Average taxonomic distribution by mapped reads from each time point. (A) Percentage of reads from the whole community. (B) Percentage of reads for diatom genera within all reads assigned as diatoms.
Taxonomic Composition
suggests that dinoflagellates were the dominant phytoplankton group although microscopic cell counts suggest chlorophytes may have been more abundant. Satellite-derived sea surface temperature and ship-board wind data indicate that upwelling-favorable conditions were not present for 13 days before the incubations (Figures A.1, A.2). Although multiple factors contribute to the residence time of cells at depth, these data suggest an upper limit of 13 days prior to sampling. By 72 and 120 hours following incubation, there was an overwhelming increase in the abundance of mRNA reads attributable to diatoms (Figure 1.2a) consistent with the bulk measurements, FlowCAM, and previous studies (Estrada and Blasco 1985): diatoms were unequivocally the dominant group within the simulated upwelling event.
The taxonomic composition of diatoms followed a similar trend as the whole community with an initially more diverse diatom community that transitioned into one dominated by just two genera: Chaetoceros and Pseudo-nitzschia (Figure 1.2b). Chaetoceros appeared to make rapid early gains but the community became mostly Pseudo-nitzschia by 120 hours. These two genera were also dominant within a previous mesocosm experiment examining shift-up at a nearby coastal California site (Kudela and Dugdale 2000). Chaetoceros spp. were found as resting spores and may quickly germinate following upwelling to make early gains in cell abundance (Pitcher 1990). Although a resting stage for Pseudo-nitzschia spp. is not known (Lelong et al 2012), they are significant members of the phytoplankton community throughout the upwelling cycle and dominated after 120 hours consistent with a peak in the Pseudo-nitzschia produced toxin, domoic acid (Figure A.6b). The presence of Pseudo-nitzschia is unsurprising considering the reports that members of this genus often dominate subsurface chlorophyll maxima (Ryan et al 2005), thin layers (McManus et al 2008, Rines et al 2002), and upwelled communities (Seegers et al 2015) that often result in harmful algal blooms in this region.
Comparative Gene Expression of Phytoplankton Groups
11
opposite pattern with gene expression skewed towards overrepresentation in the pre-upwelled condition while haptophytes had an even distribution of overrepresented genes in both phases. Interestingly, chlorophytes also had a higher number of significantly overrepresented genes post-upwelling, and they were able to maintain their relative proportion of the overall transcript pool unlike the dinoflagellates and haptophytes.
Figure 1.3 - KEGG Ortholog (KO) gene expression comparison among the four main detected phytoplankton groups: diatoms (blue), dinoflagellates (red), chlorophytes (green), and haptophytes (orange). (A) Histograms of KO counts binned by log2 fold change intervals of 1 for 0 and 72 hours.
Dashed vertical lines indicate a log2 fold change of -1 or 1. The number and percentage of only the
significantly (P-value < 0.05) overrepresented genes at 0 hours (pre-upwelling; left) and 72 hours (post-upwelling; right) are annotated on each plot. (B) Venn diagram of expressed KOs at 72 and 0 hours for each group. (C) Heatmap for the 1,476 commonly expressed KOs at 0 and 72 hours. Each row indicates an expressed KO with darker red (positive fold change) indicating overrepresentation at 72 hours and darker blue (negative fold change) indicating overrepresentation at 0 hours.
the first 72 hours. This timing and slowing of response also corresponds to field observations that predict a 5-7 day window for cells to achieve balanced growth and transition from shift-up to a low nutrient shift-down (Dugdale and Wilkerson 1989, Wilkerson et al 2006). It has been speculated that these shifts, or variable transcript allocation, are a reflection of r- and K-type growth strategies (Alexander et al 2015). Our observations appear to follow this paradigm with diatoms exhibiting r-type growth and the highest transcript reallocation in terms of gene count.
Analysis of the expression of genes with shared KEGG Orthology (KO) annotation allows for direct comparisons between taxonomic groups as orthologs normally retain the same function throughout evolutionary history. Similar or different expression of a gene among groups may signify correspondingly similar or different investments in cellular processes at given time points. We detected 1,476 orthologous genes expressed by all four taxonomic groups at 0 or 72 hours (Figures 1.3b, 1.3c). Only 18 genes were binned as highly overrepresented at 72 hours by all four phytoplankton groups, of which many were related to chlorophyll synthesis. Over 550 genes had low absolute fold change values, many of them positive, across all four groups. These included more photosynthesis-related genes such as photosystem II constituents, photosynthesis electron transport proteins, light-harvesting chlorophyll protein complex proteins, and most of the genes associated with the Calvin cycle. The shared expression of these genes across groups is unsurprising considering the community is transitioning from a deep and dark environment to a sunlit environment, and would benefit from investing in photosynthetic machinery. Other genes that were highly expressed but showed little change in expression across all four groups were associated with other predictable cellular functions such as ribosomal proteins, translation initiation factors, and all constituents of the citric acid cycle.
13
interpreted as investments in different metabolic processes (Figure A.9). These unique responses may reflect fundamental differences in life strategies and ecological traits among functional groups.
To further explain the dominance of diatoms in these systems, expression of diatom annotated genes was investigated. 1,132 KOs were found solely in diatoms, likely due to the abundance of diatoms in our samples resulting in an improved metatranscriptome assembly for that group (Figure 1.3b). However, only 173 of these KOs were significantly overrepresented at either 0 or 72 h. It is difficult to determine the importance of the remaining genes that were expressed in low abundances.
Diatom taxa, however, were not found to respond equivalently to being upwelled; clear differences were noted between Chaetoceros, Pseudo-nitzschia, and other diatoms (Figure 1.4a). Expression of 2,807 orthologs was detected in the genera Chaetoceros, Pseudo-nitzschia, and all other diatom genera combined mostly consisting of Thalassiosira. Similar to what was observed for major taxonomic groups, there was large overrepresentation of distinct sets of genes, particularly in Chaetoceros spp., also potentially reflecting transcriptional investments in different processes at different times.
Eighty-five genes showed significantly opposite fold-changes in Chaetoceros and Pseudo-nitzschia when compared to other diatoms. This highlights that gene expression may not be as accurately assessed by combining genes at high level taxonomic groupings as done in previous metatranscriptomics studies (Alexander et al 2015, Bertrand et al 2015). The high expression of a gene at one time point or treatment by one group may be cancelled out by another group with opposing expression leading to the incorrect conclusion for the group as a whole. Additionally, one genus could be driving expression of many genes rather than being distributed across the entire group.
Molecular Characterization of the Nitrogen Assimilation Response
1.4c). The only constitutively and highly expressed nitrogen-related gene by other groups was glutamine synthetase within dinoflagellates and haptophytes. Within diatoms, the nitrate assimilation genes all had a positive fold change suggesting slightly greater abundance of these genes post-upwelling when compared to pre-upwelling matching our observations of increased nitrate uptake at 72 and 120 hours (Figures 1.1c, 1.1f). The change in expression in nitrate reductase was very low which contrasts a simulated upwelling experiment with a Skeletonema species (Smith et al 1992). Skeletonema, however, was not found to be an abundant genus within this study, and this variation further highlights potential genera-specific differences in the upwelling response.
The urea cycle is believed to facilitate recovery from prolonged nitrogen limitation for diatoms (Allen et al 2011), but may also be important for the shift-up response. The urea cycle genes carbamoyl-phosphate synthetase and argininosuccinate synthase were also frontloaded by diatoms (Figures 1.4b, 1.4c, and A.10). Several others were significantly overrepresented post-upwelling including ornithine carbamoyltransferase, arginosuccinate lyase, and urease. The exception in diatoms was arginase, the final enzyme in the urea cycle which was significantly overrepresented pre-upwelling by diatoms not including Chaetoceros (Figure A.10). Low expression of arginase post-upwelling is similar to the diatom response to iron enrichment (Marchetti et al 2012) and may suggest that in both of these scenarios, there are alternative fates for urea cycle intermediates such as nitrogen storage or silica precipitation (Kröger et al 2001, Llácer et al 2008).
15
Figure 1.4 - Diatom gene expression. (A) Heatmap for the 2,807 commonly expressed KOs at 0 and 72 hours for Chaetoceros, Pseudo-nitzschia, and all other diatoms. Each row indicates an expressed KO with darker red (positive fold change) indicating overrepresentation at 72 hours and darker blue (negative fold change) indicating overrepresentation at 0 hours. (B) MA plot of nitrogen-related genes for the four main detected phytoplankton groups: diatoms (blue), dinoflagellates (red), chlorophytes (green), and haptophytes (orange). Genes are grouped into clusters using k-means clustering with confidence ellipses at the 90% level. Select genes are labelled within clusters that represent the most highly frontloaded genes (black ellipse) and additional frontloaded genes (medium gray ellipse). These are labelled as follows: NRT, nitrate transporter; GLNA, glutamine synthetase; NR, nitrate reductase; AMT, ammonium transporter; NIRA, nitrite reductase (ferredoxin); ASSY, arginosuccinate synthase; CPS, carbamoyl-phosphate synthetase; OTC, ornithine carbamoyltransferase; ASL, argininosuccinate lysase; URE, urease, ARG, arginase. (C) Cell schematic depicting frontloading of genes associated with nitrogen assimilation and utilization for diatoms. The model is based on Alexander et al. (2015a) and utilizes the same KO numbers. Color indicates the average abundance of the genes (log2 CPM) minus the absolute
value of the log2 fold change to highlight the most abundant, lowest change (i.e., frontloaded) genes.
abundance between 0 and 72 hours for Chaetoceros (red) and Pseudo-nitzschia (blue) for expressed KEGG Orthologs (KO). Each pie represents a KO and increases in size with absolute values of its coordinates to optimize visibility. Gene circles that are shaded and have grey borders are not significantly represented in either library (P-value ≥ 0.05). Select gene names discussed in the text are labeled as follows: CHSY, chondroitin sulfate synthase; FTN, ferritin; GUCY1B, guanylate cyclase soluble subunit beta; HERC1, ubiquitin-protein ligase; MRT4; mRNA turnover protein, POT1, protection of telomeres protein 1; PRKG1, cGMP-dependent protein kinase 1; SOD, superoxide dismutases.
This transcriptionally proactive approach to abiotic changes, termed ‘frontloading’, has been characterized with environmental stress response genes in coral and yeast (Barshis et al 2013, Berry and Gasch 2008). It is also similar to what has been observed in diatoms within a previous metatranscriptomics study in relation to iron stress. Iron-enrichment experiments in the northeastern Pacific Ocean demonstrated oceanic diatoms continued expressing genes encoding for iron-free photosynthetic proteins rather than substituting genes encoding for iron-containing functionally equivalent proteins which was in contrast to other phytoplankton groups (Cohen et al 2017, Marchetti et al 2012). This strategy is speculated to provide oceanic diatoms with the ability to rapidly acclimate to the inevitable return to iron-limited conditions just as our observations show a strategy that provides certain diatoms with the ability to rapidly take up nitrogen following upwelling. Constitutive frontloading is suggested to provide organisms with resilience to such stressors (Barshis et al 2013). Along similar lines, bloom-forming diatoms such as Chaetoceros and Pseudo-nitzschia may have evolved to frontload transcripts of particular genes depending on frequently encountered environmental fluctuations such as conditions associated with the upwelling conveyor belt cycle rather than simply reactively responding to these changes.
Chaetoceros and Pseudo-nitzschia Expressed Genes
Analyzing genes assigned to two of the most dominant diatom genera, Chaetoceros and Pseudo-nitzschia, provides further insight into the molecular mechanisms these genera use at depth and as part of their shift-up response. From KOs with module annotations, it is evident that the significantly overrepresented genes at both time points fall into a diverse set of functional categories even at a high-level grouping (Figure A.9). To obtain finer resolution, gene expression among all KOs for these genera was examined.
17
1998), and TEP production, suggest that diatoms are responding to stress (Figure 1.4d; Appendix A). Pseudo-nitzchia in particular expressed a set of distinctive genes as part of its shift-up response. Ferritin was highly expressed post-upwelling, possibly providing a method of storing the essential micronutrient iron. As iron availability in the California upwelling regime can be sporadic and potentially growth limiting, ferritin may provide an advantage to Pseudo-nitzschia by concentrating iron for longer-term storage (Bruland et al 2001, Marchetti et al 2009) although it may also be used for iron homeostasis (Pfaffen et al 2015).
Conclusions
19 REFERENCES
Alexander H, Rouco M, Haley ST, Wilson ST, Karl DM, Dyhrman ST (2015). Functional group-specific traits drive phytoplankton dynamics in the oligotrophic ocean. P Natl Acad Sci USA 112: E5972-E5979. Allen AE, Dupont CL, Obornik M, Horak A, Nunes-Nesi A, McCrow JP et al (2011). Evolution and metabolic significance of the urea cycle in photosynthetic diatoms. Nature 473: 203-207.
Amin SA, Parker MS, Armbrust EV (2012). Interactions between Diatoms and Bacteria. Microbiol Mol Biol R 76: 667-684.
Barshis DJ, Ladner JT, Oliver TA, Seneca FO, Traylor-Knowles N, Palumbi SR (2013). Genomic basis for coral resilience to climate change. P Natl Acad Sci USA 110: 1387-1392.
Basu S, Patil S, Mapleson D, Russo MT, Vitale L, Fevola C et al (2017). Finding a partner in the ocean: molecular and evolutionary bases of the response to sexual cues in a planktonic diatom. New Phytologist 215: 140-156.
Berry DB, Gasch AP (2008). Stress-activated Genomic Expression Changes Serve a Preparative Role for Impending Stress in Yeast. Mol Biol Cell 19: 4580-4587.
Bertrand EM, McCrow JP, Moustafa A, Zheng H, McQuaid JB, Delmont TO et al (2015). Phytoplankton– bacterial interactions mediate micronutrient colimitation at the coastal Antarctic sea ice edge. P Natl Acad Sci USA 112: 9938-9943.
Birol I, Jackman SD, Nielsen CB, Qian JQ, Varhol R, Stazyk G et al (2009). De novo transcriptome assembly with AbySS. Bioinformatics 25: 2872-2877.
Bolger AM, Lohse M, Usadel B (2014). Trimmomatic: A flexible trimmer for Illumina Sequence Data. Bioinformatics 30: 2114-2120.
Bronk DA, Glibert PM, Ward BB (1994). Nitrogen Uptake, Dissolved Organic Nitrogen Release, and New Production. Science 265: 1843-1846.
Bruland KW, Rue EL, Smith GJ (2001). Iron and macronutrients in California coastal upwelling regimes: Implications for diatom blooms. Limnol Oceanogr 46: 1661-1674.
Brzezinski MA, Nelson DM (1995). The annual silica cycle in the Sargasso Sea near Bermuda. Deep-Sea Res Pt I 42: 1215-1237.
Capone DG, Hutchins DA (2013). Microbial biogeochemistry of coastal upwelling regimes in a changing ocean. Nature Geosci 6: 711-717.
Caron DA, Alexander H, Allen AE, Archibald JM, Armbrust EV, Bachy C et al (2017). Probing the evolution, ecology and physiology of marine protists using transcriptomics. Nat Rev Micro 15: 6-20. Chen Y, Lun A, Smyth G (2014). Differential expression analysis of complex RNA-seq experiments using edgeR. In: Datta S, Nettleton DS (eds). Statistical Analysis of Next Generation Sequence Data. Springer: New York.
Denninger JW, Marletta MA (1999). Guanylate cyclase and the ⋅NO/cGMP signaling pathway. BBA-Bioenergetics 1411: 334-350.
Di Dato V, Musacchia F, Petrosino G, Patil S, Montresor M, Sanges R et al (2015). Transcriptome sequencing of three Pseudo-nitzschia species reveals comparable gene sets and the presence of Nitric Oxide Synthase genes in diatoms. Sci Rep 5: 12329.
Dugdale RC, Wilkerson FP (1986). The use of 15N to measure nitrogen uptake in eutrophic oceans; experimental considerations. Limnol Oceanogr 31: 673-689.
Dugdale RC, Wilkerson FP (1989). New production in the upwelling center at Point Conception, California: temporal and spatial patterns. Deep-Sea Res 36: 985-1007.
Estrada M, Blasco D (1985). Phytoplankton assemblages in coastal upwelling areas. In: Bas C, Margalef R, Rubies P (eds). International Symposium on the Most Important Upwelling Areas off Western Africa: Barcelona. Pp 379-402.
Fawcett S, Ward B (2011). Phytoplankton succession and nitrogen utilization during the development of an upwelling bloom. Mar Ecol-Prog Ser 428: 13-31.
Fridovich I (1998). Oxygen toxicity: a radical explanation. J Exp Biol 201: 1203-1209.
Kanehisa M, Furumichi M, Tanabe M, Sato Y, Morishima K (2017). KEGG: new perspectives on genomes, pathways, diseases and drugs. Nucleic Acids Res 45: D353-D361.
Keeling PJ, Burki F, Wilcox HM, Allam B, Allen EE, Amaral-Zettler LA et al (2014). The Marine Microbial Eukaryote Transcriptome Sequencing Project (MMETSP): Illuminating the Functional Diversity of Eukaryotic Life in the Oceans through Transcriptome Sequencing. PloS Biol 12: e1001889.
Krause JW, Nelson DM, Lomas MW (2009). Biogeochemical responses to late-winter storms in the Sargasso Sea, II: Increased rates of biogenic silica production and export. Deep-Sea Res Pt I 56: 861-874.
Kröger N, Deutzmann R, Sumper M (2001). Silica-precipitating Peptides from Diatoms: The Chemical Structure of Silaffin-1A from Cylindrotheca Fusiformis. J Biol Chem 276: 26066-26070.
Kudela RM, Dugdale RC (2000). Nutrient regulation of phytoplankton productivity in Monterey Bay, California. Deep-Sea Res Pt II 47: 1023-1053.
Lachkar Z, Gruber N (2013). Response of biological production and air–sea CO2 fluxes to upwelling intensification in the California and Canary Current Systems. J Marine Syst 109–110: 149-160. Langmead B, Salzberg SL (2012). Fast gapped-read alignment with Bowtie 2. Nat Meth 9: 357-359. Lassiter AM, Wilkerson FP, Dugdale RC, Hogue VE (2006). Phytoplankton assemblages in the CoOP-WEST coastal upwelling area. Deep-Sea Res Pt II 53: 3063-3077.
Lelong A, Hégaret H, Soudant P, Bates SS (2012). Pseudo-nitzschia (Bacillariophyceae) species, domoic acid and amnesic shellfish poisoning: revisiting previous paradigms. Phycologia 51: 168-216.
Li H, Handsaker B, Wysoker A, Fennell T, Ruan J, Homer N et al (2009). The Sequence Alignment/Map format and SAMtools. Bioinformatics 25: 2078-2079.
21
MacIsaac JJ, Dugdale RC, Barber RT, Blasco D, Packard TT (1985). Primary production cycle in an upwelling center. Deep-Sea Res 32: 503-529.
Marchetti A, Parker MS, Moccia LP, Lin EO, Arrieta AL, Ribalet F et al (2009). Ferritin is used for iron storage in bloom-forming marine pennate diatoms. Nature 457: 467-470.
Marchetti A, Schruth DM, Durkin CA, Parker MS, Kodner RB, Berthiaume CT et al (2012). Comparative metatranscriptomics identifies molecular bases for the physiological responses of phytoplankton to varying iron availability. P Natl Acad Sci USA 109: E317-E325.
McManus MA, Kudela RM, Silver MW, Steward GF, Donaghay PL, Sullivan JM (2008). Cryptic Blooms: Are Thin Layers the Missing Connection? Estuar Coast 31: 396-401.
Parsons TR, Maita Y, Lalli CM (1984). A Manual of Chemical & Biological Methods for Seawater Analysis. Pergamon: Amsterdam.
Pfaffen S, Bradley JM, Abdulqadir R, Firme MR, Moore GR, Le Brun NE et al (2015). A Diatom Ferritin Optimized for Iron Oxidation but not Iron Storage. J Biol Chem. 290: 28416-28427.
Pitcher GC (1990). Phytoplankton seed populations of the Cape Peninsula upwelling plume, with particular reference to resting spores of Chaetoceros (bacillariophyceae) and their role in seeding upwelling waters. Estuar Coast Shelf S 31: 283-301.
Redfield AC, Ketchum BH, Richards FA (1963). The influence of organisms on the composition of sea water. In: Hill M (ed). The Sea. Interscience: New York. Pp 26-77.
Rines JEB, Donaghay PL, Dekshenieks MM, Sullivan JM, Twardowski MS (2002). Thin layers and camouflage: hidden Pseudo-nitzschia spp. (Bacillariophyceae) populations in a fjord in the San Juan Islands, Washington, USA. Mar Ecol-Prog Ser 225: 123-137.
Robertson G, Schein J, Chiu R, Corbett R, Field M, Jackman SD et al (2010). De novo assembly and analysis of RNA-seq data. Nat Meth 7: 909-912.
Robinson MD, Smyth GK (2008). Small-sample estimation of negative binomial dispersion, with applications to SAGE data. Biostatistics 9: 321-332.
Robinson MD, McCarthy DJ, Smyth GK (2010). EdgeR: a Bioconductor package for differential expression analysis of digital gene expression data. Bioinformatics 26: 139-140.
Ryan JP, Chavez FP, Bellingham JG (2005). Physical-biological coupling in Monterey Bay, California: topographic influences on phytoplankton ecology. Mar Ecol-Prog Ser 287: 23-32.
Ryther JH (1969). Photosynthesis and Fish Production in the Sea. Science 166: 72-76.
Sakihama Y, Nakamura S, Yamasaki H (2002). Nitric Oxide Production Mediated by Nitrate Reductase in the Green Alga Chlamydomonas reinhardtii: an Alternative NO Production Pathway in Photosynthetic Organisms. Plant Cell Physiol 43: 290-297.
Schnetzer A, Jones BH, Schaffner RA, Cetinic I, Fitzpatrick E, Miller PE et al (2013). Coastal upwelling linked to toxic Pseudo-nitzschia australis blooms in Los Angeles coastal waters, 2005–2007. J Plankton Res 35: 1080-1092.
Seegers BN, Birch JM, Marin R, Scholin CA, Caron DA, Seubert EL et al (2015). Subsurface seeding of surface harmful algal blooms observed through the integration of autonomous gliders, moored
Shikata T, Iseki M, Matsunaga S, Higashi S-I, Kamei Y, Watanabe M (2011). Blue and Red Light-Induced Germination of Resting Spores in the Red-Tide Diatom Leptocylindrus danicus†. Photochem Photobiol 87: 590-597.
Smith GJ, Zimmerman RC, Alberte RS (1992). Molecular and physiological responses of diatoms to variable levels of irradiance and nitrogen availability: growth of Skeletonema costatum in simulated upwelling conditions. Limnol Oceanogr 37: 989-1007.
Thompson SEM, Taylor AR, Brownlee C, Callow ME, Callow JA (2008). The Role of Nitric Oxdie in Diatom Adhesion in Relation to Substratum Properties. J Phycol 44: 967-976.
Vardi A (2008). Cell signaling in marine diatoms. Commun Integr Biol 1: 134-136.
Wilkerson FP, Dugdale RC (1987). The Use of Large Shipboard Barrels and Drifters to Study the Effects of Coastal Upwelling on Phytoplankton Dynamics. Limnol Oceanogr 32: 368-382.
Wilkerson FP, Dugdale RC, Kudela RM, Chavez FP (2000). Biomass and productivity in Monterey Bay, California: contribution of the large phytoplankton. Deep-Sea Res Pt II 47: 1003-1022.
23
CHAPTER 2: DIFFERENT IRON STORAGE STRATEGIES AMONG BLOOM-FORMING DIATOMS Introduction
In wide-ranging areas of the world’s oceans, phytoplankton growth is frequently limited by the availability of the micronutrient iron (Martin and Fitzwater 1988, Moore et al 2001). Inputs of iron via atmospheric dust deposition or resuspension of continental shelf sediment during upwelling are spatially and temporally variable, leading to gradients or sporadic episodes of increased iron concentrations (Bruland et al 2001, Mahowald et al 2005). From the tropics to the poles, the introduction of iron to iron-limited surface waters is known to stimulate phytoplankton growth usually dominated by large diatoms (Boyd et al 2007). One cosmopolitan genus of pennate diatoms in particular, Pseudo-nitzschia, consistently thrives when iron is added (de Baar et al 2005). Consequently, certain bloom-forming diatoms have evolved to possess a number of mechanisms that allow them to persist under chronically low iron and rapidly divide when it is reintroduced (Armbrust 2009, Marchetti and Maldonado 2016). One such mechanism is the ability to store iron; however, methods for storage are not universal among all diatoms, which in turn may affect iron storage capacities. Two iron storage strategies in diatoms have been previously described: within the protein ferritin and vacuoles (Marchetti and Maldonado 2016).
Similarly in some FTN-containing diatoms, gene expression changes are comparatively subdued between different iron states suggesting a role other than long-term storage (Cohen et al 2018).
In contrast, Pseudo-nitzschia ferritins are highly conserved, and when acclimated to varied iron concentrations, Pseudo-nitzschia substantially increase FTN expression with dissolved iron
concentrations (Marchetti et al 2009, Marchetti et al 2017). Additionally, the oceanic species Pseudo-nitzschia granii was also able to perform significantly more cell divisions than a diatom without ferritin, Thalassiosira oceanica, when transitioned from high to low iron conditions (Marchetti et al 2009). As a result, ferritin in Pseudo-nitzschia provides an explanation for their unusually high iron storage capacities (Cohen et al 2018, Marchetti et al 2009); however, biochemical examination of Pseudo-nitzschia ferritin shows that iron remineralization is slow, suggesting a role in buffering (Pfaffen et al 2015). Beyond speculation over its true function, the ecological importance of ferritin also remains in question; it has been suggested that competitive strength for diatoms in limited regions lies primarily in using iron-free proteins rather than iron storage (Mock and Medlin 2012).
In the non-ferritin containing species of the genus Thalassiosira, evidence supports an intracellular vacuole mechanism for iron storage. Thalassiosira pseudonana possesses a divalent transporter belonging to the natural resistance associated macrophage protein (NRAMP) family (Kustka et al 2007), and some NRAMP proteins are used in other eukaryotes to transport iron out of vacuoles (Lanquar et al 2005, Portnoy et al 2000). Observed up-regulation of this gene under low dissolved iron concentrations suggests that NRAMP could be used to mobilize iron out of a vacuole although a role in cell-surface uptake has not been ruled out (Kustka et al 2007). Anomalously high intracellular regions of iron with stoichiometries consistent with polyphosphate-bound iron in T. pseudonana and Thalassiosira weissflogii also support a vacuolar storage mechanism for these diatoms (Nuester et al 2012).
25
communities. Using shipboard incubations, iron was added to or removed from phytoplankton with varying initial iron states. We show that iron storage ability can be exceptionally high, and ferritin expression is unique in Pseudo-nitzschia while other non-ferritin utilizing diatoms likely employ vacuolar storage. This ferritin-linked storage ability may provide an advantage to ferritin-utilizing diatoms such as Pseudo-nitzschia under prolonged periods of iron limitation.
Materials and Methods Experimental Design
Incubation experiments were conducted at five sites within the California Upwelling Zone (CUZ, July 2014) onboard the R/V Melville or along the Line P transect in the subarctic NE Pacific (June 2015) onboard the CCGS John P. Tully (Figure 2.1 and Table 2.1). Experimental procedures are described in (Cohen et al 2017b) for all sites except C-Low2, which is described in Chapter 1. In summary, near-surface water (Table B.1) was collected using trace-metal clean techniques and distributed into acid-cleaned 10L Cubitainers® (Hedwin Corporation, Newark, DE, USA) except C-Low2 for which water was collected from 96 m. Cubitainers were incubated on-deck at near-ambient surface water temperature and screened at approximately one-third surface irradiance. Treatments included an unamended control (C), addition of iron with 5 nmol L-1 FeCl3 (Fe), removal of iron with 200 nmol L-1 of the fungal siderophore
desferroxamine B (DFB), and iron addition at t = 0 followed by iron removal at the first time point (FeDFB) to mimic a short-lived iron pulse. At site P-Low, DFB was added to a control and Fe treatment at 48 hours for the DFB and FeDFB treatment sampled at 96 hours. At site P-High, 10 µmol L-1 of NO3 was added to
all incubations to support growth since initial NO3 concentrations were low (1.49 µmol L-1). Timing of
incubation sampling for each experiment is described in Table B.1. At dawn of each time point, triplicate cubitainers of each treatment were harvested and subsamples were collected for the following
measurements: dissolved inorganic nutrients, chlorophyll a, biogenic silica, Fv:Fm, RNA, and SXRF.
Methods for analyzing chlorophyll a, biogenic silica, and Fv:Fm are described in Cohen et al (2017b).
Figure 2.1 - Map of field incubation locations with interpolated statistical means of nitrate concentrations (µmol L-1) on a 1° grid of all decades from World Ocean Atlas 2013.
Table 2.1. Incubation site identifiers, location, and initial iron conditions. At site P-High, 10 µmol L-1 of
NO3 was added.
RNA-Seq Overview
The initial RNA extraction, sequencing, assemblies, and annotations are described in Cohen et al (2017b) and Chapter 1. Briefly, seawater was filtered onto 0.8 µm filters then immediately flash frozen. RNA was extracted using the ToTALLY RNA Total RNA Isolation Kit and treated with DNase 1 (Life
Name Latitude & Longitude
Fe:NO3
(nM:µM)
Initial [Fe] (nM)
C-High 38.7° N, 123.7° W 0.26 3.57
C-Low1 42.7° N, 125.0° W 0.06 1.05
C-Low2 35.9° N, 121.7° W 0.06 1.28
P-High 48.7° N, 126.7° W 0.42 0.64
27
Technologies, Grand Island, NY, USA). Library preparation was conducted with the Illumina TruSeq Stranded mRNA Library Preparation Kit and HiSeq v4 reagents. Sequencing of barcoded samples was performed on an Illumina HiSeq 2000 (125bp, paired-end). All samples were sequenced in triplicate except samples for treatments with low yields (all t = 0 and Line-P samples) where triplicate extractions were pooled into one sample. Reads were trimmed for quality and removal of adapters using
Trimmomatic v0.32 (Bolger et al 2014). Trimmed paired reads that overlap were merged into single reads with BBMerge v8.0. Merged pairs and non-overlapping paired-end reads were used to assemble contigs using ABySS v1.5.2 with varied k-mer sizes (Birol et al 2009) then the assemblies were merged using Trans-ABySS v1.5.3 to remove redundant contigs (Robertson et al 2010). Contigs shorter than 120 bp were discarded.
Annotation was assigned by best homology (lowest E-value) to protein databases using BLASTX v2.2.31 (E-value ≤ 10-3). For taxonomic identification, MarineRefII, a custom reference database (Moran
Lab, University of Georgia) was used. MarineRefII contains predicted protein sequences of marine microbial eukaryotes and prokaroytes including all sequenced transcriptomes from the Marine Microbial Eukaryote Transcriptome Sequencing Project (Keeling et al 2014). To assign gene function to contigs, the same methodology with the Kyoto Encyclopedia of Genes and Genomes (KEGG; Release 75) was used (Kanehisa et al 2017). The best hit with a KEGG Ortholog (KO) number from the top 10 hits was chosen. For this analysis, assemblies from all sites were then merged again with Trans-ABySS and duplicate contig removal verified with GenomeTools v1.5.1 (Gremme et al 2013). Read counts were estimated from this combined assembly using the quasi-mapping method implemented in Salmon v0.73 (Patro et al 2017). The Pseudo-nitzschia Iron Limitation Index (ILI) was calculated using our annotations and un-normalized counts for ferritin and iron starved induced protein 2A (ISIP2A) according to the formula presented in Marchetti et al (2017). In all other instances, normalization, gene expression, and differential expression were assessed within each taxonomic group using DESeq2 v1.12.4 (Love et al 2014).
Significance was determined by genes with Benjamini & Hochberg adjusted P-values ≤ 0.05 (Benjamini
Synchrotron X-ray Fluorescence (SXRF) Preparation and Analysis
Samples were collected and analyzed following Twining et al (2003, 2011). Briefly, cells from 500 mL of sample were gently preconcentrated approximately ten-fold over 2 μm pore-size polycarbonate
membranes via gravity filtration. The remaining 40 mL was transferred to a centrifuge tube, preserved with 0.25% trace-metal clean electron-microscopy grade buffered glutaraldehyde, and centrifuged onto C/formvar-coated Au TEM grids. After centrifugation, grids were briefly rinsed with Milli-Q water and dried in a darkened Class-100 hood. Grids were then mounted onto custom-machined Al holders for storage and analysis. Light and chlorophyll fluorescence images were collected for target cells using a shipboard microscope. SXRF analyses was performed at the 2-ID-E microprobe beamline at the Advanced Photon Source (Argonne National Laboratory). The incident beam energy was tuned to 10 keV to allow for the stimulation of K-line emissions for all elements ranging in atomic number from Si through Zn. Each target cell was scanned in a 2-D raster fashion by the focused X-ray beam and the entire X-ray fluorescence spectrum recorded at each pixel. The spectra from the pixels covering the cell were summed to generate a single spectrum corrected with a background region. Element concentrations were calculated by comparison to certified reference standards (Nunez-Milland et al 2010, Twining et al 2003), and cellular C was calculated from cell volume (Twining et al 2004).
Data Deposition
The data reported in this paper have been deposited in the National Center for Biotechnology (NCBI) sequence read archive under the accession nos. SRP074302 (BioProject no. PRJNA320398) and SRP108216 (BioProject no. PRJNA388329).
Results and Discussion
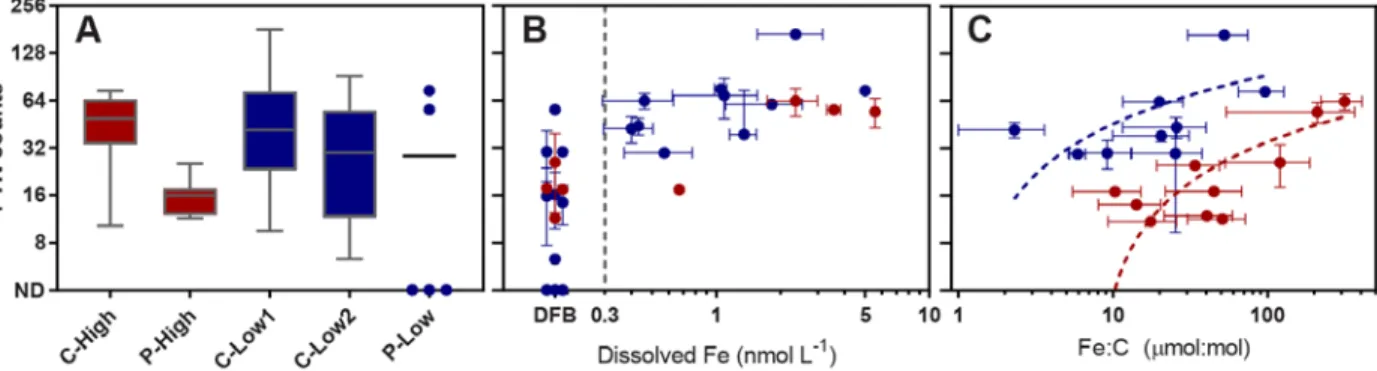
Iron States within the Initial Phytoplankton Communities and Incubations
29
dependent on shelf width (Figure B.1)(Bruland et al 2001, Hutchins et al 1998). The other experiments were conducted along the Line-P transect, a well-characterized iron gradient extending into the high-nutrient low-chlorophyll (HNLC) region of the Northeast Pacific Ocean (Harrison 2002). Specifically, the sites correspond to the coastal station, P4 High), and an oceanic site, Ocean Station Papa or P26 (P-Low).
Herein named based on their initial iron states (high or low), these locations provided varying initial phytoplankton biomass, macronutrient, and iron concentrations that were then further manipulated by the addition of iron (Fe) or the removal of bioavailable iron through addition of the strong iron chelator desferrioxamine B (DFB)(Figure 2.2 and Table 2.1). Short-lived pulse additions were also simulated by an initial addition of iron, then followed by addition of DFB at the first time point (FeDFB treatments). Iron status was assessed based on oceanographic context (Appendix B), differences in the chemical and biological properties of the water1 (Table B.2), and a combination of gene expression-based molecular
indicators that evaluate iron stress or limitation for distinct diatom genera (Figure B.2).
Low iron sites displayed comparatively lower Fe:NO3 ratios (Table B.1). Further substantiating
their initial status, significant differences between the Fe and control incubations were always observed in photosynthetic efficiency (Fv:Fm)and commonly found for chlorophyll, biogenic silica, nitrate drawdown,
and the molecular indicators of iron stress (Table B.3). C-High phytoplankton dynamics were largely unaffected by the addition of iron compared to controls as shown by a lack of significant differences, and those at P-High were driven more by macronutrient availability rather than iron.
At all sites, significant differences were observed between the Fe and DFB treatments, indicating that low and high iron scenarios were created at each site, regardless of the initial iron status. At C-High, only nitrate was significantly reduced by iron addition out of the macronutrient, chlorophyll, and biogenic silica concentrations; however, the molecular indicators validate that the diatom community’s physiology was influenced by the addition of DFB, creating a low iron contrast. The remaining sites show significant differences between the Fe and DFB treatments in nitrate drawdown, chlorophyll, and biogenic silica, although these differences are also not entirely universal, which may be a result of the dissimilar initial
1nitrate drawdown, chlorophyll a, biogenic silica, and photosynthetic efficiency (F
conditions. Fv:Fm, however, was consistently reduced by DFB addition as were the molecular indicators of
31
Figure 2.2 - Macronutrient (µmol L-1), size-fractionated chlorophyll a (µg L-1), and biogenic silica
(µmol L-1) concentrations and maximum photochemical yields of photosystem II (F
v:Fm) from the
initial collected seawater (t = 0) and incubations at various time points. Incubations are labelled as follows: control (C), iron addition (Fe), iron removal (DFB), iron addition followed by removal (FeDFB) and denoted as the first or second time point (T1 or T2) where applicable. California Upwelling Zone (CUZ)
sites and Line-P sites are grouped separately as two of the x-axis scales are different.
Taxonomic Distributions
Relative taxonomic distributions based on transcript proportions were assessed within the whole community for phylum-based groupings and among diatom genera (Figure 2.3 and Figure B.3). Although transcript proportions may not always relate to cell abundance, they are indicative of the relative activity among groups and within this study, are consistent with inferred cell abundances. Diatoms consistently comprised higher relative abundances in the Fe treatments compared to the DFB treatments at the low iron sites while the opposite was found by the final time points at both high iron sites (Figure 2.3a). Although these higher relative transcript proportions at the low iron sites appear minor (<10%), they may still have translated to a large absolute abundance of certain diatoms. These higher relative abundances were coupled to increases in chlorophyll (>5 µm) and biogenic silica concentrations indicating that the absolute cellular abundance of diatoms was greater following iron addition rather than simply a shift in proportions (Figure 2.2).
This increase in diatom transcript abundance and presumed cellular abundance when iron was added aligns with diatoms’ known ability to respond positively when transitioning from low iron to high iron (Boyd et al 2007). Diatoms were also favored when the environment transitioned from high to low iron as shown by higher relative abundance in the DFB treatments compared to the Fe treatments by the last time points at the high iron sites (Figure 2.3a). Regardless of the situation (high iron to low iron or vice versa), diatoms were ultimately able to increase in relative abundance aligning with their responsiveness to iron availability (Cohen et al 2017b, Marchetti et al 2012). In the transition from high to low iron, iron storage may play a role in allowing diatoms to continue to divide as growth rates in other taxa slow.
Chaetoceros appeared to be favored by iron addition in the coastal low iron sites while having slightly higher proportions with DFB in the high iron sites. Interestingly, Pseudo-nitzschia consistently had higher transcript proportions in the control and DFB treatments compared to when iron was added. As
anticipated from Pseudo-nitzschia species’ high iron storage capacities, their ability to store iron may play a role in these shifts. As iron is removed, Pseudo-nitzschia can use stored iron to maintain a higher growth rate while others may not (Marchetti et al 2009).
The exception was the oceanic site, P-Low, where Pseudo-nitzschia transcripts greatly increased in the Fe treatment compared to the control and DFB treatments, consistent with previous observations of iron enrichment in HNLC regions (Figure B.3)(de Baar et al 2005). Here, Chaetoceros proportions
remained relatively low, but similar to the other sites, Thalassiosira rose in percentage when iron was added. Also as observed at the other sites in the DFB treatments, Pseudo-nitzschia still rose to become the most prevalent genus showing that it persisted compared to the other genera although iron was depleted.
33 Iron Quotas among Diatom Genera
Cellular iron contents, or quotas, were quantified in individual Chaetoceros and Pseudo-nitzschia cells from within the incubations using synchrotron X-ray fluorescence (SXRF) microscopy (Figure 2.4a and Figure B.4)(Twining et al 2003). Both coastal and oceanic Pseudo-nitzschia species are known to have exceptionally high iron storage capacities, (Cohen et al 2018, Marchetti and Maldonado 2016) which was observed in these experiments (Figure 2.4a). At C-High, where in situ iron concentrations were highest (Table 2.1), Pseudo-nitzschia had significantly higher quotas in the high iron treatments (control and Fe) compared to Chaetoceros and at the other sites.
Figure 2.4 - (a) Cellular iron quotas (µmol Fe:mol C) in Chaetoceros and Pseudo-nitzschia from incubations. Bars are geometric means ± standard error. (b) Time course for site C-Low1 of
In many cases, the quotas in Pseudo-nitzchia and Chaetoceros were similar. For instance, there are no significant differences in the quotas achieved between the genera at P-High and both increased their quotas when Fe was added at C-Low1 (Figure 2.4a). At P-High, although phytoplankton growth was induced by the addition of nitrate (primarily haptophytes), diatoms declined in relative transcript proportions from 24 to 48 hours as silicate concentrations decreased to < 1 µmol L-1, which likely became limiting to
diatom growth (Figure 2.2 and Figure B.3). With silicate depletion preventing cell division, cells likely accumulated iron in the Fe and control treatments (30) and transitioned toward their minimum quotas in the DFB treatment, where iron was bound to DFB (Figure 2.4a).
At P-Low, Pseudo-nitzschia showed extraordinary ability to maintain a substantial Fe:C quota of 58.02 (+11.95, -9.90) µmol:mol in the control treatment even though the initial dissolved iron
concentrations were 0.05 nmol L-1 and markers of iron stress were high (Figure B.2). The abundance of
Chaetoceros cells was too low to quantify iron quotas at this site. Overall, these results align with
previous studies showing overlap in iron quotas for diatoms, including Thalassiosira under moderate iron conditions, although Pseudo-nitzschia species appear to have higher iron maximum quotas and therefore a greater iron storage capacity (Cohen et al 2018, Marchetti and Maldonado 2016).
A closer examination of the results at C-Low1 suggests that maintenance of stored iron between the two diatom genera is not the same. At this site, Pseudo-nitzschia appeared to be able to use iron storage to continue to divide and outcompete Chaetoceros. As iron concentrations decreased in the control incubations and indicators of iron stress were exhibited (Figure B.2), Pseudo-nitzschia were able to maintain iron quotas (25.7 +8.06,-6.13 µmol Fe:mol C) while those in Chaetoceros declined (6.21 +2.67,-1.86 µmol Fe:mol C) from 48 hours to 72 hours. Meanwhile, chlorophyll, biogenic silica, diatom transcript proportions, and transcript proportions of Chaetoceros and Pseudo-nitzschia all increased between the same two time points (Figure 2.4b). Notably, Pseudo-nitzschia increased from 26% to 39% of diatom transcripts while Chaetoceros remained lower.