AN ANALYSIS OF THE DETERMINANTS OF SOCIAL CAPITAL AS CONNECTEDNESS IN LENOIR COUNTY, NC
By
Margaret Madeline Brown
Honors Thesis Economics
University of North Carolina
April 25th, 2014
Acknowledgement
Abstract
Social connectedness is frequently defined as the extent to which people interact with one another, either individually or through groups. A person’s number of close friends and family members, the frequency and type of interactions a person has with her friends and family, the trust she has in her neighbors and others, and the extent to which she participates in volunteer activities or community events all directly correlate to a person’s well being – both in a personal and economic sense. In economic literature the focus has been on examining the importance of social capital for economic growth. Researchers have also examined the links between social connectedness and its impact on better health outcomes (mental and physical), welfare, political connectedness, and much more. But at this point in time, there is very little research examining what factors affect social connectedness itself. This paper will contribute to the body of research on social connectedness by attempting to determine what demographic factors have the potential to influence levels of social
I. Introduction
Social connectedness is frequently defined as the extent to which people
interact with one another, either individually or through groups. A person’s
number of close friends and family members, the frequency and type of
interactions a person has with her friends and family, the trust she has in her
neighbors and others, and the extent to which she participates in volunteer
activities or community events all directly correlate to a person’s well being –
both in a personal and economic sense. In economic literature, social
connectedness is often referred to as social capital. Numerous studies have shown
the importance of social capital for economic growth, and many have examined
the links between social connectedness and its impact on better health outcomes
(mental and physical), welfare, political connectedness, and much more. To my
knowledge, there is very little research examining what factors affect social
connectedness itself.
Following the 2007 financial crisis, the United States experienced an era
of economic downturn now loosely called the Great Recession. Medications to
treat mental health diseases such as anxiety and depression are being prescribed at
an all time high (Ferlander, 2007). Participation in the political process and voter
turnout is low (Timpone, 1998). At more than any other point in history,
individuals report feeling isolated and distanced from their neighbors and
influence social connectedness has on all of these pressing policy issues, not
much is known about what factors determine how socially connected an
individual is. Determining what variables impact social connectedness, and then
designing policy around encouraging high levels of social connectedness, has the
potential to significantly and positively benefit the wide range of issues for which
social connectedness is an important contributing factor.
With the above motivation in mind, the research undertaking will examine
demographic information for 228 individuals living in Lenoir County, North
Carolina – a county experiencing many of the ill effects of the pressing policy
issues described above. The demographic information will be paired in a dataset
with the same individuals’ responses to questions that were designed to ascertain
their level of social connectedness. Logistic regression analyses will be conducted
in an attempt to distinguish which key demographic and economic factors have
the potential to elevate the levels of social connectedness for an individual.
The next section will review the literature. After that, an empirical model
for the analysis will be presented. Data will be described in section four, followed
II. Literature Review
A brief overview of existing literature linking social connectedness to the
issues mentioned above (economic prosperity, better health outcomes, welfare,
political connectedness, and more) is included below, in order to demonstrate the
high significance of social connectedness to economic growth and other current
issues in the United States and the world. This overview will also highlight the
relatively limited amount of work that has been done towards determining factors
that affect social connectedness.
While there is limited research on the determinants of social
connectedness, there is a significant body of research dedicating to examining the
importance of social capital for economic growth. Rupasingha et al. (2000)
examine whether social capital affects economic growth by using linear
regression analysis and county level data within the United States. The results
from this study indicate that social capital has a statistically significant and
positive effect on the growth rate of per-capita income. While social capital is
defined as an independent variable leading to positive economic growth, there is
still a lack of literature on independent variables that influence social
connectedness. Understanding of these factors could lead to expanded knowledge
on how economic growth could be encouraged by encouraging social
Knack and Keefer (1997) also provide evidence that social capital matters
for measurable economic performance. Using indicators of trust and civic norms
from the World Values Surveys for a sample of 29 market economies, Knack and
Keefer find that trust, civic norms, and social connectedness as a “safety net”
where other, more traditional welfare programs lack an impact, directly lead to
improved economic performance in market economies at the national level.
Temple and Johnson (1998) follow up on this idea with their research using
indexes of social development constructed in the early 1960s. Their results
indicate the importance of social capital for economic growth that go beyond the
reasons discussed by Knack and Keefer. Beugelsdijk et al. (2004) also follow up
on Knack and Keefer, and find their results on the relationship between social
capital and economic growth to be robust.
Piazza-Georgi (2002) reviews the body of literature on social capital, and
comes to the conclusion that social capital is a significant factor leading to
economic growth. She also makes the case that given the recognized importance
of social capital to economic growth on the individual, community, and national
level, one new area of focus should be empirical study of factors determining
social capital. My research contributes to the literature by investigating the factors
that influence social connectedness.
Many economists have long been aware that social networks may have a
undertaking by Babcock (2008) uses estimates concerning the effect of
connectedness (as measured by friendship ties in middle and secondary school) on
educational attainment and thus later economic success, using data from the
National Longitudinal Survey of Adolescent Health (Add Health). This study is
unique in that it uses micro-level measures of connectedness or social interaction
(the kind that this research undertaking will seek to explain using independent
factors related to demographic information) that are sufficiently subtle to test
nontrivial hypotheses. Some of the findings include that being part of a more
connected cohort within a given secondary or middle school as a part of the local
community is associated with significantly higher probability of having attended
college seven years later, and thus later leading to more economic success
(Babcock, 2008). To my knowledge, the current literature on the subject is limited
and my research undertaking can be viewed as a small step taken to further
understanding of social connectedness itself, and in this way contribute to the
body of literature aimed at improving social connectedness among individuals
with the end goal of economic growth and progress in the issues mentioned
above.
In related research, Ferlander (2007) provides an overview of the concept
of social capital and distinguishes its different forms, with the purpose of
elaborating on the potential for social connectedness to dramatically impact
concept of social capital over time. Ferlander discusses Putnam’s (1995, 2000)
claim that the core idea of social capital is that social networks have value directly
in how they (through health and other factors) affect the economic productivity of
individuals and groups.
Research by Cornwell, et al. (2008) and by De Marco and De Marco
(2008) elaborate on the relationships between social connectedness and health
outcomes. Cornwell, et al. use data from the National Social Life, Health, and
Aging Project – a population based study of non-institutionalized older Americans
ages 57 to 85. This paper is particularly relevant to this research undertaking as
the mean age of the sample used later on in the paper is 56, and as Cornwell, et al.
(2008) findings demonstrated that high levels of social connectedness result in
better health and happiness outcomes. De Marco and De Marco used data from
the Welfare, Children, and Families: A Three-City Study longitudinal dataset
comprised of low-income neighborhoods in Boston, San Antonio, and Chicago to
examine the impact of social connectedness and neighborhood characteristics on
the use of nutrition, health, and welfare programs in local communities. Using
hierarchical linear models, the results indicated that both individual (education,
employment, and marriage) and perceived neighborhood disorder factors were
related to social service use. Both of these works used empirical research to link
On the other hand, Persell, et al.’s (2001) work links the importance of
social connectedness to social tolerance and economic prosperity in local
communities. Persell, et al. use a multivariate analysis of pooled General Social
Survey data from 1972 to 1994 to suggest that social connectedness can over time
lead to increased social tolerance of different racial groups and groups with varied
sexual preferences along with greater economic development and prosperity.
One of the biggest ways increased social connectedness can contribute to
the positive progress of issues mentioned in the introduction section is through
greater political awareness and involvement. Several studies, including Staton, et
al. (2007), Timpone (1998), Kwak, et al. (2004) all point to the significance of
social connectedness in increasing political participation and voter turnout in local
communities. Greater involvement in the political process translates to policy
initiatives that more accurately reflect the needs and concerns of individuals
living within a local community, and improving social connectedness is often an
important first step in increasing political connectedness as well.
Social connectedness has the potential to dramatically improve a range of
economic, health, welfare, and political issues. And yet there is very little research
dedicated to examining the determinants of social connectedness itself. This
research undertaking will contribute to the body of literature in this way, by using
Carolina to test the effect of demographic and economic variables on social
connectedness.
III. Empirical Model
The empirical model will attempt to estimate the impact of various
demographic and economic variables on social connectedness. The dependent
variable, social connectedness ( , is a yes/no indicator variable for an
individual who is considered (according to his mean scale social connectedness
score from the Six-Month Follow-Up form) to have high levels of social
connectedness or not. Based on the empirical models used by Rupasingha et al.
(2000) and Babcock (2008), age, gender, race, marital status, income, education
level, and level of employment were used as explanatory variables. My research
will make use of two other variables that were unique to the dataset I used:
“perceived level of standing within the community” and “perceived level of
standing within the United States as a whole.” Of the nine independent variables,
age is continuous. Gender is a yes/no indicator variable for being male, race is
yes/no indicator variable for being white, marital status is a yes/no indicator
variable for living with a partner, income is a yes/no indicator variable for being
above median income, and perceived levels of standing within the community and
the United States are yes/no indicator variables for being in the top level of the
school completion, graduation of high school, some college completion,
graduation of college, and advanced degree work. Employment was coded with
three options: unemployed, employed part time, and employed full time. The
specific empirical model that will be used for estimation is defined in the
following equation:
(1)
where represents social connectedness, is a vector of variables that will
likely affect , are the coefficients of , and is errors resulting from
unobservable factors. In my estimation will be defined as a binary variable.
The logistic regression will be the appropriate estimation method.
V. Data
Data from the Heart Healthy Lenoir Project were used for this study. The
Heart Healthy Lenoir Project is a community-based research project designed to
develop and test better ways to reduce heart disease in Lenoir County, from
prevention to treatment. The Heart-Healthy Lenoir Project is a collaborative
project between several Lenoir County agencies and community members, the
University of North Carolina at Chapel Hill, and East Carolina University
Departments of Family Medicine and Public Health. Lenoir County in particular
was chosen for the study as it is a lower income, more rural county within the
and financial challenges members of the community face (UNC Center for HPDP,
2014).
The dataset used in this research undertaking was taken from two
individual surveys of individuals participating in the Heart Healthy Lenoir
Project, and the data are connected via generic IDs of the respondents. The first
survey was the Heart Healthy Lenoir Project Enrollment Form. The demographic
information from which the independent factors were collected comes from
Section B of this form (which is attached in the appendix). The second survey was
from the Heart Healthy Lenoir Project Six-Month Follow-Up. The individual
responses to Section H: “Questions About Your Community” (also in the
appendix) of this form generate the data that were used to create the social
connectedness variable that is serving as the independent variable.
In total, there were 228 generic IDs with complete responses that were
contained in the dataset and used for the regression analysis. The first independent
factor was age. Age was a continuous variable ranging from 26 to 89, with a mean
of 56. Gender was second, coded as a binary variable with 0 representing female
and 1 representing male. Females accounted for 79% of the population and males
21%. Race was also coded with a binary variable with 0 representing black and 1
representing white. 32% of the population was reported as black and 68% as
white. Marital status was initially a categorical variable with six options: married,
recoded as a binary variable with 0 representing widowed, divorced, separated,
and never married, and 1 representing married and living with partner. This was
done as the point of the independent variable in this analysis was to examine the
impact of living with or without a significant other in the household and the
potential subsequent effect on social connectedness. 53% of the population was
represented as single and 47% as living with a significant other.
Household income was initially collected in intervals with fifteen options
ranging from less than $5,000 to greater than $100,000. It was recoded as a binary
variable with 0 representing individuals living in households below median
income (roughly $45,000 for North Carolina and the United States) and 1
representing individuals living in households above median income. This was
done in order to understand the possible effects of living in a better or worse-off
financial situation in a simpler analysis. Roughly 71% of the respondents lived
below median income and 29% above it. Employment was recoded from eight
initial options to three, with 0 representing currently unemployed (unemployed or
laid off, looking for work, student, keeping house or raising children full-time, do
not work due to health reasons, and retired), 1 representing working part time, and
2 representing working full time. This was recoded with the purpose of analyzing
the possible effects of the kind of networks an individual would have through
work on social connectedness. 48% of the population was currently unemployed,
Education was initially collected with twenty-one levels, representing last
grade completed and ranging from one to over twenty-one (indicating advanced
degrees). It was recoded with five categories: 0 representing no high school
completion, 1 - graduation of high school, 2 - some college coursework
completion, 3 - graduation of college, and 4 - advanced degree coursework. This
was done in order to allow a broader insight into the types of networks of
individuals with distinctly different educational qualifications. Roughly 15% of
the population did not complete high school, 38% completed high school but no
college coursework, 22% completed some college work, 16% graduated from a
four year college, and 8% completed coursework for advanced degrees.
The final two independent variables were self-reported perceived
socioeconomic standings within the individual’s local community and the United
States. The respondents were shown an image of a ladder with ten rungs and
instructed to select the rung that was appropriate to their standing. Both of these
variables were recoded as binary variables with 0 representing a self-reported
standing in the bottom half of the community or the United States and 1
representing the top half. This was done in order to analyze a more simple case of
whether the individuals thought they were better or worse off than average. For
the community variable, 77% of the respondents placed themselves below
States variable, 25% of the respondents places themselves below average and
75% above average.
The dependent variable “social connectedness” was represented in the
dataset by a previously created variable z_socialcapital. In Section H of the
Six-Month Follow-Up form, respondents were presented with a series of questions
about their community and given a scale to answer of five options: disagree
strongly (1), disagree (2), neutral (3), agree (4), and agree strongly (5). A mean
scale score was calculated based on the individual’s responses. The scores for the
different items on the questionnaire were totaled and then divided by the number
of items in the scale to get a mean scale score for each respondent. This
maintained the range of the scores on the new scale as they were initially reported
(1 through 5), though this led to the variable z_socialcapital becoming a variable
with thirteen options from 1 to 5 (1, ~1.33, ~1.67, 2, etc.). In order allow for
estimation with meaning in such a small sample size, this z_socialcapital variable
was recoded as a binary variable. This process was done twice. For the first new
dummy variable, 0 represented mean scale scores from 1 to ~2.67, while 1
represented mean scale scores from 3 to 5. Thus, 0 indicated low levels of social
connectedness and 1 indicated higher levels of social connectedness. For the
second dummy variable, 0 represented mean scale scores from 1 to 3, while 1
represented mean scale scores from ~3.33 to 5. The decision was made to create
attempt to account for, or at least recognize, the somewhat arbitrariness of making
a mean scale score of 3 for the z_socialcapital variable the boundary between low
and high levels of social connectedness. It also allowed for two slightly different
estimations, and thus different analyses and interpretations, of the empirical
model given the small dataset.
V. Results
A. Descriptive Statistics
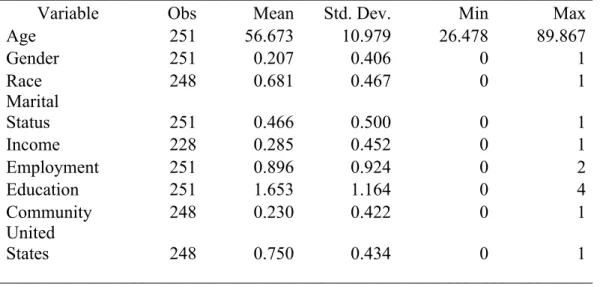
Table 1 summarizes the nine independent variables used in the
estimation analysis. As discussed before, the independent variables (age,
gender, race, marital status, income, level of employment, level of
education, and self reported perceived standings in the community and the
United States) were variables from the Heart Healthy Lenoir Project
enrollment form, most of which were recoded (gender, race, marital status,
income, and standings as binary variables, levels of employment and
education as categorical variables).
Table 2 is the correlation matrix for these nine explanatory factors.
This analysis was conducted to check for possible existence of collinearity
between the independent variables. As can be seen, with the exception of
income/marital status, none of the independent variables have a correlation
significant problem. Income and marital status are correlated at the 0.5010
level. But this value is not high enough to pose a serious issue.
B. Estimations
To estimate the possible impact of key demographic information
on social connectedness, two different logit regressions were estimated. In
the first, the social connectedness variable in which high levels of social
connectedness included mean scale scores ranging from 3 to 5 was used as
the binary dependent variable against the independent variables
representing demographic information and economic variables. In the
second, the social connectedness variable in which high levels of social
connectedness included mean scale scores ranging from ~3.33 to 5 was
used. The social connectedness variable originally had thirteen values. For
this analysis social connectedness is defined as a binary variable. The two
variables that were created account for making the distinction at the sixth
and seventh values of the original variables.
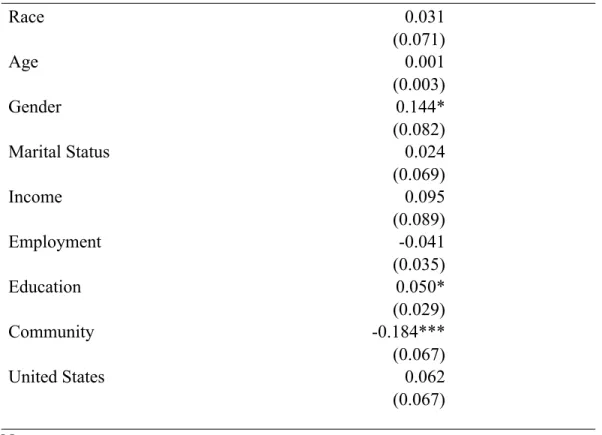
Table 3 displays the marginal effects of the estimation using the
first binary social connectedness variable in a logit regression to
investigate the probability of influence for the dependent factors. In this
estimation, gender, level of education, and perceived self reported
The marginal effects analysis shows that being male significantly
increases the probability that an individual will have higher levels of
social connectedness by about 14%. There are several possible
explanations as for why this may be the case, and for why the magnitude
of this effect is important to note. Assuming all other things to be equal,
men are more likely to spend time outside of the house (and thus
interacting more with other members of the community) than women.
Women are still traditionally more involved in the child-rearing process
and in managing the activities and operations of a household. This means
that more of their time and energy is diverted away from the outside
community and more towards the internal affairs of a household. In
contrast, in rural Lenoir County men are more likely to spend time at
outside the home at work, bars, and on community sports teams than
women, and this likely leads to greater levels of social connectedness with
an individual’s community.
The analysis also indicated that higher levels of education increase
the probability that an individual will have higher levels of social
connectedness by about 5%. While accounting for less of an effect than
gender, the magnitude of the marginal effect of higher education is
significant. The majority (60%) of the sample in the dataset had education
coursework completed. Fifteen percent of the population did not complete
high school while 24% completed college or other advanced degrees. In
this way, higher levels of education in this sample are not necessarily
representative of what we traditionally think of as higher education
(graduation of college and advanced degree work), but instead, of
indicating that an individual completed high school and some college
work, most likely very local to the community. Higher levels of education
thus roughly translate into attending (and completing) high school, and it
is easy to understand how attending a local high school with other
individuals of a similar age could lead an individual to be more connected
to the community as a whole – particularly if an individual has lived most
of his life in the same community (as is the case for many Lenoir County
residents).
The marginal effects analysis shows that perceived self reported
standing in the top half of the community significantly decreases the
probability that an individual will have higher levels of social
connectedness by about 18%. This factor has the largest magnitude of the
statistically significant independent variables, yet is relatively
straightforward to understand. Individuals who view themselves as better
off than average within the community are likely to be less socially
services provided for worse off members of the community, and are thus
less likely to interact with others at these community centers. Better off
households are more likely to live in nicer houses on plots of land that are
further away from neighbors (imagine the difference between suburban
plots and subsidized tenant housing). This increased distance would make
individuals less likely to interact as neighbors, in the strictly social sense
and in terms of reliance – an individual is less likely to ask a neighbor for
help watching the kids, to borrow a cup of flour, etc. when the neighbor is
say an acre away as opposed to ten feet. And it may also simply be true
that individuals who view themselves as better off than others within the
community feel less of a desire to get to know other community members
from a more self-focused standpoint.
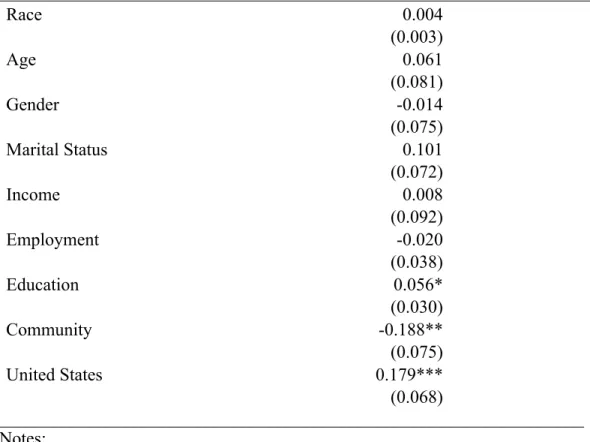
In the second specification of the logit regression, the social
connectedness variable in which high levels of social connectedness
included mean scale scores ranging from ~3.33 to 5 was used as the binary
dependent variable against the independent variables representing
demographic information. Table 4 displays the marginal effects of the
estimation using the second binary social connectedness variable in a logit
regression to investigate the probability of influence for the dependent
standing in the community, and perceived self reported standing in the
United States were all significant at the 10% level.
Similar to the first logit regression, this analysis also indicated that
higher levels of education increase the probability that an individual will
have higher levels of social connectedness. The magnitude was slightly
higher this time, with the probability increasing by about 6% as opposed
to 5% the first time. Also similar to the first logit regression, this analysis
showed perceived self reported standing in the top half of the community
significantly decreases the probability that an individual will have higher
levels of social connectedness – this time by about 19% as opposed to the
18% seen earlier.
The surprising aspect of this second analysis was the significance
of the perceived standing in the United States variable. Self reported
perception of an individual as better off than average in the United States
increased the probability that an individual would have higher levels of
social connectedness by roughly 18%. It may be the case that the
community and United States variables naturally counteract each other, or
the apparent opposite effects of these two variables may have more to do
with the underlying data itself. In the dataset, for the community variable
77% of the respondents placed themselves below average and 23% above
of the respondents places themselves below average and 75% above
average. This switch could account for the interesting opposite effects of
what appear on the surface to be two similar independent variables
(though it is important to note that these were not correlated when checked
earlier).
C. Concerns
As always with this type of investigative research, there are some
concerns and room for improvement in the methodology of the research
and analysis. The dataset itself was small, with a sample population of 228
complete responses. If there were more time, it would be useful to collect
more responses from individuals. There is also always the potential for
inherent bias in self reported surveys, whether that comes from individuals
not being fully aware of their entire situation or resulting from an inherent
bias in the types of individuals drawn to participate in the study.
Another cause for concern may be the grouping of many of the
independent variables into the binary variables that were used in the
regression analysis. Earlier, it was explained how and why each
independent variable was coded the way it was, but of course different
appropriate. And finally, the possibility of endogeneity is always a cause
for concern.
VI. Conclusion
Broadly, this research demonstrates several important results about the
impact of certain demographic information on an individual’s social
connectedness to the community he lives in. In both of the analyses conducted,
education and perceived standing with the community significantly affected the
probability of an individual having higher levels of social connectedness. In the
first specification of the model, gender was also significant at the 10% level,
indicating that being male increased the probability of higher levels of social
connectedness. In both specifications of my model, it was found that education
increased the probability of social connectedness being higher at the 10%
significance level, while higher perceived standing within the community
decreased the probability of higher social connectedness at the 1% significance
level. As discussed in the results section, this is likely due to the fact that in rural
communities such as Lenoir County individuals with higher perceived
socioeconomic status within the community are less likely to interact with their
neighbors and rely on them as a safety net. The impact of other demographic
a larger dataset and variety of responses more nuances of the independent factors
affecting social connectedness could be understood.
Social connectedness has been linked in previous research to better health
outcomes (mental and physical), welfare, political connectedness, economic
prosperity, and more. While there is a significant amount of research dedicated to
understanding how social connectedness is related to these factors, there is very
little research into the underlying factors affecting social connectedness itself. For
an aspect of an individual with such large potential impacts on other aspects of the
individual’s life, this seems incongruous. More research and understand into what
affects social connectedness could lead to better policy promoting social
connectedness, and this has the potential for positive ripple effects in many other
VII. Appendix
Table 1. Summary Statistics
__________________________________________________________________
Variable Obs Mean Std. Dev. Min Max
Age 251 56.673 10.979 26.478 89.867
Gender 251 0.207 0.406 0 1
Race 248 0.681 0.467 0 1
Marital
Status 251 0.466 0.500 0 1
Income 228 0.285 0.452 0 1
Employment 251 0.896 0.924 0 2
Education 251 1.653 1.164 0 4
Community 248 0.230 0.422 0 1
United
States 248 0.750 0.434 0 1
__________________________________________________________________
Table 2. Correlation Matrix
__________________________________________________________________
Age Gender Race Marit. Income Employ. Educ. Comm. U.S.
Age 1.000
Gender 0.065 1.000
Race -0.231 -0.165 1.000
Marit. -0.058 0.147 -0.203 1.000
Income -0.049 -0.017 -0.270 0.501 1.000
Employ. -0.307 -0.129 0.086 0.101 0.287 1.000
Educ. 0.008 -0.029 -0.242 0.202 0.398 0.183 1.000
Comm. 0.008 -0.102 -0.094 -0.057 -0.202 -0.124 -0.085 1.000
U.S. -0.028 -0.004 -0.061 0.038 0.003 -0.019 0.084 0.208 1.000
Table 3. Logit Estimates of Probability of First Social Connectedness Variable (Marginal Effects)
__________________________________________________________________
__________________________________________________________________ Notes:
Standard errors are given in parentheses. ***Significant at the 1 percent level. **Significant at the 5 percent level. *Significant at the 10 percent level.
Race 0.031
(0.071)
Age 0.001
(0.003)
Gender 0.144*
(0.082)
Marital Status 0.024
(0.069)
Income 0.095
(0.089)
Employment -0.041
(0.035)
Education 0.050*
(0.029)
Community -0.184***
(0.067)
United States 0.062
Table 4. Logit Estimates of Probability of Second Social Connectedness Variable (Marginal Effects)
__________________________________________________________________
Race 0.004
(0.003)
Age 0.061
(0.081)
Gender -0.014
(0.075)
Marital Status 0.101
(0.072)
Income 0.008
(0.092)
Employment -0.020
(0.038)
Education 0.056*
(0.030)
Community -0.188**
(0.075)
United States 0.179***
(0.068)
_________________________________________________________________ Notes:
Survey 2. Heart Healthy Lenoir Project Six-Month Follow-Up, Section H: Questions About Your Community
References
Babcock, Philip. "From Ties to Gains? Evidence on Connectedness and Human
Capital Acquisition." Journal of Human Capital 2, no. 4 (2008): 379-409.
Beugelsdijk, Sjoerd, Henri De Groot, and Anton Van Shaik. "Trust and economic
growth: a robustness analysis." Oxford Economic Papers 56, no. 1 (2004):
118-134.
Bourdieu, Pierre. "The Social Space And The Genesis Of Groups." Theory and
Society 14, no. 6 (1985): 723-744.
Center to Reduce CVD Disparities: Genes, Clinics, Communities. 2014. “Heart Healthy Lenoir Project.” University of North Carolina at Chapel Hill. P50043 (Social Capital Data Set) (accessed April 8, 2014).
Cornwell, B., E. O. Laumann, and L. P. Schumm. "The Social Connectedness of
Older Adults: A National Profile." American Sociological Review 73, no.
2 (2008): 185-203.
De Marco, Molly, and Allison C. De Marco. 2008. “Welcome to the
neighborhood: Does where you live affect the use of nutrition, health, and welfare programs?” University of North Carolina Working Paper.
Dinda, Soumyananda. "Social Capital In The Creation Of Human Capital And
Economic Growth: A Productive Consumption Approach." Journal of
Socio-Economics 37, no. 5 (2008): 2020-2033.
Durlauf, Steven N.. "On The Empirics Of Social Capital*." The Economic
Journal 112, no. 483 (2002): F459-F479.
Ferlander, Sara. "The Importance Of Different Forms Of Social Capital For
Health." Acta Sociologica 50, no. 2 (2007): 115-128.
Knack, Stephen, and Philip Keefer. "Does Social Capital Have An Economic
Payoff? A Cross-Country Investigation." The Quarterly Journal of
Kwak, Nojin, Dhavan Shaw, and R. Lance Holbert. "Connecting, Trusting, and Participating: The Direct and Interactive Effects of Social Associations."
Political Research Quarterly 57, no. 4 (2004): 643-652.
Piazza-Georgi, Barbara. "The role of human and social capital in growth:
extending our understanding." Cambridge Journal of Economics 26, no. 4
(2002): 461-479.
Persell, Caroline, Adam Green, and Liena Gurevich. "Civil Society, Economic
Distress, and Social Tolerance." Sociological Forum 16, no. 2 (2001):
203-230.
Putnam, Robert D.. "Bowling Alone: America's Declining Social Capital."
Journal of Democracy 6, no. 1 (1995): 65-78.
Putnam, Robert D.. Bowling alone: the collapse and revival of American
community. New York: Simon & Schuster, 2000.
Rupasinha, Anil, Stephan J. Goetz, and David Freshwater. "Social Capital and
Economic Growth: A County-Level Analysis." Journal of Agricultural
and Applied Economics 32, no. 3 (2000): 565-572.
Staton, Jeffrey K., Robert A. Jackson, and Damarys Canache. "Dual Nationality Among Latinos: What Are the Implications for Political Connectedness?"
The Journal of Politics 69, no. 02 (2007): 470-482.
Temple, Jonathan, and Paul A. Johnson. "Social Capability and Economic
Growth." The Quarterly Journal of Economics 113, no. 3 (1998): 965-990.
Timpone, Richard J.. "Ties That Bind: Measurement, Demographics, and Social
Connectedness." Political Behavior 20, no. 1 (1998): 53-77.
UNC Center for HPDP. "About the Project." Heart Healthy Lenoir.