Cross-Sectional Study in Robeson County, NC
By
Madhulika Vulimiri
Honors Thesis
Department of Health Policy and Management University of North Carolina at Chapel Hill
April 2014
Introduction
Type 2 diabetes is a growing epidemic in the United States, and already affects
25.8 million Americans (8.3%) in 2011.1 The prevalence of type 2 diabetes has nearly
tripled from 1990 to 2010 and is projected to increase.2 If this pattern continues, the
Centers for Disease Control and Prevention (CDC) estimates that one-third of Americans
will have type 2 diabetes by 2050.3 In North Carolina, this problem is particularly acute;
the state has the 13th highest prevalence of diabetes at 9.8% of the general population.4
Robeson County—a rural area with a large American Indian population of Lumbee
descent—has shown dramatically higher diabetes prevalence than the rest of the state, at
13.7%.5 The high prevalence of diabetes in Robeson County raises significant concerns
about the long-term health status its residents.
Research has shown that lifestyle modifications, including dietary changes, can
reduce the development of diabetes, as well as the need for treatment of existing
diabetes.6 Unfortunately, rural areas tend to have a dearth of healthy food retailers, such
as supermarkets, while boasting a plethora of fast food options.7 Due to various
barriers—such as distance to, and price of, healthy food options—low-income and
minority groups living in rural areas are even less likely to have consistent access to
healthy, affordable food.8,9,10 Without a healthy diet, it can be challenging for individuals
to achieve optimal control over diabetes risk factors, such as A1c level, blood pressure
level, and body mass index (BMI).11 Over time, poor eating behaviors can heighten one’s
risk for developing diabetes, or experiencing diabetes-related complications such as
food options in Robeson County to inform future intervention and policy action to
reverse diabetes trends in this area.
While many individuals living in rural areas lack access to healthy food options
and are subsequently at risk for developing diabetes, low-income and minority groups
face even higher risk for diabetes morbidity and mortality.13 Minority groups are
disproportionately represented among the poor, and low socioeconomic status is often
associated with limited access to affordable, healthy food.14 Robeson County, with nearly
30% of individuals in poverty,15 and nearly 40% of individuals of American Indian
descent,16 has many residents that are particularly vulnerable to the risk factors that cause
diabetes. At present, little is known about the specific interaction between geographic
access to healthy foods and diabetes in a predominantly rural, low-income, and minority
area, such as Robeson County.
Researchers have begun using Geographic Information Systems (GIS) mapping
technology to explore the food environment, as it offers the benefit of visually
determining ‘food activity spaces,’ the geographic locations and variety of food outlets at
which individuals shop.17 The impetus for using GIS in Robeson County came from the
CEO of Robeson Health Care Corporation (RHCC), a federally qualified health center
with four clinics serving patients in Robeson County. This research aims to use GIS to
better understand the relationship between food access and various diabetes-related risk
factors in Robeson County, North Carolina in order to ultimately inform community
Research Questions
• How is geographic distance to food outlets associated with uncontrolled diabetes
(represented by A1c > 9%, SBP > 140 mmHg, and BMI > 30)?
• How far does the sample of patients live from food outlets in Robeson County?
• How many food outlets are in Robeson County?
• Is there a bivariate correlation between BMI and A1c, BMI and SBP, and A1c
and SBP?
Hypotheses
I hypothesize the following:
• The distance from patients’ home (proximity) to the closest chain supermarket
will be positively associated with A1c level such that greater distance will be
associated with a higher A1c level, higher BP, and higher BMI.
• The proximity from the patients’ home to the closest fast-food restaurants will be
inversely associated with A1c level such that greater distance will be associated
Literature Review
Diabetes among vulnerable groups
Type 2 diabetes is a metabolic disease characterized by abnormally high levels of
blood glucose, which result from a defect in insulin production, insulin action, or
both.18,19 Many factors can increase one’s risk for type 2 diabetes, including
race/ethnicity, old age, obesity, family history of diabetes, poor diet, and physical
inactivity.20 Type 2 diabetes is a major cause of morbidity and mortality in the United
States. Not only is it a key risk factor for heart disease and stroke,21 but, left uncontrolled,
type 2 diabetes can result in severe health complications, such as kidney failure,
blindness, and amputation of limbs.22 It is also the seventh leading cause of death, with a
national age-adjusted mortality rate of roughly 21.5 deaths per 100,000 individuals in
2011.23
In addition to posing significant health risks, diabetes is a costly disease, both to
individuals and to society at large. The American Diabetes Association estimates that the
total cost of diagnosed diabetes (type 1 or 2) was $245 billion in 2012, which breaks
down to $176 billion in direct medical costs and $69 billion in reduced productivity.24 A
2013 study found that the average lifetime cost of type 2 diabetes was $85,200, of which
roughly half were attributed to treating diabetes-related complications.25 The growing
prevalence of type 2 diabetes thus poses a significant health policy concern in the United
States.
Currently, type 2 diabetes affects 25.8 million Americans, which is roughly 8.3%
of the population.26 The Centers for Disease Control and Prevention have identified a
diabetes.27 People who live in the diabetes belt, which spans 15 states (including North
Carolina), are more likely to have type 2 diabetes than people who live in other parts of
the country. 28 The burden of this disease, in both North Carolina and the United States,
falls disproportionately on minority and low-income populations.29 In 2010, the national
age-adjusted diabetes prevalence was 16.1 per 1,000 American Indians/Alaskan Natives,
12.6 per 1,000 in African Americans, 11.8 per 1,000 Hispanics/Latinos, and 7.1 per 1,000
Non-Hispanic Whites.30 These populations may face barriers to controlling diabetes as a
result of cultural and socioeconomic factors, language barriers, and poorer access to
consistent, quality care.31
In Robeson County, North Carolina, diabetes prevalence has gradually increased
each year from 2002 (7.9%), the first year in which data was collected, to 2010 (13.7%),
the most recent data available.32 The prevalence of diabetes in Robeson County is
currently higher than both the North Carolina and national average.33 In 2011, diabetes
was the fourth leading cause of death in Robeson County.34 The age-adjusted death rate
from diabetes in Robeson County, at 54.5 per 100,000, is more than double the average
rate for North Carolina, 23.6 per 100,000.35 Moreover, the burden of the disease falls
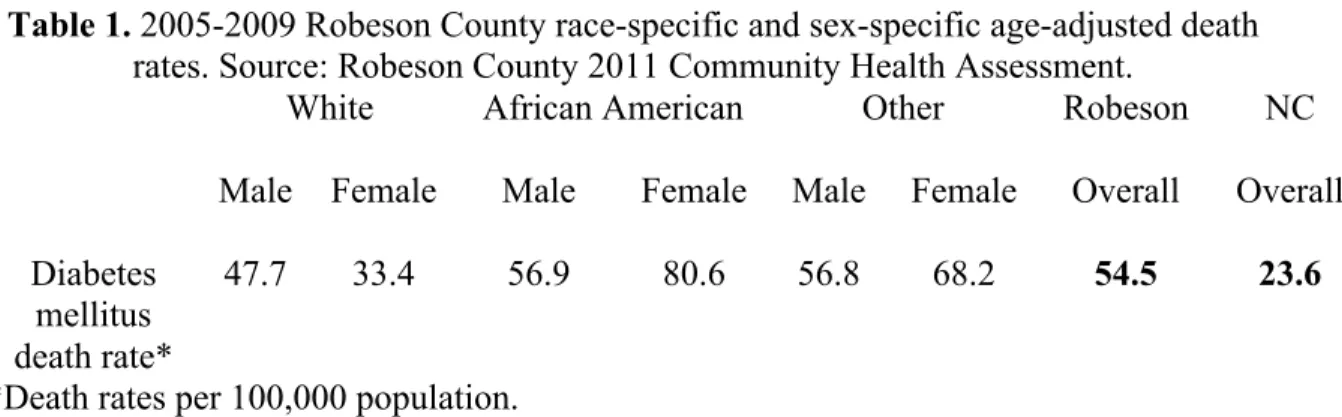
largely along racial and socioeconomic lines. As seen in Table 1, black females face the
highest risk for diabetes-related mortality; other minority females, such as American
Table 1. 2005-2009 Robeson County race-specific and sex-specific age-adjusted death rates. Source: Robeson County 2011 Community Health Assessment.
White African American Other Robeson NC
Male Female Male Female Male Female Overall Overall
Diabetes mellitus death rate*
47.7 33.4 56.9 80.6 56.8 68.2 54.5 23.6
*Death rates per 100,000 population.
Robeson County has a unique racial/ethnic composition as a majority-minority
county that is home to the Lumbee American Indian tribe.37 American Indians, of
Lumbee descent, comprise the largest racial/ethnic group (39.0%), followed by
Non-Hispanic Whites (32.8%), African Americans (24.7%), Non-Hispanic/Latinos (8.2%), and
Asians (0.8%), with an overall population of 135,496 in 2012.38 Roughly 30% of
Robeson County residents live in poverty, making Robeson one of the poorest counties in
North Carolina.39 This distinctive mix of socioeconomic factors makes Robeson County a
key area to understand the factors influencing diabetes prevention and treatment.
Food access in minority, low-income, and rural areas
The public health and medical communities have long established that
maintaining a healthy diet, participating in regular physical activity, not smoking, and
adhering to prescribed medicine regimens are key behaviors for chronic disease
management, especially with diabetes.40 Healthy eating is especially vital to regulating
blood sugar levels and properly managing diabetes.
Diabetes patients commonly undergo an A1c test to gauge how well they are
managing their diabetes. The A1c test is a blood test that reflects a patient’s average
blood glucose level for the past two to three months.41,42 The test measures the percentage
with sugar.43 A higher A1c level indicates poorer blood glucose control and higher risk
for diabetes-related complications.44 A normal A1c level for an individual without
diabetes ranges from 4.5% to 6%.45
Historically, healthcare providers have focused on controlling diabetes by
reducing patients’ A1c levels to 7% or less.46 Recent research suggests, however, that
“intensive glucose control,” or reducing A1c levels to less than 6.5%, may not benefit
middle-aged patients with type 2 diabetes, and may actually result in adverse
cardiovascular events, such as heart attacks.47,48 Nevertheless, ensuring that A1c is
roughly near 7% is still an important goal of diabetes control. A1c control is important—
every percentage point reduction in mean A1c correlates with a 37% reduction in risk of
microvascular complications (e.g. diabetic nephropathy, neuropathy, and retinopathy) and
a 21% reduction in risk of diabetes-related end point and deaths.49
Additionally, providers monitor blood pressure levels and BMI, which are both
significant risk factors for developing type 2 diabetes as well as developing
diabetes-related morbidities. Blood pressure control is particularly important, as risk of ischemic
heart disease and stroke increases progressively and linearly starting at blood pressure
levels as low as 115/75 mmHg.50
In order to maintain a healthy A1c level, blood pressure level, and body weight,
the American Diabetes Association has long recommended that individuals with diabetes
should consume low-fat, high-fiber foods, such as fruits, vegetables, and whole grains in
order.51 Recent investigations might alter this conventional recommendation, and suggest
that diabetics should consume “healthy” fats (e.g. olive oil, nuts), as found in a
research needs to be done to determine whether or not to expand the definition of a
“healthy diet,” there is consensus that a diabetes diet should include a variety of
nutritious foods in moderate amounts and sticking to regular mealtimes.53
It can be particularly challenging to maintain a healthy diet in the modern food
environment in the United States. The well-established presence of processed and
convenient food in many settings, like schools, workplaces, and stores, presents one
challenge.54 Families are also increasingly eating meals away from home.55 Finally, there
has been an exodus of supermarkets from and influx of fast-food restaurants into
low-income areas.56 Keeping up with a diabetes-friendly diet can be even more difficult for
individuals who live in low-income, minority, or rural communities with limited access to
healthy food.57
Many parts of the United States are still deeply divided by socioeconomic status.
Residential segregation by race and income often has significant consequences for where
food outlets decide to locate their businesses.58 Minority and low-income areas are more
likely to be “food deserts,” which are defined as “areas without ready access to fresh,
healthy, and affordable food.”59 Food deserts can refer to a literal absence of food sold in
a defined area, but can also refer to differences in “accessibility to healthy and affordable
food between socioeconomically advantaged and disadvantaged areas.”60 A 2009
systematic review of food deserts found clear evidence that predominantly low-income or
African American residential areas were less likely to be served by food retailers
compared to more affluent, predominantly white areas.61 Another study found that half of
all black neighborhoods in the United States lack full-service grocery stores and
low cost.62,63 Often, these regions tend to also have many fast food restaurants and
convenience stores that sell energy-dense or “empty calorie” foods in excess.64 Recently,
Rose et al. who studied urban food access in New Orleans termed these areas “food
swamps,” or “areas in which large relative amounts of energy-dense snack foods inundate
healthy food options.”65
Disparities in food access are exacerbated in rural areas, which tend to have
limited, more expensive food outlets66 (including more convenience stores67 and fewer
supermarkets68) compared to urban or suburban areas. Sharkey (2009) notes that rural
food environments are more likely to have convenience stores (with or without gas
stations), non-traditional food stores (such as drug stores with food), and sometimes,
conventional stores (such as supermarkets and grocery stores).69 Some rural areas have
few or no supermarkets for many miles.70 A systematic review of 54 studies between
1985 and 2008 found that people who live in rural, low-income, or minority communities
are less likely to have access to supermarkets, chain grocery stores, or healthy food
products.71 A national study representing 28,000 zip codes found that there were 14%
fewer chain supermarkets in rural and farm areas, as compared to urban areas.72 Healthy
foods are likely to be in short supply in rural areas; this may influence the food choices of
minority and low-income individuals with diabetes.73
It is clear that geography, among other factors, can determine one’s access to
healthy, affordable food. In the last decade, researchers have begun to use geographic
analysis (through the use of GIS mapping and other tools) to visualize the local food
environment. A systematic review of articles measuring the community-level food
the density and type of food outlets within a specific area, (2) “proximity,” the nearest
distance to food outlets, or (3) “variety,” the overall availability of different types of food
outlets, as well as their price and quality.74 Another way to examine “diversity” is to look
at “coverage,” or counts, of food venues in buffers of different sizes.75 A study by Jilcott
et al. (2011) examined the association between various measures of food venue
accessibility and BMI percentile, using measures of proximity and coverage.76 In 2013,
Jilcott et al. used GIS to explore the relationship between access to farmers’ markets and
supermarkets and health indicators among low-income women in North Carolina.77 They
measured access by examining proximity, but specifically looking at (1) the distance to
the closest food outlet to the residential location, and (2) the mean distance travelled to
the food outlets where women reported shopping. There is growing evidence that food
access is associated with race/ethnicity, socioeconomic status, and location, but there is
limited research about how geographic food access impacts diabetes health outcomes.
Relevance for Robeson County
Robeson County is a primarily rural county, with a small urban center
(Lumberton) as its county seat, and a large public university close to the urban center
(University of North Carolina-Pembroke). Lumberton is classified as “urban” by the
Census, because it has a population density greater than 1,000 people per square mile;78,79
in comparison, the population density of Robeson County is 141.3 persons per square
mile.80
Given that Robeson County has a unique racial/ethnic composition and rural
classification, it is a key area for the study of food access in the context of diabetes
134,168 residents) of Robeson County’s residents live in food deserts, defined as
“low-income census tracts where at least 33% of the tract’s population lives more than 10
miles away from a supermarket or large grocery store.”81 County Health Rankings show
that 55% of all restaurants in Robeson County are fast food establishments.82 Moreover,
the percentage of adults in Robeson County who consume the recommended 5 or more
servings of fruits and vegetables per day is less than that of North Carolina (16.2% vs.
20.6%).83 While cultural practices and food preferences may influence healthy eating
behaviors, a thorough understanding of food access is also important to diabetes
Methods
Research design
This study used a cross-sectional design, which examines a specific population
over a short period of time by measuring the exposure prevalence in relation to the
disease prevalence.84 Through a secondary data analysis, the study used GIS mapping
capabilities in the open-source R Statistical Programming Language to analyze existing
patient data collected from 2010 to 2011.85 GIS tools provide researchers the ability to
map community-level variables to show spatial relationships between health predictors
and outcomes.86 When combined with quantitative analysis, GIS tools can lead to the
development, implementation, monitoring, and evaluation of community interventions
that can positively influence public health.87
Data collection
This study used patient data from 2010-2011 that was abstracted from electronic
medical records by the Robeson Health Care Corporation (RHCC). This dataset includes
patients’ most recent A1c level, SBP level, and BMI. In the dataset, patients’ A1c levels
are categorized as “strict control” (under 7), “control” (7 to 8), “borderline control” (8 to
9), and “uncontrolled” (over 9).
Previously geocoded and anonymized patient addresses were imported into the
open-source R Statistical Programming Language, along with the associated patient data
(i.e. A1c, BP, and BMI). Due to limited time to explore the entire food environment in
Robeson County, this research study focused specifically on access to supermarkets, fast
food restaurants, convenience stores, and farmers’ markets. Food outlet addresses were
(www.referenceusa.com) and (2) ascertaining uncertain addresses by ground-truthing, the
process of verifying a satellite image with what is already known about the location on
the ground.88 Because commercial data is not always accurate, all addresses were verified
through telephone calls to confirm that businesses were currently operating, and web
searches and Google Maps Streetview function to confirm their existence.
The addresses of all food outlets were converted to GPS coordinates and verified
using Texas A&M Geocoding Services. Food venues were separated into the following
categories: supermarkets (including grocery stores), fast food restaurants, convenience
stores, and farmers’ markets (including produce stands). ReferenceUSA was used to
classify food outlets according to the following North American Industry Classification
System (NAICS) codes: 72221101/3/4/5 = fast-food restaurants, 44511001/2/3/4/5 =
supermarkets and grocery stores, and 452910 = supercenters and discount clubs.89
The addresses were converted to GPS coordinates, verified, and imported into R
software. This study quantified patients’ access to food outlets by calculating the
‘proximity’ or distance to the closest food outlet, following a similar methodology
outlined by Rose et al.90 and performed by Jilcott, et al.91 The R software will calculate
the Euclidean distance (straight line, from point A to point B) to closest food outlets
using the sp package.92,93,94 Distances were divided into cutpoints of 1 mile for
convenience stores and 2 miles for fast food restaurants and supermarkets because these
reflected the mean distances to food outlets. Previous studies of food access have also
used the 1-mile and 2-mile measures of proximity based on the expectation that food
outlets could be reached by motor vehicle in a short period of time.95,96
In this analysis, “fast food restaurants” includes chain fast food restaurants as well
as local drive through restaurants. “Supermarkets” include both chain supermarkets and
small grocery stores, which generally have a wide selection of food.97 “Convenience
stores” include those that are attached to gas stations, those that standalone, food marts,
and Hispanic tiendas. Convenience stores typically sell a limited selection of goods such
as milk, bread, soda, and snacks.98 It is important to note that, while the majority of
convenience stores only sell nonperishable foods, some do additionally offer hot food,
such as hamburgers, hot dogs, and wings, prepared on a grill. “Farmers’ markets” include
both farmers’ markets and roadside produce stands.
Participants and sampling methods
This research study focused specifically on patients who receive healthcare
services from Robeson Health Care Corporation (RHCC) in Robeson County. RHCC is a
private, non-profit federally qualified health center that provides primary and
preventative healthcare services to patients in the counties of Robeson, Columbus,
Scotland, Montgomery, Moore, Johnston, and Pitt. The sample was limited to patients
who met two criteria: (1) they have had at least once visit to any of the four clinical sites
belonging to RHCC in Robeson County (in the towns of Pembroke, Lumberton, Maxton,
and Fairmont), and (2) they received a type 2 diabetes diagnosis code sometime between
2010 and 2011 (N = 1,780). Because type 2, or “adult onset,” diabetes is the outcome of
interest, this study excludes patients who are pre-diabetic or who have type 1 diabetes.
There were 1,297 non-unique observations of patients in the dataset, meaning that there
the cohort represents a sample of diabetes patients who may have attended RHCC
multiple times between 2010 and 2011.
Conceptual model
In order to consider the potential confounders of distance to food outlets and A1c
level, I drew upon Directed Acyclic Graphs (DAGs) and conceptual models from existing
literature.99,100,101,102 DAGs are used to visually represent causal relationships between
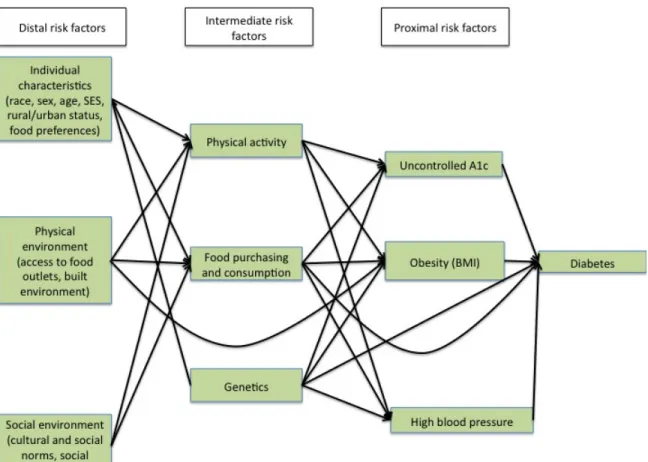
exposures, outcomes, and covariates and to identify potential confounders.103,104 Based on
the associations found between covariates in the literature, I created the conceptual model
seen in Figure 1.
Based on this conceptual model, I adjusted the logistic regression models to
account for additional covariates that are proximal, intermediate, or distal risk factors for
diabetes. This analysis measures the relationship between one aspect of the physical
environment (i.e. distance to food outlets) and various diabetes risk factors (i.e. A1c,
BMI, and SBP), seen in the first and third column of Figure 1. This analysis does not
adjust for the covariates that are intermediate risk factors in the second column, because
that information is not available.
Fig. 2. Stepwise logistic regression model-building process.
Model 1: Unadjusted [distance to closest fast food restaurant]
Model 2: Food outlet type [distance to closest convenience store + distance to closest farmers’ market]
Model 3: Model 2 + [BMI + SBP]
Model 4: Model 3 + [race + sex + rural status]
Models were run in a stepwise process in order to see whether associations
remained after adding covariates. The first model run observed the relationship between
distance to fast food restaurants and A1c, and was unadjusted for any covariates. The
second model adjusted for distance to closest convenience stores and distance to closest
farmers’ markets as independent variables to reflect the fact that one’s local food
environment is composed of a variety of food outlets and restaurants. Model 3 adjusted
for additional diabetes risk factors, such as BMI and SBP. Finally, model 4 adjusted for
individual characteristics, like race (specifically American Indian race), sex (specifically
controlled, for these covariates because there is evidence that obese body mass index
(BMI),105 high SBP,106 and uncontrolled A1c,107 as well as American Indian race,108 rural
location,109 and male gender110 are associated with increased prevalence of type 2
diabetes.
It is important to note that the logistic regression with BMI as an outcome did not
control for A1c or SBP because BMI is typically a predictor for A1c and SBP, and not
vice versa.
Data analysis methods
Pearson’s correlation coefficients were calculated to test associations between
BMI and SBP, A1c and SBP, and BMI and A1c (see Table 2A in appendix).
Multiple logistic regression analysis was used to test whether distance to various
food outlets were associated with several diabetes risk factors (i.e. A1c level, BMI, and
SBP) among diabetic patients in Robeson County, after controlling for covariates (such
as rural location, American Indian race, and male gender).111112 Multiple logistic
regression extends simple regression to allow for more than one regressor.113 In multiple
regression, the regression coefficients are called partial slopes, and they can only be
interpreted in the context of the other regressors in the model.114 Logistic regression was
chosen over linear regression for its utility in dividing the study population by cutpoints
that are clinically significant (e.g. A1c < 9%, BMI < 30, SBP < 140 mmHg). The
aforementioned covariates (i.e. rural location, American Indian race, and male gender)
were not available in the patient medical records and thus were derived at the block group
level from the American Community Survey of the 2010 U.S. Census.115 Block groups
economic data from the census are tabulated.116 They are continuous variables,
representing the percentage of each block group that is American Indian, rural, or male.
Statistical analysis was conduced using R statistical software.117 Associations
between variables were examined by analyzing bivariate scatterplots in R. Two-sided
significance was considered at p<0.05 and with the use of 95% confidence intervals.
Three bivariate analyses were conducted using multiple logistic regression. One
analysis examined A1c as an outcome, another examined BMI, and the third examined
SBP. The A1c variable was binary (less than 9%/greater than 9%). The cutpoint of 9%
was chosen in order to align with the cutpoints used by Robeson Health Care
Corporation, which uses the category of “A1c < 9%” and “A1c > 9%” when reporting
patient health outcome data to the federal government. The influence of each independent
variable (distance to fast food [binary, reference: less than 2 miles], distance to
supermarket [binary, reference: less than 2 miles], BMI [continuous], SBP [continuous],
probability of rural status [continuous], probability of male gender [continuous], and
probability of American Indian race [continuous]) on A1c level was measured using
logistic regression. With BMI as an outcome, the cutpoint of 30 was chosen to divide
patients into one group with normal BMI (less than 30), and another group that was obese
(BMI over 30). With SBP, the cutpoint of 140 was chosen to divide the patients into one
group with low blood pressure (less than 140 mmHg) and another group with high blood
pressure (greater than 140 mmHg).
Raw coefficient estimates were exponentiated to produce a crude odds ratio (OR),
and 95% confidence intervals were calculated for the OR estimates.118Odds ratios were
to food outlet and A1c level. Specifically, odds ratios were adjusted for potential
confounders that may have influence on A1c level, including sex,119 race, and rural
status.
Ethical considerations
Institutional Review Board approval was obtained from the University of North
Carolina at Chapel Hill for this study through a modification of an existing study. A
confidentiality business agreement between the researcher and Robeson Health Care
Results
This section begins by displaying the descriptive statistics of the study population.
Next, we display maps of Robeson County to visualize the study population. Then, we
show the count of food outlets by township. Then, we show the proportion of study
population that lives within various distances of the food outlets. Finally, we show the
results of multiple logistic regression models with A1c, BP, and BMI as outcomes.
Descriptive statistics of study population
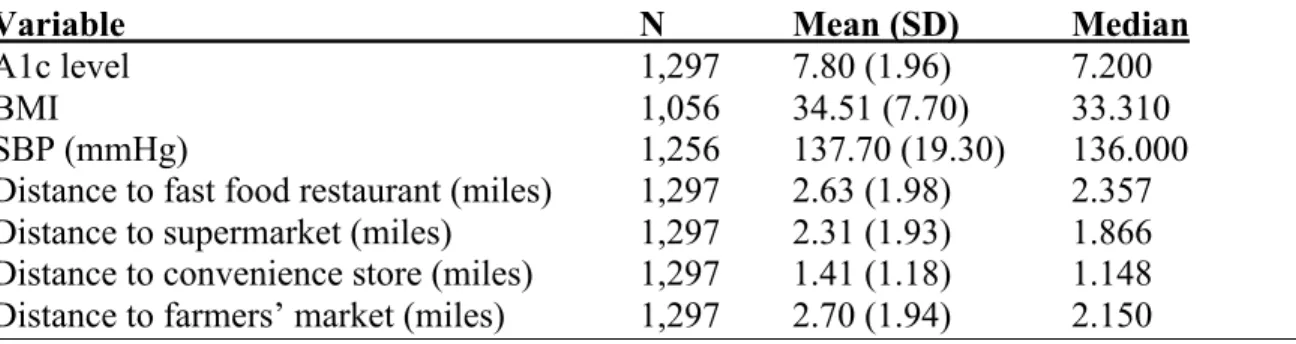
Table 2 reports the descriptive statistics of the sample of 1,297 type 2 diabetes
patients that had at least one visit to the Robeson Health Care Corporation between 2010
and 2011 (see Table 1A in the appendix for more descriptive statistics).
Of the 1,297 geocoded observations, the mean A1c was 7.80 (SD 1.96), which is
less than the HRSA Bureau of Primary Health Care’s target for “controlled A1c” of less
than or equal to 9%.120 Figure 2A in the appendix is a box-plot showing the distribution
of A1c levels among the study population. There are several outliers with A1c > 12%,
and the median A1c is roughly 7% (see Figure 2A).
Of the 1,056 patients with BMI data available, the mean BMI was 34.51 (SD 7.7),
which is considered obese.121 The mean SBP was 137.70 mmHg (SD 19.30), which is
just below the cutoff for high blood pressure (140 mmHg). The mean distances to food
outlets were as follows: fast food restaurant: 2.62 miles (SD 1.98); supermarket: 2.31
miles (SD 1.93), convenience store: 1.41 (SD 1.18), and farmers’ market: 2.70 (1.94).
Because some values were missing for BMI and SBP, the total number of values for each
Table 3 reports the descriptive statistics about the Robeson County population, as
collected from the American Community Survey of the United States Census Bureau
(2010). A significantly greater proportion of Robeson residents live in rural areas (62.6%)
than in urban areas.
Table 2. Descriptive statistics for individual-level variables of 1,297 patients with at least one visit at Robeson Health Care Corporation between 2010 and 2011
Variable N Mean (SD) Median
A1c level 1,297 7.80 (1.96) 7.200
BMI 1,056 34.51 (7.70) 33.310
SBP (mmHg) 1,256 137.70 (19.30) 136.000
Table 3. Descriptive statistics of aggregate-level variables for Robeson County from American Community Survey (U.S. Census Bureau, 2010).
Variable Value
Race/ethnicity (alone or in combination)
American Indian 35.9%
White 31.8%
Black 28.6%
Other 5.2%
Asian 0.99%
Hawaiian/Pacific Islander 0.16% Sex
Female 51.4%
Male 48.6%
Age
20-29 13.8%
30-39 13.1%
40-49 13.0%
50-59 12.9%
60-69 9.3%
70+ 7.4%
Age (different breakdown)
20-44 33.2%
45-64 25.1%
>65 11.2%
Residence
Urban 37.4%
Rural 62.6%
Family status
Family households* 70.7% Nonfamily households ** 29.3%
* households that have at least one member of the household related to the householder by birth, marriage, or adoption; includes same-sex couple households if there is at least one additional person related to the householder by birth or adoption
Maps of Robeson County and the study population
A map of Robeson County labeled with names of townships from the 2000 U.S.
Census can be found in the appendix (see Figure 1A).122 Figure 3 shows a map of
Robeson County overlaid with coordinates of the 1,297 patient observations, 85 fast food
restaurants, 46 supermarkets, 118 convenience stores, and 24 farmers’ markets. The
majority of fast food restaurants and supermarkets are concentrated in the townships of
Lumberton, Pembroke, Red Springs, Maxton, St. Pauls, and Fairmont. About 20 out of 29
townships did not have any fast food restaurants, while 18 out of 29 townships do not
have any supermarkets.
Figure 4 shows a map of Robeson County overlaid with patients, stratified by
their A1c level. Patients with A1c < 9% are represented by blue Xs, and patients with
A1c > 9% are represented by red Xs.
Figure 5 shows a map of Robeson County, overlaid with patients with A1c > 9%
and all the food outlets. There are clusters of patients with A1c greater than 9% residing
Count of food outlets
Table 4 shows the counts of supermarkets, fast food restaurants, convenience
stores, and farmers’ markets by municipality in Robeson County, respectively. Table 5
shows a comparison of count of chain supermarkets to count of all supermarkets.
Table 4. Count of fast food restaurants, supermarkets, convenience stores, and farmers’ markets by township.
Fast food restaurants
(N)
Supermarkets
(N) Convenience stores (N)
Farmers’ markets
(N)
Fairmont 3 3 9 2
Lumber
Bridge 0 0 2 0
Lumberton 56 24 52 7
Maxton 2 3 7 8
Orrum 0 0 3 0
Parkton 0 0 3 0
Pembroke 12 4 13 2
Red Springs 5 4 8 0
Rowland 1 1 5 2
Shannon 0 0 7 2
St. Pauls 6 7 9 1
Total 85 46 118 24
Table 5. Count of total and chain supermarkets in Robeson County by township.
Township Chain
supermarkets* (N)
All supermarkets (N)
Fairmont 2 3
Lumberton 12 24
Maxton 3 3
Pembroke 4 4
Red Springs 3 4
Rowland 0 1
St. Pauls 3 7
Total 27 46
Fig. 6. Count of food outlets in Robeson County by township.
3 0
56
2 0 0
12 5
1 0 6
3 0
24
3 0 0 4 4 1
0 7
9 2
52
7
3 3
13
8 5 7 9
2 0 7 8 0 0 2 0 2 2 1
0 10 20 30 40 50 60
Co
u
n
t o
f f
oo d o u tl et
s
Township
Count of food outlets in Robeson County
by township
Fast food restaurants (N) Supermarkets (N)
Proximity to food outlets for study population
Table 6 shows the cumulative percentage and cumulative frequency of the study
population that lives at various distances from food outlets (see appendix for histograms
of distances to various food outlets). Approximately 41%, 56%, and 75% live within 2
miles of a fast food restaurant, supermarket, and convenience store, respectively. The
minimum distance to closest fast food restaurants, supermarkets, convenience stores, and
farmers’ markets are 0.04 miles, 0.01 miles, 0.02 miles, and 0.07 miles, respectively; the
maximum distances are 9.8 miles, 9.8 miles, 5.98 miles, and 10.9 miles, respectively.
Convenience stores may be the most accessible food outlet for this study population, as
97% of the study population lives within 4 miles of a convenience store. Histograms
displaying distances from each food outlet are reported in the appendix.
Table 6. Cumulative percentage (%) of the study population that lives equal to or less than various distances from food outlets (N = 1,297).
Fast food restaurants
Supermarkets Convenience stores
Farmers’ markets Distance to
food outlet
Cumulative % Cumulative % Cumulative % Cumulative %
0.5 mile 13 14 26 3
1 mile 25 27 47 19
2 miles 41 56 75 47
Multiple logistic regression models
In this section, we report on the stepwise logistic regression models to illustrate
the stepwise process of adding covariates to the model (see Table 7). We also report on
the full logistic regression model, or model 4, (see Fig. 2 from “conceptual model”
section) for each outcome (A1c, BMI, and SBP) in Tables 8 and 9. Because distance to
closest fast food restaurant and distance to closest supermarket were highly correlated (r
= 0.80, p = 2.2e-16), they were not included in the same model to avoid the risk of
multicollinearity. Multicollinearity occurs when the correlations between independent
variables is strong; it can increase standard errors of the coefficients.123 Consequently,
separate logistic regression models were run with 1) distance to fast food restaurants as
the primary independent variable (Table 8), and 2) distance to closest supermarket as the
primary independent variable (Table 9). Both Tables 8 and 9 summarize the influence
that each independent variable has on the risk of having poor glycemic control (A1c >
9%), obesity (BMI > 30), or high blood pressure (SBP > 140 mmHg) in Robeson County,
respectively. We ran multiple specifications of covariates and found that the models were
robust. However, it is important to use caution when interpreting these results, as the
race, gender, and rural variables were estimated at an aggregate-level and thus, estimates
may not precisely represent the individuals in the study population.
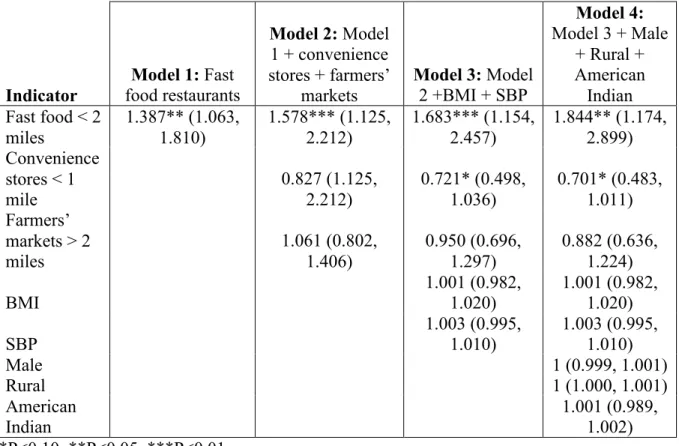
Table 7 presents the stepwise logistic regression model results when A1c is the
outcome, and distance to fast food restaurant is the primary independent variable. In
unadjusted analysis, the odds of having uncontrolled A1c are 38.7% higher for
individuals living within 2 miles of a fast food restaurant, compared to the odds for those
Table 8 presents the logistic regression model results when A1c is the primary
outcome, and distance to fast food is the primary independent variable. After controlling
for other covariates (distance to convenience store, distance to farmers’ market, AI, male,
rural, SBP, and BMI), the odds of having uncontrolled A1c are 88.4% higher for
individuals living within 2 miles of a fast food restaurant, compared to the odds for those
who live 2 miles or further away [OR = 1.844, CI: (1.174, 2.899), p<0.05, Table 8].
Additionally, the odds of having uncontrolled A1c are 29.9% lower for individuals living
within 1 mile of a convenience store, compared to the odds for those who live 1 mile or
further away [OR = 0.701, CI: (0.483, 1.011), p<0.10, Table 8]. Because the remaining
covariates (distance to convenience stores, BMI, SBP, American Indian race, male
gender, and rural location) failed to reach the 5% significance level, we retain the null
Table 7. Stepwise logistic regression results using models 1, 2, 3, and 4 from the conceptual model, with A1c as outcome and distance to closest fast food restaurant as primary independent variable.
Indicator
Model 1: Fast food restaurants
Model 2: Model 1 + convenience stores + farmers’
markets
Model 3: Model 2 +BMI + SBP
Model 4: Model 3 + Male
+ Rural + American Indian Fast food < 2
miles 1.387** (1.063, 1.810) 1.578*** (1.125, 2.212) 1.683*** (1.154, 2.457) 1.844** (1.174, 2.899) Convenience
stores < 1 mile 0.827 (1.125, 2.212) 0.721* (0.498, 1.036) 0.701* (0.483, 1.011) Farmers’
markets > 2 miles 1.061 (0.802, 1.406) 0.950 (0.696, 1.297) 0.882 (0.636, 1.224)
BMI 1.001 (0.982, 1.020) 1.001 (0.982, 1.020)
SBP
1.003 (0.995, 1.010)
1.003 (0.995, 1.010)
Male 1 (0.999, 1.001)
Rural 1 (1.000, 1.001)
American Indian
Table 8. Logistic regression results using full models with A1c, BMI, and SBP as outcomes, and distance to closest fast food restaurant as the primary independent variable.
A1c > 9 BMI > 30 SBP > 140 OR (95% CI) OR (95% CI) OR (95% CI) Fast food restaurants < 2 miles 1.844** (1.174, 2.899) 1.006 (0.671, 1.511) 1.039 (0.948, 1.138) Convenience
stores < 1 mile 0.701* (0.483, 1.011) 0.948 (0.687, 1.310) 1.001 (0.930, 1.077) Farmers’
markets > 2 miles 0.882 (0.636, 1.224) 1.054 (0.785, 1.413) 1.029 (0.964, 1.100)
A1c - - 0.996 (0.981, 1.012)
BMI
1.001 (0.982,
1.020) -
1.003* (0.999, 1.007)
SBP
1.003 (0.995,
1.010) - -
Male 1 (0.999, 1.001) 1.000 (0.999, 1.001)
1.000 (1.000, 1.000)
Rural 1 (1.000, 1.001)
1.000 (1.000, 1.000)
1.000 (1.000, 1.000) American
Indian 1.001 (0.989, 1.002) 0.945 (1.000, 1.012) 1.001 (0.999, 1.002) *P<0.10, **P<0.05, ***P<0.01
Table 9. Logistic regression results using full models with A1c, BMI, and SBP as outcomes, and distance to closest fast food restaurant as the primary independent variable.
A1c > 9 BMI > 30 SBP > 140 Supermarkets
> 2 miles 0.919 (0.628, 1.348) 1.060 (0.752, 1.494) 0.967 (0.700, 1.338) Convenience
stores < 2 miles
0.867 (0.621,
1.206) 0.949 (0.708, 1.274) 1.061 (0.800, 1.406) Farmers’
markets > 2 miles 0.861 (0.603, 1.231) 1.028 (0.743, 1.419) 1.123 (0.827, 1.528)
A1c - - 0.987 (0.924, 1.053)
BMI 1.001 (0.982, 1.021) - 1.014* (0.997, 1.030)
SBP
1.003 (0.995,
1.011) - -
Male 1.000 (1.000, 1.001) 1.000 (1.000, 1.001) 1.001* (1.000, 1.001)
Rural 1.000 (1.000, 1.001)
1.000 (1.000, 1.000) 1.000 (0.999, 1.000) American Indian 0.996 (0.990, 1.003) 1.006** (1.000, 1.012) 1.003 (0.997, 1.009) *P<0.10, **P<0.05, ***P<0.01
Note: The dependent variables in these analyses are A1c coded so that 0 = A1c > 9% and 1 = A1c < 9%; BMI coded so that 0 = BMI > 30 and 1 = BMI < 30; and SBP coded so that 0 = SBP > 140 mmHg and 1 = SBP < 140 mmHg.
When obesity (BMI > 30) was the outcome, we did not observe that distance to
closest fast food restaurant (Table 8) or distance to closest supermarket (Table 9) or other
covariates had an effect on BMI predictions. Table 9 shows that, when distance to closest
supermarket was the primary independent variable, the covariate of American Indian race
was statistically significant (p<0.05). This may suggest that a one-unit increase in the
percentage of American Indian residents per block group is associated with an increase of
(1.000, 1.012), Table 9]. However, this odds ratio is not clinically meaningful enough to
warrant further discussion.
Similarly, when systolic blood pressure (SBP > 140 mmHg) was the outcome, we
did not observe that distance to closest fast food restaurant (Table 8) or distance to closest
supermarket (Table 9) or other covariates had a statistically significant effect on BMI
predictions.
Discussion
The purpose of this study was to investigate whether or not there is a relationship
between proximity to various food outlets and diabetes risk factors among type 2 diabetes
patients in Robeson County, North Carolina.
We found that type 2 diabetes patients who live within 2 miles of fast food
restaurants have slightly greater odds than other type 2 diabetes patients of having
uncontrolled A1c, but do not have significantly higher odds of being obese or having
high blood pressure. In contrast, type 2 diabetes patients living within 1 mile of a
convenience store had slightly lower odds than other type 2 diabetes patients of having
uncontrolled A1c.
We found no relationship between A1c levels and proximity to supermarkets,
convenience stores, or farmers’ markets. However, the relationship between A1c and
proximity to fast food restaurants remained even when we added other food outlets to the
analysis. We also found no relationship between proximity to any of the food outlets (fast
food restaurants, supermarkets, convenience stores, and farmers’ market) and BMI or
SBP.
While evidence exists to suggest a positive association between A1c and high
blood pressure, recent studies suggest that this relationship is diminished with the
adjustment for BMI.124 This suggests that the relationship between BMI and blood
pressure may be of more importance than the relationship between A1c and blood
pressure. Past literature shows that BMI and blood pressure are usually have a positive
association.125,126,127,128 Our study was consistent with the literature in finding that the
Similarly, we noted that there was a positive correlation between A1c and blood pressure,
but it was also very weak.
There is also evidence that BMI is positively associated with A1c,129,130 and that
BMI reduction is associated with A1c reduction.131 Again, our study was consistent with
the literature in finding that the correlation between BMI and A1c was positive, albeit
very weak and not statistically significant.
The weak correlations between BMI and SBP, and BMI and A1c could be
attributed to the presence of outliers in the dataset (i.e. many patients with extremely high
BMIs that ranged from 50 to 70). It is known that weight loss is more difficult for type 2
diabetes patients compared to non-diabetic patients, which could explain why there are so
many patients with very high BMIs in this study population.132 Additionally, it is possible
that patients may be taking medication to control their A1c, but are still obese due to lack
of physical activity, poor diet, genetics, or some combination of those factors. Future
research should explore specifically why the correlations between these variables in this
study population are so weak.
Food environment
Our findings are not consistent with the literature that suggests that rural residents
tend to live more than 10 miles from the nearest supermarket.133 Instead, our study found
that patients in the study population live, on average, 2.3 miles from the nearest
supermarket. Our findings are consistent with Sharkey et al.’s study of the food
environment in rural Texas, which found that distance to the nearest convenience store,
which they call “non-traditional fast food outlet,” was closer than distance to the nearest
miles from a fast food restaurant and 1.5 miles from a convenience store, which is less
distance than in Sharkey et al.’s study.135 The maximum distance to a fast food restaurant,
supermarket, or farmers’ market was 10 miles, but over 75% of the sample lived within 4
miles of all food outlets.
Although the mean distance to the closest fast food restaurant was slightly higher
than mean distance to the closest supermarket, there were nearly twice as many fast food
restaurants in the county as there were supermarkets, and nearly 4 times as many fast
food restaurants as farmers’ markets. Despite the fact that many patients do live
geographically nearby to many food outlets, it is important to note that there are nearly
2.5 times as many fast food restaurants as there are supermarkets in Lumberton, and 3
times as many fast food restaurants as there are supermarkets in Pembroke. Lumberton
has the most supermarkets and the most fast food restaurants of all the municipalities in
Robeson County. However, there more than double the number of fast food restaurants as
there are supermarkets. Pembroke also has three times as many fast food restaurants as
supermarkets, though there are fewer overall food outlets than in Lumberton.
We found that convenience stores may be the most accessible food outlets for this
sample population in Robeson County. Some evidence exists that convenience stores are
less likely to sell foods that are recommended for diabetics, such as low-fat milk,
high-fiber bread, or fresh fruits and vegetables.136 Instead, they commonly sell foods that are
high-caloric, low-nutrient foods. There is potential for public health practitioners to
intervene at the convenience store level by working with storeowners to introduce
in increasing access to fruits and vegetables in convenience stores, corner stores, and
Hispanic tiendas.137,138,139
Comparison with other studies
Our findings are consistent with past evidence supporting the idea that proximity
to fast food restaurants is associated with unhealthy behaviors and poor health outcomes
(such as A1c level). Rothman et al. found that fast food consumption, for which
proximity is a proxy, is associated with uncontrolled A1c level among adolescents.140
Although our results did not show a relationship between proximity to fast food
and BMI, several studies have documented these relationships.141,142,143,144 However,
there are mixed results about the relationship between these variables; one systematic
review found six studies that found associations, and four studies that found no
association.145 Giskes et al. suggests that the macro-level food environment, which has
been defined as “access to food venues such as supermarkets and fast food
restaurants,”146 may be a causal factor—albeit distal—in the pathway to poor diet and
obesity.147
Our result that proximity convenience store is associated with better health
outcomes (i.e. A1c control) is not consistent with past research that examined this
association.148,149 Further research is needed to better understand why proximity to
convenience stores may be associated with better A1c control. Additionally, our finding
that proximity to supermarkets is not associated with reduced obesity is inconsistent with
previous studies, which did find existence of an association.150,151
When providing care to patients with type 2 diabetes or related metabolic
disorders, primary care providers should inform patients about the need for a healthy diet.
Specifically, patient education can include information relevant to Robeson County
regarding details such as locations of healthy food outlets or contact information for
farmers’ markets and produce stands. As there are several supermarkets and farmers’
markets in Robeson County, particularly in Lumberton, clinicians should encourage their
at-risk patients to shop for healthier food options at these locations and avoid unhealthy
foods from fast food restaurants or convenience stores. Primary care practices can also
employ community health workers (CHW) to provide dietary counseling. Studies have
shown that interventions with CHW support can improve dietary behavior scores152 and
increase the number of patients eating five fruits and vegetables per day.153 However, it
is important to note that practices may not be able to afford this type of personalized
counseling.
Implications for policy-makers
This study has several implications regarding zoning decisions for policy-makers
to consider. Understanding the geography of diabetes distribution can help public health
practitioners prioritize where to implement healthy food and physical activity
interventions. For example, given that Lumberton is the municipality with both the
largest population and also the highest number of fast food restaurants in the county, the
Robeson County Health Department could focus on launching public health programs in
Lumberton. Local officials in Robeson County could consider a range of policy options
to reduce unhealthy food consumption, from levying fees on stores that sell
Given that there is less access to farmers market compared to other food outlets,
Robeson County policy-makers can improve zoning ordinances in a manner that
increases access to farmers markets and produce stands. According to unpublished data,
Robeson County has six municipalities that have received a healthful food zoning (HFZ)
score, which is calculated by evaluating various elements of the zoning ordinance that are
supportive of healthful food outlets.156 Municipalities with zoning ordinances that permit
healthful food outlets, such as farmers’ markets and produce stands, received more points
than municipalities that prohibited them.157 HFZ scores ranged from 0 to 1, with a higher
score indicating healthier food zoning.158 HFZ scores range from 0.14 (Rowland) to 0.48
(Raeford), with this order from lowest to highest HFZ score: Rowland, St. Pauls,
Lumberton, Fairmont, Pembroke, and Raeford.159 The mean HFZ score for Robeson
County is 0.21,160 which is below the regional average of 0.33 from northeastern North
Carolina counties.161 Unpublished data suggests that the existence of farmers’ markets
and produce stands is often prohibited in residential zones, but is often permitted in
agricultural zones and sometimes in commercial or industrial zones.162 Local health
department officials should take steps to improve the HFZ score for Robeson County in
order to promote access to healthy food. Further research is needed to determine whether
there are specific zoning ordinances in Robeson County that prohibit healthful food
outlets like farmers markets or produce stands, and whether zoning is strictly enforced
throughout the county.
Limitations
There are a few limitations based on the study design. Because this was a
in Robeson County. As a clinic-based sample, this study does not account for patients
with type 2 diabetes who receive care at other clinics nor those who do not receive any
care. Moreover, because this was an observational study, we cannot conclude that the
reported associations between proximity to fast food restaurants and uncontrolled A1c
control are causal.
The dataset used for this analysis poses some additional limitations. The outcome
measures (A1c, blood pressure, and BMI) used for this study are from 2010-2011, and
thus findings may not represent the most recent measures from Robeson Health Care
Corporation patients. Another limitation is that some patients may have attended the
clinic more than once between 2010 and 2011, and thus there may be multiple records of
A1c, BMI, and blood pressure for one patient. Potential bias may have been introduced
by the multiple observations, as this violates the statistical assumption of independence.
Effectively, the presence of multiple observations may skew the logistic regression data
in the direction of the values of the multiple observations.
There are a few limitations related to the outcome variable of A1c, which has
limits as a measure of diabetes control. Although A1c provides a more stable measure of
diabetes control than fasting glucose measures,163 a limitation is that A1c levels may vary
when tested in one lab compared to another.164 Furthermore, A1c may be falsely low for
individuals who experience heavy or chronic bleeding, or had a recent blood transfusion;
conversely, A1c may be falsely high for individuals who do not have enough iron in their
bloodstream.165
With spatial data analysis, direct observation of locations (i.e. food outlets) is
conducted ground-truthing via telephone calls and web searches. Moreover, it is
important to note that ReferenceUSA, the public database used to retrieve food outlet
addresses, may not be comprehensive, or may over- or underestimate the number of food
outlets present in Robeson County.167
There are several limitations to only using proximity as a measure of food access.
Other studies that evaluate food access have also examined ratio,168 density, and coverage
of food outlets.169,170 Proximity is one predictor of food access among many other
complex predictors—including individual food preferences, access to transportation, cost
of food, availability of food, and ability to prepare and cook healthy food—that are not
accounted for in this study. GIS data can yield significant information about the food
environment, but it seldom sheds light on consumer behavior. Proximity to certain food
outlets does not necessitate that an individual will purchase food from or eat at that
location. As such, proximity to supermarkets or farmers’ markets does not indicate
whether or not individuals will buy fresh produce or other healthy options. It is also
important to remember that supermarkets carry many unhealthy products that can be
purchased as cheaply as fast food. One limitation of including smaller grocery stores in
the “supermarket” category of this study is that these small stores may not have the same
consistent access to fresh fruits and vegetables that is often associated with chain
supermarkets.
This study considered a limited cross-section of the food environment; thus, we
did not examine other food outlets, such as full-service restaurants, dollar stores and
discount stores, pharmacies and drug stores, specialty food stores (e.g. meat markets, fish
not consider more informal food sources, such as food received through family networks
or from faith-based organizations.
Although this analysis controlled for some biological and demographic
characteristics, residual confounding may exist from other variables, such as
socioeconomic status,171 access to transportation,172,173 or use of medications.174
Additionally, this study did not control for the “intermediate risk factors,” such as fast
food purchasing and consumption, physical activity, and genetics, which may be
mediating factors in the relationship between proximity to food outlets and proximal risk
factors like A1c, BMI, and blood pressure.
Strengths
Strengths of this study including having a large sample of type 2 diabetes patients.
Additionally, this research is community-based and responds to the needs of a
community health center and vulnerable patient population in Robeson County. As
mentioned in the introduction, the prevalence of type 2 diabetes in Robeson County is
higher than the North Carolina and national average, and a key issue to address for the
health of American Indians and other minority populations. This is the first study to
examine the relationship between proximity to food venues and A1c level, in addition to
BMI and SBP, for this specific patient population in Robeson County. Furthermore,
while there have been a few studies using GIS for environmental studies in Robeson
County, GIS mapping has never been applied for the purpose of understanding the food
environment in Robeson County. GIS mapping is an innovative tool with many practical
applications for primary care and public health practitioners in preventing and combating
Future research
Future research should address the limitations stated above, by having unique
observations of patients, including more diverse and non-traditional food outlets in the
analysis, and considering other aspects of food access, such as coverage and density.
Further studies should further investigate whether socioeconomic status and access to
transportation are important covariates in the pathway between proximity to food outlets
and diabetes risk factors. In order to paint a fuller picture of the food environment, future
investigations should incorporate quantitative data regarding individuals’ food
preferences and shopping behaviors into studies about access to food outlets.
Additionally, qualitative research should explore whether proximity to food outlets is a
significant determinant of shopping behaviors. There is also potential for comparative
investigation of food environments across different North Carolina counties to inform
state policy-makers of disparities in food access, and ultimately position policy-makers to
Appendix
Table 1A: Descriptive statistics of study population.
Table 2A. Pearson’s correlation coefficients between diabetes risk factors. Figure 1A. Map of Robeson County with township labels.
Table 1A: Descriptive statistics of study population. A1c Levels (N = 1,297)
Minimum 4.7
1st quartile 6.4
Median 7.2
Mean 7.8
3rd quartile 8.7
Maximum 16.7
A1c Control (N = 1,297)
Less than 7% (strict control) 43.5% (N = 564) Between 7-8% (control) 19.8% (N = 257) Between 8-9% (borderline control) 13.6% (N = 177) Greater than 9% (uncontrolled) 23.1% (N = 299) A1c Controlled vs. Uncontrolled
Less than 9% (controlled) 76.9% Greater than 9% (uncontrolled) 23.1% BMI (N = 1,056)
Underweight (below 18.5) 0.09% (N = 1) Normal (18.5 to 24.9) 7.67% (N = 81) Overweight (25 to 29.9) 23.0% (N = 243)
Obese (30 to 40) 48.58% (N = 513)
Morbidly obese (above 40) 20.64% (N = 218) SBP
Distance to Closest Fast Food Restaurant (miles)
Min 0.04
Median 2.36
Mean 2.63
Max 9.79
Distance to Closest Supermarket (miles)
Min 0.01
Median 1.87
Mean 2.31
Max 9.8
Distance to Closest Convenience Store (miles)
Min 0.03
Median 1.15
Mean 2.00
Max 5.98
Distance to Closest Farmers’ Market (miles)
Min 0.01
Median 2.16
Mean 2.78
Table 2A. Pearson’s correlation coefficients between diabetes risk factors.
Pearson's correlation
coefficient P-value
BMI, SBP 0.094 0.002
A1c, SBP 0.059 0.036
Fig. 7A. Histogram of A1c levels (N = 1,297).
Level of control % of study population N
Strict control (< 7) 46 595
Control (7-8) 19 246
Borderline control (8–9) 13 175
References:
1 Centers for Disease Control and Prevention. (2011). National Diabetes Fact Sheet,
2011. Atlanta, GA: Centers for Disease Control, U.S. Department of Health and Human Services. Retrieved from http://www.cdc.gov/diabetes/pubs/pdf/ndfs_2011.pdf.
2 Centers for Disease Control and Prevention. (2012.) Diabetes Report Card, 2012.
Atlanta, GA: Centers for Disease Control, U.S. Department of Health and Human
Services. Retrieved from: http://www.cdc.gov/diabetes/pubs/pdf/diabetesreportcard.pdf.
3 Centers for Disease Control and Prevention. (2011). Successes and Opportunities for
Population-Based Prevention and Control at a Glance. Atlanta, GA: Centers for Disease Control, U.S. Department of Health and Human Services. Retrieved from
http://www.cdc.gov/chronicdisease/resources/publications/AAG/ddt.htm.
4 North Carolina Department of Health and Human Services, Division of Public Health.
(2008). The Burden of Diabetes in North Carolina: Prevalence, Complications, and Costs. Retrieved from
http://cdm16062.contentdm.oclc.org/cdm/ref/collection/p249901coll22/id/637321.
5 Robeson County 2011 Community Health Assessment.(2011). Lumberton, NC:
Robeson County Health Department. Retrieved from
http://publichealth.southernregionalahec.org/robeson/report.html.
6 Konen, J. & Page, J. (2012). The State of Diabetes in North Carolina. North Carolina
Medical Journal, 72(5):373-378.
7 Larson, N. I., Story, M. T., & Nelson M. C. (2009). Neighborhood Environments:
Disparities in Access to Healthy Foods in the U.S. American Journal of Preventive Medicine, 36(1), 74-81.
8 Ibid.
9 Beaulac, J., Kristjansson, E., & Cummins, S. (2009). A systematic review of food
deserts, 1966-2007. Preventing Chronic Disease, 6(3), 1-10.
10 Powell, L., Slater, S., Mirtcheva, D., et al. (2007). Food store availability and
neighborhood characteristics in the United States. Preventive Medicine, 44, 189-195.
11 American Diabetes Association. (2013). Diabetes Meal Plans and a Healthy Diet.
Retrieved from http://www.diabetes.org/food-and-fitness/food/planning-meals/diabetes-meal-plans-and-a-healthy-diet.html.
12 Centers for Disease Control and Prevention. (2008). Preventing Chronic Diseases:
Investing Wisely in Health. Atlanta, GA: Centers for Disease Control, U.S. Department of Health and Human Services. Retrieved from
http://www.cdc.gov/nccdphp/publications/factsheets/prevention/pdf/diabetes.pdf.
13 Bell, R.A. (2011). Barriers to diabetes prevention and control among American
Indians. North Carolina Medical Journal, 72(5), 393-396.
14 Beaulac, J., Kristjansson, E., & Cummins, S. (2009). A systematic review of food
deserts, 1966-2007. Preventing Chronic Disease, 6(3), 1-10.
15 U.S. Census Bureau. (2013). Robeson County, North Carolina. Retrieved from:
http://quickfacts.census.gov/qfd/states/37/37155.html.
16 Barger, S. (2012). An Overview of Diabetes in Robeson County, NC (white paper,
University of North Carolina-Chapel Hill).