MOLECULAR VISUALIZATION OF POLYMER THIN FILMS BY ATOMIC FORCE MICROSCOPY: TOWARDS PATTERNINNG AND REPLICATION OF SOFT NANOSTRUCTURES FOR NANOMATERIAL DESIGN AND CONSTRUCTION
Sherryl Yao Yu-Su
A dissertation submitted to the faculty of the University of North Carolina at Chapel Hill in partial fulfillment of the requirements for the degree of Doctor of Philosophy in the Curriculum of Applied Sciences and Engineering.
Chapel Hill 2009
Approved by:
Professor Valerie Ashby Professor Dimitry Ivanov
Professor Michael Rubinstein (chair) Professor Sergei Sheiko
ABSTRACT
SHERRYL YAO YU-SU: Molecular Visualization of Polymer Thin Films by Atomic Force Microscopy: Towards Pattering and Replication of Soft Nanostructures for
Nanomaterial Design and Construction (Under the direction of Sergei S. Sheiko)
The creation of materials with sub-100 nm functional architectures is a challenge in nanotechnology. Two ways to create nanostructures are: (i) self-assembly of small molecules into supramolecular structures and (ii) design of shape-persistent macromolecules. Molecular brushes are ideal candidates as one can control size, shape, interior structure, and surface composition through interactions between multiple branches with heterogeneous chemical composition. Accurate characterization of molecular dimensions and morphology is vital for understanding structure-property relations of mesoscopic molecules and their assemblies. This particularly concerns macromolecules that are small (10-100 nm), flexible, polydisperse, and heterogeneous.
iii
consisting of PCL extended-chain crystallites emanating from backbones and amorphous coronas of PBA chains. Macroscopic samples demonstrated an ability to maintain molecular alignment upon constrained crystallization of PCL. Aligned microphase separated cylinders transformed slowly into oriented lamellae through break-out crystallization of PCL, leading to fused PCL cores. Folded PCL chains formed lamellae parallel to the backbone, i.e. PCL chains oriented perpendicular to the backbone. The diblock side chain composition allowed for accurate control of the number of folds within PCL cores.
DEDICATION
v
ACKNOWLEDGMENTS
Throughout the years of working towards this goal, there are many that have been, and continue to be, an important part of this journey.
To my adviser, Professor Sergei Sheiko, thank you for taking me under your wing and sharing your knowledge, not just science but about life as well. Thanks to all of my friends and colleagues, past and present, in the Sheiko group: Isaac, Frank, Jamie, Hui, Mike, Natalia, and David, thank you for making graduate school fun! To our esteemed colleagues, especially at Carnegie Mellon University and in France, thank you for the collaboration and the friendships.
To my parents, Carlos and Elizabeth, and my siblings Cherries and Carlvin, thank you so much for all the love and support. You all mean so much to me and I hope you know that. To my Uncle Peter and Aunt Alice, thank you for all your help through the years. It is always nice to have someone that I can share my nerdiness with! To my mama-in-law, Shawna, thank you so much for all the help. You helped to keep me sane during these stressful times. To my furry babies, Wookie, Jasmine, and Spidey, thank you for always loving mommy!
TABLE OF CONTENTS
LIST OF TABLES...ix
LIST OF FIGURES AND SCHEMES...x
LIST OF ABBREVIATIONS AND SYMBOLS...xiii
Chapter 1. OVERVIEW OF DISSERTATION...1
Introduction...1
Fundamental challenges and proposed solutions...2
Experimental methods, materials, and sample preparation...4
Outline of the dissertation...15
References...16
2. MOLECULAR IMAGING AND CHARACTERIZATION OF COMPLEX MACROMOLECULES: BRANCHED CHAINS AND GRADIENT BRUSHES...21
Introduction...21
Characterization of branching in linear poly(alkyl acrylates)...24
Conformation of gradient brushes...52
vii
3. MOLDING BLOCK COPOLYMER MICELLES: A FRAMEWORK FOR MOLDING OF DISCRETE SOFT NANOSTRUCTURES ON
SURFACES...67
Introduction...67
Theoretical analysis of competitive adhesion and master deformation...71
Preparation and characterization of block copolymer masters and PFPE molds...81
Molding of spherical PS-b-PI micelles...90
Molding of cylindrical PS-b-PI micelles...96
Conclusions and future work...99
References...102
4. MOLECULAR BRUSHES WITH HETEROGENEOUS COMPOSITIONS: SELF-ASSEMBLY BY CRYSTALLIZATION...104
Introduction...104
Association of molecular brushes through crystallization of chain ends...106
Surface micelles of hetero-grafted PCL/PBA brushes...108
End-to-end association: molecular brushes with semi-crystalline block copolymer side chains...111
Conclusions and future work...113
5. MOLECULARLY-CONFINED CRYSTALLIZATION OF MOLECULAR BRUSHES WITH SEMI-CRYSTALLINE
DIBLOCK COPOLYMER SIDE CHAINS...116
Introduction...116
Sample characterization of PCL and PCL-b-PBA brushes...126
Molecules: single molecules and monolayers...140
Bulk: thick films and fibers...148
Conclusions and future work...165
References...167
ix
LIST OF TABLES Table
2.1. Reaction conditions and characterization of PBA brush
polymers...35 2.2. Length and branching analysis results for poly(alkyl acrylate)
and poly(alkyl methacrylate)-based PBA brush polymers...40 2.3. 13C NMR peak assignment...50 2.4. Summary of molecular characterization results of
gradient brush copolymers...57 3.1. Summary of molding results using spherical PS-b-PI
particles on modified silicon pieces...94 4.1. Characterization results for the hetero-grafted
PCL/PBA brushes...111 5.1. Molecular characterization of IA and IIA by
GPC-MALLS and AFM-LB...131 5.2. Raw data for the calculation of molecular weight of IA and
IIA brushes by AFM-LB...132 5.3. Non-isothermal DSC results for LPCL, IA, IIA-20,
and IIA-50...136 5.4. Length analysis results for single molecules of IA,
IIA-20, and IIA-50 brushes...145 5.5. Dimensions of thick films of IA and IIA-20 measured by AFM...153 5.6. SAXS results for IA, IIA-20, and IIA-50...156 5.7. Melting points determined from experiment and
LIST OF FIGURES AND SCHEMES Figure
1.1. Atomic force microscope set-up...9 1.2. Typical Langmuir-Blodgett trough set-up...12 2.1. GPC-MALLS traces of the poly(alkyl acrylate and
poly(alkyl methacrylate)-based backbones and their
corresponding PBA brushes...34 2.2. AFM images of PBA brushes made from poly(alkyl acrylate)
and poly(alkyl methacrylate)-based backbones...38 2.3. Weight-fraction distribution of the molecular weights based on
the measured lengths of poly(alkyl acrylate) and
poly(alkyl methacrylate)-based PBA brushes...39 2.4. Distribution of the topologies present in poly(alkyl acrylate) and
poly(alkyl methacrylate)-based brushes...44 2.5. Conformation plot of poly(alkyl acrylate)-based backbone
AI(A) and AI(F)...46 2.6. 13C NMR spectra for poly(alkyl acrylate) backbone AI(A)
synthesized by ATRP...49 2.7. AFM images of the gradient copolymer brushes...56 2.8. Height profiles of the gradient copolymer brushes...60 3.1. Deformation of a cuboid (L0xL0xH0) upon adsorption
to a substrate...74 3.2. The diagrams for the dependence of the minimal deformation
of particles (A) and threshold surface energy of the substrate (B) on the effective stiffness of the particles...77 3.3. The spherical micelle can be approximated as a hemisphere
upon adsorption on the substrate, with the height of the cap
being the diameter of the PS core...79 3.4. Diagram of the molding and transfer conditions for the
rubber-like particle with thickness H0=25 nm, Young’s modulus
xi
3.5. PFPE-based soft lithography allows templating and molding
of spherical, torroidal, and cylindrical PS-b-PI micelles...84
3.6. Modification of silicon substrates using an alkylsilane mixture...88
3.7. Zisman plot for the UV-cured perfluoropolyether (PFPE) used for soft lithography...89
3.8. Control experiment with spherical micelles adsorbed onto unmodified, UVO-cleaned silicon wafers...91
3.9. AFM images of PS-b-PI spherical micelles on two different modified substrates before and after molding, as well as the PFPE molds from each sample...95
3.10. AFM images of PS-b-PI cylindrical micelles on modified silicon substrates...97
4.1. Molecular brushes with associating crystalline ends...107
4.2. Single molecules of hetero-grafted block brushes...109
4.3. AFM images of (PBiBEM-g-PBA)-b-(PHEMA-g-PCL) hetero-grafted brush...110
4.4. End-to-end association of PCL-b-PBA brushes...113
5.1. Non-isothermal DSC traces for LPCL, IA, and IIA-20...135
5.2. Polarized optical micrographs of LPCL, IA, IIA-20, and IIA-50... 139
5.3. Single molecule morphology of adsorbed IA and IIA-20 brushes...142
5.4. In-situ heating and cooling experiments on IIA-20 single molecules and thick films...143
5.5. Herringbone morphology of IIA-20 single molecules on mica...146
5.6. Thick films of IA and IIA-20 molecules...151
5.7. Time-resolved SAXS spectra of IA and IIA-20...154
Scheme
1.1. Molecular brushes are new, functional, self-assembled
materials...14
2.1. Topologies observed by AFM for macromolecules synthesized by ATRP and FRP...22
2.2. Gradient copolymer schematic...24
2.3. Chain transfer to polymer mechanisms...26
2.4. Synthetic route for the molecular brushes consisting of a poly(alkyl (meth)acrylate)-based backbone and PBA side chains grafted from each monomer unit of the backbone via ATRP...31
2.5. Theoretical behavior of gradient brushes upon adsorption onto mica...54
3.1. PFPE-based soft lithography using weakly-adsorbed particles as masters...71
3.2. Poly(styrene)-b-poly(isoprene) block copolymer micelles...82
3.3. Molding of cylindrical micelles using low energy substrates results in micelle rupture upon mold removal...99
4.1. Heterogeneous molecular brushes with amorphous and crystalline components...106
5.1. Morphology of semi-crystalline polymers upon crystallization...119
5.2. Linear semi-crystalline block copolymer lamella...124
5.3. Molecular brushes with semi-crystalline side chains...127
5.4. Synthetic pathway for the homopolymer PCL brush (IA) and the semi-crystalline PCL-b-PBA diblock copolymer brush (IIA)...128
5.5 Model for the herringbone morphology of adsorbed IIA-20 single molecules on mica...148
xiii
LIST OF ABBREVIATIONS AND SYMBOLS
α Asymmetry parameter
A Area of a chain
AFM Atomic force microscopy
Atot Total surface area of the substrate per adsorbed particle
ATRP Atom transfer radical polymerization χc Degree of crystallinity
BA n-butyl acrylate
C-A Crystalline-amorphous diblock copolymer
CL ε-caprolactone
Cq Quaternary carbon
CRP Controlled radical polymerization
CT Chain transfer
DSC Differential scanning calorimetry
ε Deformation
E Young’s modulus
Felast Elastic free energy
FRP Free radical polymerization Fsurf Interfacial free energy
γ Interfacial energy between crystalline-amorphous blocks γm Surface energy of the PFPE mold
γp Surface energy of the polymer particle
γs Surface energy of the substrate
γsp Interfacial energy of the substrate-particle interface
GPC-MALLS Gel permeation chromatography coupled with multi-angle laser light scattering
H Particle height
K Boltzman constant
l Lamella period
La SAXS long period before crystallization
LB Langmuir-Blodgett deposition technique
LCB Long chain branches
Ln Contour length
lm Length per monomer unit of the backbone
lp Persistence length
PBA m
l Length per PBA monomer unit lPBA Thickness of PBA domain
PCL m
l Length of PCL monomer unit
LPBA Length of PBA block
lPCL Thickness of PCL domain
LPCL Length of PCL block
LSAXS SAXS long period after crystallization
mBA Molar mass of n-butyl acrylate monomer
mCL Molar mass of ε-caprolactone monomer
xv
Mn Number-average molecular weight
MPBA Molar mass of poly(n-butyl acrylate)
mPCL Mass fraction of PCL block
MPCL Molar mass of poly(ε-caprolactone)
NA Avogadro’s number
na Degree of polymerization of the amorphous block
nAFM Number of molecules per unit area in an AFM image
Nbb Degree of polymerization of the backbone
nc Degree of polymerization of the crystalline block
nfolds Number of folds in the crystalline lamella
NMR Nuclear magnetic resonance
nPCL Degree of polymerization of the PCL block
nPBA Degree of polymerization of the PBA block
PBA Poly(n-butyl acrylate) PCL Poly(ε-caprolactone) PDI Polydispersity index PDMS Polydimethyl siloxane PFPE Perfluoropolyether
S Spreading parameter
SAXS Small angle x-ray scattering SCB Short chain branches
t Film thickness
Tc Crystallization temperature
Tg Glass transition temperature
Tm Melting temperature
TODT Order-disorder transition temperature
CHAPTER 1
OVERVIEW OF DISSERTATION
1.1. Introduction
In this age of device miniaturization, nanofabrication techniques must continually improve and evolve to meet the demands for faster, cheaper, better and more efficient materials. Conventional top-down fabrication techniques, such as photolithography, are quickly approaching their limits in reproducible feature size and dimensionality for use in a number of existing and emerging technologies.1-5 Lithography on length scales below 100 nm is particularly challenging, hampered by the availability of suitable masters and equipment.1-5 In addition, the method demands very expensive and sophisticated equipment.1-5
possess the desired shapes, chemical structures, and properties is critical for this approach to be successful. The other challenges include proper (complete) characterization of their individual structures (size and shape) and the understanding of their arrangement in the bulk and on surfaces. Issues, such as the durability of the structures, pattern reproducibility and fidelity, and orientation/alignment of the molecular assemblies at a large scale, limit the application of the bottom-up technique as well.1, 2 Top-down nanofabrication techniques offer a solution to the problems of bottom-up nanofabrication. Specifically, soft lithography is a gentle and facile technique that is compatible with delicate nanostructures.2, 9-11. Significant gains in time and cost are major advantages to this technique, compared to conventional photolithography.1, 2 In addition, with this family of fabrication methods, there are almost no limitations in the sizes and structures that can be replicated.2
1.2. Fundamental challenges and proposed solutions
3
complex nanostructures, to faithful reproduction of structures created into functional forms.14, 15
Molecular brushes can be regarded as prefabricated building blocks with a controllable size ranging from 10-100 nm, well-defined shape (e.g. disks, plates, spheres, and cylinders), and the ability to assemble into larger structures. In terms of size, these are particles that maintain all molecular features such as chain flexibility and specific interactions. Molecular brushes adsorb and self-assemble on a substrate (bottom-up method) as masters/templates for soft lithography (top-down method). In addition to their uses as templates, molecular brushes are also useful as miniature single-molecule devices that are able to switch their shape and generate significant tension in covalent bonds. More importantly, fundamental investigations in structure-property relations can be carried out using self-assembled molecules and structures. Further understanding of this relationship will be beneficial to the design and construction of molecules for targeted applications.
The advantage of using mesoscopic molecules is their well-defined shape and interior structure. A disadvantage to using molecular brushes is its slow equilibration due to their large size. Furthermore, their internal (equilibrium) microstructure, i.e. the molecular organization inside molecules and bulk materials, is still largely unknown.
studied and characterized as single molecules and as components in thick films. The unique morphology and properties of these molecules make them potential candidates as molecular masters for soft lithography. Soft molecular assemblies, such as molecular brushes, however, are quite fragile and require certain (thermodynamic) conditions for them to maintain their shapes and structures. The interactions between each component must be carefully controlled to ensure that the correct structures are faithfully molded and replicated. This can only be achieved when using a unique perfluoropolyether elastomer developed by DeSimone, et.al. as the molding material during soft lithography.16-20 The results of such an investigation using molecular visualization by AFM shall be presented.21
1.3. Experimental methods, materials, and sample preparation
Molecular characterization techniques such as nuclear magnetic resonance (NMR) and gel permeation chromatography (GPC) and bulk analytical methods such as x-ray scattering and thermal analysis are among the numerous characterization methods for probing polymer properties and behaviors that are available to polymer chemists and physicists. In addition to these conventional techniques, recent advances in imaging methods specifically in atomic fore microscopy (AFM) have made them essential complementary tools in the characterization of polymer specimens, extending their usefulness to beyond just simple visualization.20-24
5
are readily obtained via AFM.24-34 In addition, molecular weight and molecular weight distribution information that are consistent with conventional GPC analysis are possible by the combined AFM-LB technique.35 NMR is a widely-used spectroscopic method that provides important structural information, such as a polymer’s stereochemistry and monomer sequence.36, 37 It has also been used extensively to study branching phenomena in polyethylene and other common polymers.38-47, although there are still limitations due to poor sensitivity and resolution of branched peaks. Molecular weight and molecular weight distributions can be obtained from GPC analysis based on a calibration curve constructed from the molecular weight data of (almost) monodisperse linear polymer standards, typically poly(styrene) or poly(methyl methacrylate).36, 37 Some discrepancy may result from the use of a calibration plot. However, when the GPC is coupled with a light scattering module, a more accurate molecular weight and molecular weight distribution can be obtained without the need of a calibration curve. This is very useful for high molecular weight polymers and samples that are highly branched such as molecular brushes.36, 37 In addition, gel permeation chromatography coupled with multi-angle laser light scattering (GPC-MALLS) can provide structural information as well, such as branching distribution across the whole molecular weight spectrum although one must be careful in the analysis of the data as the technique breaks down at low branching levels.38, 45, 48, 49
and composition (hard versus soft material) of a film, provided that clean and consistent sample preparation methods, such as Langmuir-Blodgett deposition, were carried out. Nevertheless, with AFM being a surface technique, deformation of soft molecular objects can occur, thereby yielding inaccurate height and lateral dimensions. PFPE-based molding of soft molecules is a technique that was developed as a possible solution to this issue.21
7
1.3.1. Molecular imaging by atomic force microscopy
Twenty years ago, the development of scanning probe microscopy (SPM) revolutionized the scientific world by providing a technique capable of visualizing objects of infinitesimal size. In particular, atomic force microscopy (AFM), developed in 1986 by Binnig et. al.51, allows for three-dimensional visualization and analysis of both conducting and insulating materials with nanometer resolution under a variety of environmental conditions. Further developments such as non-contact and intermittent (tapping) modes extend the applicability of AFM to soft and weakly-adhering materials. All these features combined enabled the use of AFM in studying biological species which have well-defined secondary and tertiary structures.
One can use AFM to study chemical and physical phenomena at the molecular level by monitoring individual macromolecules with well-defined structures. For instance, one can measure molecular weight35 and chain dimensions33, 52, 53 including contour length L
n, radius of gyration Rg, fractal
dimension D, and persistence length lp, as well as investigate conformational
9
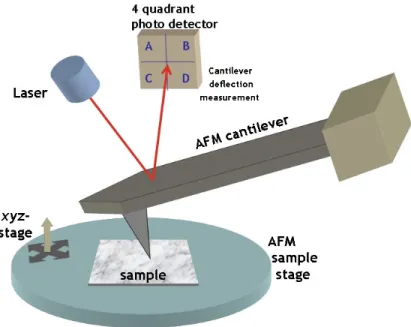
Figure 1.1. Atomic force microscope set-up.
A basic atomic force microscope (AFM) set-up is shown in Figure 1.1. An AFM cantilever with a sharp tip is used to scan the surface of the film. With terrain changes as the probe travels over the film, the laser beam deflections from the cantilever are captured on a photodiode. High resolution topographic micrographs are then obtained as these signals are translated into an image.64
cantilever as it travels across the sample surface. This solves the problem of sample damage and unwanted friction and adhesion between sample and tip. Tapping mode AFM has become the standard method for AFM characterization of soft biological specimens and polymers.64 Still, AFM is a contact technique that typically causes deformation of soft molecular objects. As such, we have studied a novel technique for imaging individual molecular objects. As discussed in Chapter 3, PFPE-based soft lithography has been applied to mold block-copolymer micelles of different shapes. The technique has been optimized in terms of adhesion and deformation of the soft objects.
In addition to topographic information, tapping mode AFM can be used to detect mechanical properties of the film. One can differentiate between a hard material from a soft one on the surface in the phase mode. It is a sensitive method that is particularly useful if the topography is rough. Further advancements in AFM technology have enabled researchers to obtain high resolution images under a variety of conditions, such as in fluid and at high temperatures.64 The reader is encouraged to peruse the numerous review articles and books about AFM that have been published for more details about the technique.24, 65-68
11
1.3.2. Sample preparation techniques for molecular visualization experiments: spincasting and Langmuir-Blodgett film deposition
To facilitate molecular visualization experiments, two film preparation techniques were employed: spincasting and Langmuir-Blodgett film deposition.
Spincasting was used to prepare dilute, single molecule films and thick polymer films (t 6 nm). This involves dispersing a solution of the polymer molecule onto a substrate as it is spinning at a constant velocity.
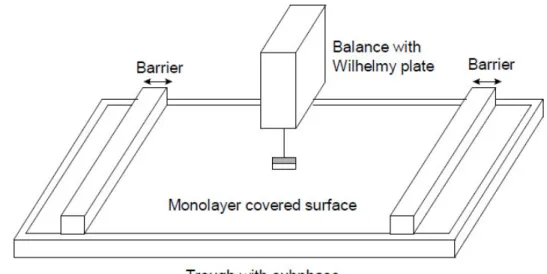
Langmuir-Blodgett (LB) deposition is an elegant method for transferring films from a fluid substrate to a solid one. In using this method, one has control over film thickness, film uniformity, and molecular organization. To prepare a film by LB, molecules are deposited onto a fluid substrate, typically water, contained in a trough made of Teflon (Figure 1.2). This creates a floating layer of molecules that is a monolayer thick. The molecules can be brought together to create a uniform film, of a specific molecular density, using movable barriers. The barriers compress the molecules until the desired surface pressure, measured by the Wilhelmy plate, is achieved. The film can then be transferred onto a substrate, keeping the surface pressure constant, i.e. film uniformity upon transfer. The number of dips up and down through the monolayer dictates the thickness of the film.
controlled low pressure of 0.5 mN/m. The same procedure was used for the preparation of films of each polymer brush encapsulated in a matrix of linear PBA.
Figure 1.2. Typical Langmuir-Blodgett trough set-up. Missing from the schematic is the substrate dipper controls. This is feature is used to keep the substrate in place as it travels up and down the deposited monolayer at a given number of dips at a specified speed and surface pressure. This gives one complete control over the film thickness and molecular arrangement. (Courtesy of KSV Instruments Ltd. website)
1.3.3. Molecular brushes
13
ordering.71 Given these properties, molecular brushes have potential applications as sensors, super soft elastomers72, and lithographic masters/templates to name a few.73, 74
15 1.4 Outline of the dissertation
The next two chapters (Chapter 2 and 3) of the dissertation are dedicated to the development of different imaging tools for accurate analysis of dimensions (size and shape) of individual molecules and molecular assemblies. The goal of this work is to demonstrate the importance of molecular imaging by AFM as a characterization tool that can be used in conjunction with conventional analytic techniques. Thus, in Chapter 2 of the dissertation, molecular visualization results from the branching analysis of linear molecules and the study of molecular brushes with a gradient composition in the backbone will be presented. In Chapter 3, results of the top-down PFPE-based soft lithographic method used to mold adsorbed soft particles will be presented.
The developed imaging techniques have been applied to molecular brushes with heterogeneous semi-crystalline compositions (Chapter 4 and 5). The goal of this work is to understand the self-assembling nature of heteropolymer brushes and to characterize their unique morphology along with chain alignment.
• Chapter 2 – Molecular imaging of complex molecular topologies:
Branched chains and gradient brushes
• Chapter 3 – Molding block copolymer micelles: A framework for
molding discrete soft nanostructures on surfaces
• Chapter 4 – Molecular brushes with heterogeneous compositions:
Self-assembly by crystallization
• Chapter 5 – Molecularly-confined crystallization of macromolecular
References
(1) Xia, Y.; Rogers, J. A.; Paul, K. E.; Whitesides, G. M. Chem. Rev. 1999, 99, 1823-1848.
(2) Gates, B. D.; Xu, Q.; Stewart, M.; Ryan, D.; Wilson, C. G.; Whitesides, G. M. Chem. Rev. 2005, 105, 1171-1196.
(3) Nie, Z.; Kumacheva, E. Nat. Mater. 2008, 7, 277-290.
(4) Jackman, R. J.; Brittain, S. T.; Adams, A.; Prentiss, M. G.; Whitesides, G. M. Science 1998, 280, 2089-2091.
(5) Whitesides, G. M.; Boncheva, M. Proc. Nat. Acad. Sci. U.S.A. 2002, 99, 4769-4774.
(6) Leibler, L. PRog. Polym. Sci. 2005, 30, 898-914. (7) Li, M.; Ober, C. K. Mater. Today 2006, 9, 30-39.
(8) Rogers, J. A.; Nuzzo, R. G. Mater. Today 2005, 8, 50-56.
(9) Zhao, X. M.; Xia, Y.; Whitesides, G. M. J. Mater. Chem. 1997, 7, 1069-1074. (10) Xia, Y.; Whitesides, G. M. Annu. Rev. Mater. Sci. 1998, 28, 153-184.
(11) Gates, B. D. Materials Today 2005, 8, 44-49.
(12) Krishnamoorthy, S.; Hinderling, C.; Heinzelmann, H. Mater. Today 2006, 9, 40-47.
(13) Stoykovich, M. P.; Nealey, P. F. Mater. Today 2006, 9, 20-29.
(14) Balzani, V.; Credi, A.; Venturi, M. Chem. Eur. J. 2002, 8, 5524-5532. (15) Shenhar, R.; Rotello, V. M. Acc. Chem. Res. 2003, 36, 549-561.
(16) Rolland, J. P.; Hagberg, E. C.; Denison, G. M.; Carter, K. R.; DeSimone, J. M. Angew. Chem. Int. Ed. 2004, 43, 5796-5799.
(17) Rolland, J. P.; Dam, R. M. V.; Schorzman, D. A.; Quake, S. R.; DeSimone, J. M. J. Am. Chem. Soc. 2004, 126, 2322-2323.
17
(19) Maynor, B. W.; Euliss, L. E.; Rolland, J. P.; DeSimone, J. M. Polym. Prepr. 2005, 46, 799.
(20) Maynor, B. W.; LaRue, I.; Hu, Z.; Rolland, J. P.; Pandya, A.; Fu, Q.; Liu, J.; Spontak, R. J.; Sheiko, S. S.; Samulski, R. J.; Samulski, E. T.; DeSimone, J. M. Small 2007, 3, 845-849.
(21) Yu-Su, S. Y.; Thomas, D. R.; Alford, J. E.; LaRue, I.; Pitsikalis, M.;
Hadjichristidis, N.; DeSimone, J. M.; Dobrynin, A. V.; Sheiko, S. S. Langmuir 2008, 24, 12671-12679.
(22) Boyce, J. R.; Sun, F. C.; Sheiko, S. S.; Maynor, B. W.; DeSimone, J. M.; Sumerlin, B.; Matyjaszewski, K. Polym. Prepr. 2006, 47, 543-544.
(23) Gallyamov, M. O.; Tartsch, B.; Khokhlov, A. R.; Sheiko, S. S.; Börner, H. G.; Matyjaszewski, K.; Möller, M. Macromol. Rapid Comm. 2004, 25, 1703-1707. (24) Sheiko, S. S.; Moller, M. Chem. Rev. 2001, 101, 4099-4123.
(25) Sheiko, S. S.; Prokhorova, S. A.; Beers, K. L.; Matyjaszewski, K.; Potemkin, I. I.; Khokhlov, A. R.; Moeller, M. Macromolecules 2001, 34, 8354-8360.
(26) Prokhorova, S. A.; Sheiko, S. S.; Mourran, A.; Azumi, R.; Beginn, U.; Zipp, G.; Ahn, C. -.; Holerca, M. N.; Percec, V.; Moller, M. Langmuir 2000, 16, 6862-6867. (27) Gerle, M.; Fischer, K.; Roos, S.; Mueller, A. H. E.; Schmidt, M.; Sheiko, S. S.;
Prokhorova, S.; Moeller, M. Macromolecules 1999, 32, 2629-2637.
(28) Beers, K. L.; Gaynor, S. G.; Matyjaszewski, K.; Sheiko, S. S.; Moeller, M. Macromolecules 1998, 31, 9413-9415.
(29) Sheiko, S. S.; Gerle, M.; Fischer, K.; Schmidt, M.; Moller, M. Langmuir 1997, 13, 5368-5372.
(30) Qin, S.; Matyjaszewski, K.; Xu, H.; Sheiko, S. S. Macromolecules 2003, 36, 605-612.
(31) Lee, H.; Matyjaszewski, K.; Yu-Su, S.; Sheiko, S. S. Macromolecules 2008, 41, 6073-6080.
(32) Lee, H.; Matyjaszewski, K.; Yu, S.; Sheiko, S. S. Macromolecules 2005, 38, 8264-8271.
(34) Lord, S. J.; Sheiko, S. S.; LaRue, I.; Lee, H.; Matyjaszewski, K. Macromolecules 2004, 37, 4235-4240.
(35) Sheiko, S. S.; da Silva, M.; Shirvaniants, D.; LaRue, I.; Prokhorova, S.; Moeller, M.; Beers, K.; Matyjaszewski, K. J. Am. Chem. Soc. 2003, 125, 6725-6728. (36) Painter, P. C.; Coleman, M. M. In Fundamentals of polymer science :an
introductory text; Technomic Pub. Co.: Lancaster, Pa., 1997; pp 478.
(37) Stevens, M. P. In Polymer Chemistry: An Introduction; Oxford University Press: Oxford, 1999; pp 551.
(38) Wood-Adams, P. M.; Dealy, J. M.; deGroot, A. W.; Redwine, O. D. Macromolecules 2000, 33, 7489-7499.
(39) Axelson, D. E.; Levy, G. C.; Mandelkern, L. Macromolecules 1979, 12, 41-52. (40) Cavagna, F. Macromolecules 1981, 14, 215-216.
(41) Usami, T.; Takayama, S. Macromolecules 1984, 17, 1756-1761. (42) Bugada, D. C.; Rudin, A. J. Appl. Polym. Sci. 1987, 33, 87-93.
(43) Liu, W.; Ray, D. G.; Rinaldi, P. L. Macromolecules 1999, 32, 3817-3819. (44) Shroff, R. N.; Mavridis, H. Macromolecules 2001, 34, 7362-7367.
(45) Yu, Y.; DesLauriers, P. J.; Rohlfing, D. C. Polymer 2005, 46, 5165-5182. (46) Pollard, M.; Klimke, K.; Graf, R.; Spiess, H. W.; Wilhelm, M.; Sperber, O.; Piel,
C.; Kaminsky, W. Macromolecules 2004, 37, 813-825.
(47) Ahmad, N. M.; Heatley, F.; Lovell, P. A. Macromolecules 1998, 31, 2822-2827. (48) Podzimek, S.; Vlcek, T.; Johann, C. J. Appl. Polym. Sci. 2001, 81, 1588-1594. (49) Podzimek, S.; Vlcek, T. J. Appl. Polym. Sci. 2001, 82, 454-460.
(50) Gedde, U. W. In Polymer physics; Chapman & Hall: London; New York, 1995; pp 298.
19
(53) Boyce, J. R.; Shirvanyants, D.; Sheiko, S. S.; Ivanov, D. A.; Qin, S.; Boerner, H.; Matyjaszewski, K. Langmuir 2004, 20, 6005-6011.
(54) Kumaki, J.; Hashimoto, T. J. Am. Chem. Soc. 2003, 125, 4907-4917. (55) Roiter, Y.; Minko, S. J. Am. Chem. Soc. 2005, 127, 15688-15689. (56) Schappacher, M.; Deffieux, A. Macromolecules 2005, 38, 4942-4946. (57) Kasëmi, E.; Zhuang, W.; Rabe, J. P.; Fischer, K.; Schmidt, M.; Colussi, M.;
Keul, H.; D. Yi, H. C.; Schlüter, A. D. J. Am. Chem. Soc. 2006, 128, 5091-5099. (58) Kreutzer, G.; Ternat, C.; Nguyen, T. Q.; Plummer, C. J. G.; Månson, J. -. E.;
Castelletto, V.; Hamley, I. W.; Sun, F.; Sheiko, S. S.; Klok, H. -A. Macromolecules 2006, 39, 4507-4516.
(59) Xu, H.; Shirvanyants, D.; Beers, K.; Matyjaszewski, K.; Rubinstein, M.; Sheiko, S. S. Phys. Rev. Lett. 2004, 93, 2061031-2061034.
(60) Xu, H.; Shirvaniants, D.; Beers, K.; Matyjaszewski, K.; Dobrynin, A. V.; Rubinstein, M.; Sheiko, S. S. Phys. Rev. Lett. 2005, 94, 237801.
(61) Yamamoto, S.; Tsujii, Y.; Fukuda, T. Macromoles 2000, 33, 5995-5998. (62) Hugel, T.; Rief, M.; Seitz, M.; Gaub, H. E.; Netz, R. R. Phys. Rev. Lett. 2005,
94, 0483011-0483014.
(63) Zou, S.; Schonherr, H.; Vancso, G. J. Angew. Chem. Int. Ed. 2005, 44, 956-959.
(64) Anonymous In Scanning Probe Microscopy Training Notebook; Digital Instruments, Veeco Metrology Group: Santa Barbara, CA, 2000; pp 56. (65) Batteas, J. D.; Michaels, C. A.; Walker, G. C.; American Chemical Society In
Applications of scanned probe microscopy to polymers; ACS symposium series; American Chemical Society: Washington, DC, 2005; Vol. 897, pp 265.
(66) Ratner, B. D.; ï¸ T︡Sukruk, V. V.; American Chemical Society; American Chemical Society In Scanning probe microscopy of polymers; ACS symposium series; American Chemical Society: Washington, DC, 1998; Vol. 694, pp 367. (67) Sarid, D. In Scanning force microscopy: with applications to electric, magnetic,
(68) Wickramasinghe, H. K. In Scanned probe microscopy: Santa Barbara, CA, 1991; AIP conference proceedings; American Institute of Physics: New York, 1992; Vol. 241, pp 563.
(69) Sun, F.; Sheiko, S. S.; Moeller, M.; Beers, K.; Matyjaszewski, K. J. Phys. Chem. A 2004, 108, 9682-9686.
(70) Sheiko, S. S.; Sun, F. C.; Randall, A.; Shirvanyants, D.; Rubinstein, M.; Lee, H.; Matyjaszewski, K. Nature 2006, 440, 191-194.
(71) Xu, H.; Sheiko, S. S.; Shirvanyants, D.; Rubinstein, M.; Beers, K. L.; Matyjaszewski, K. Langmuir 2006, 22, 1254-1259.
(72) Pakula, T.; Zhang, Y.; Matyjaszewski, K.; Lee, H.; Boerner, H.; Qin, S.; Berry, G. C. Polymer 2006/9/20, 47, 7198-7206.
(73) Djalali, R.; Li, S.; Schmidt, M. Macromolecules 2002, 35, 4282-4288.
(74) Zhang, M.; Estournès, C.; Bietsch, W.; Müller, A. H. E. Adv. Funct. Mater. 2004, 14, 871-882.
CHAPTER 2
MOLECULAR IMAGING OF COMPLEX MOLECULAR TOPOLOGIES: BRANCHED CHAINS AND GRADIENT BRUSHES
2.1. Introduction
Quantitative information about macromolecular topology is becoming invaluable with the emergence of novel and complex structures, such as star- and brush-like macromolecules and dendrimers, for micro- and nano-scale devices.1-3 Full quantification and analysis of these novel structures can be quite challenging with conventional polymer characterization methods, such as gel permeation chromatography (GPC) and nuclear magnetic resonance (NMR).
Molecular imaging using an atomic force microscope (AFM), however, can be used to study chemical and physical phenomena at the molecular level by monitoring individual molecules. As stated previously (Chapter 1), AFM can be used to fully characterize molecular weight4 and chain dimensions5-7, as well as investigate physical transitions8-14 and association processes.15 Suffice to say, by using this method, one can directly obtain the desired topological information, as well as characterize macromolecular properties and behavior.
In the first half, visual evidence and quantification of branching in linear molecules will be presented (Scheme 2.1). The model systems used in this study were acrylate-based macromolecular brushes synthesized via atom transfer polymerization (ATRP) and free radical polymerization (FRP). A comparison between acrylate and methacrylate-based macromolecules synthesized by ATRP was also undertaken. To facilitate the molecular visualization experiments and analysis, poly[2-(trimethylsilyloxy)ethyl acrylate] (PHEA-TMS) synthesized by ATRP and FRP were converted into macroinitiators, poly[2-(2-bromopropionyloxy)ethyl acrylate] (PBPE) and subsequently decorated with poly(n-butyl acrylate) (PBA) side chains, creating densely-grafted macromolecules that are easily visualized and analyzed by AFM. The contrast enhancement due to the side chains is similar to that of linear chains decorated with bulky molecules16 and nanoparticles.17 Conventional characterization methods of 13C NMR and gel permeation chromatography coupled with a multi-angle laser light scattering unit (GPC-MALLS) indicated the presence of branching. Molecular visualization results obtained from AFM were corroborated by GPC-MALLS and 13C NMR findings, and in addition, quantified the degree of branching in each model system.
23
Scheme 2.2. Gradient copolymer schematic. Composition and distribution along the chain can be varied spontaneously or by force. In order to visualize and characterize these unique materials by AFM, (A) linear gradient backbones were decorated with p-nBA side chains (B). (Reprinted with permission from 18. © 2005 American Chemical Society.)
2.2. Characterization of branching in linear poly(alkyl acrylate) macromolecules (in preparation)
In general, branching occurs as a frequent and undesirable side reaction during Free Radical polymerizations (FRP). In fact, uncontrolled branching as a result of chain transfer to polymer reactions during FRP remains a key industrial issue that persists today since it is known to affect a material’s properties and performance.19-25
25
26
27
The use of controlled radical polymerization (CRP) methods should be enough to circumvent the problem of CT side reactions that result in unwanted branched molecules. Similar to FRP, CRP systems involve propagating radical chains ends. The key difference between the two radical processes is that the chain ends in CRP have a “living” characteristic akin to that present in anionic polymerizations. That is, the propagating end does not undergo termination and/or irreversible chain transfer reactions resulting in a linear conversion versus time plot.26, 27 In particular, atom transfer radical polymerization (ATRP) is a frequently used method for the synthesis of various polymers with well-defined molecular weights, i.e. narrow polydispersities, which indicate that little to no chain transfer or termination reactions occurred during the polymerization. This is due to the fact that, at any given time, only a small fraction of the polymer chains are actively propagating while majority are in a halide-terminated dormant state.31, 32 However, recently published reports show evidence of chain transfer reactions during acrylate ATRP, some of which result in randomly branched structures, reminiscent of FRP products.33-36 Chain transfer in FRP and ATRP should be identical since they are both radical processes. The inherent mechanistic differences between FRP and ATRP, as well as the reaction conditions during synthesis, can affect the degree of branching in molecules produced by FRP and ATRP.
2.2.1. Branching characterization methods
branching, as well as chain architecture, is important.21, 24, 37 The techniques commonly used for branching analyses include 13C nuclear magnetic resonance (NMR) spectroscopy, rheology, triple-detector gel permeation chromatography (GPC), and GPC coupled with multi-angle laser light scattering (GPC-MALLS). However, there are inherent limitations and major discrepancies between the various methods. This makes it difficult to draw general conclusions about the branching distribution and length of branches, both of which directly affect structure-property relationships of polymeric materials.
For instance, 13C NMR is a straightforward method that has been used extensively throughout the years to study branching in polyethylene (PE)21, 38-45 and other common polymers such as simple poly(alkyl acrylates).46 However, the low natural abundance of 13C isotope can result in poor sensitivity and low resolution of peaks.44, 45 More importantly, 13C NMR is unable to distinguish beyond branches containing C6 43, 45, 47 Branches up to ~C16 may be distinguishable if solid-state NMR is used but with some caveats.45, 48 That is, branches with >C6 are considered long chain branches (LCB), while those with C6 are defined as short chain branches (SCB). Resolution enhancement is possible by using solid-state 13C NMR45, increasing experiment times45, and changing solvents and temperatures but with limited results.
29
drawback of rheology is its insensitivity to SCB, as it detects branches that are at and above a critical molecular weight for entanglement (Mc~2–4 Me>>C6), i.e. LCB.43-45, 49 This is quite different from the 13C NMR definitions for LCB and SCB, which leads to confusion when reporting branching statistics. Both 13C NMR and rheology do give an average branch value for the material despite this inconsistency.
In contrast, triple-detector GPC and GPC-MALLS provide information about the distribution of branching across the whole molecular weight spectrum, and these techniques are especially good for high molecular weight samples.21, 44, 50, 51 In triple-detector GPC, the Mark-Houwink plot generated gives information about LCB via a slope change, and SCB which produces a shift in the curve but no slope change when compared to a linear standard.21 However, some assumptions must be made in order to obtain this information.44 Many factors, including solvent quality and sample polydispersity, affect the assumptions made for each sample.44 Any mistake or miscalculation can lead to erroneous conclusions about the degree of branching in a certain molecule.44
2.2.2. Early studies of branching in acrylic polymers
Branching has been extensively studied in polyethylene systems.21, 24, 37-45, 47, 49-52 But in recent years, the degree of branching in other industrially-important polymers, such as acrylic polymers, has also been investigated. Poly(alkyl acrylate)-based backbones contain a tertiary (3°) carbon that makes them susceptible to attack by an actively propagating radical. Currently, much of the evidence for both inter- and intra- molecular CTP is from 13C NMR and ESR spectroscopy.46, 53-55
In their 13C NMR studies of poly(n-butyl acrylate (PBA) and poly(2-ethylhexyl acrylate) (PEHA) synthesized by FRP, Lovell, et.al. determined that the extent of branching depends on a few important parameters: percent conversion (%conv.), initial monomer concentration [M]0, and possibly, the free volume of the moieties present which affects reactant accessibility.46, 53 A dramatic increase in the degree of branching with increasing %conv., independent of [M]0, was observed. In addition, at a given %conv., branching from CTP increases with decreasing [M]0 especially at dilute solution conditions, attributed to a decreased monomer density around the active propagating chain end.46, 53 Electron spin resonance (ESR) experiments performed on FRP-made poly(phenyl acrylate) (PPhA) and poly(cyclohexyl acrylate) (PCHA) also showed an increase in branching with increasing %conv.54, 55
2.2.3. Poly(alkyl acrylate)-based molecules: a model system
31
characterization methods: molecular visualization by AFM, GPC-MALLS, and 13C NMR analysis.
Scheme 2.4. Synthetic route for the molecular brushes consisting of a poly(alkyl (meth)acrylate)-based backbone and PBA side chains grafted from each monomer unit of the backbone via ATRP. The free radical synthetic procedure for (II) is similar with the exception of the initiator used (AIBN) and the absence of CuBr and PMDETA. The scheme presented is for ATRP. The free radical procedure is similar with the exception of the initiator used (AIBN) and the absence of CuBr and PMDETA.
Monomer conversion was determined by a gas chromatograph equipped with a FID detector and by gravimetry. The average molecular weights and molecular weight distributions of the backbone polymers and the subsequent brushes were measured by GPC from Wyatt equipped with Waters microstyragel columns (pore size 105, 104, 103Å) coupled with a multi-angle laser light-scattering (MALLS) detector (DAWN EOS, λ=690 nm). The dn/dc=0.045 mL/g of the poly(alkyl acrylate) chains was determined from refractive index measurements on a series of solutions (~0.1–1.0 mg/mL in THF) using an Abbe Refractometer NAR-1T from Atago USA, Inc.).
33
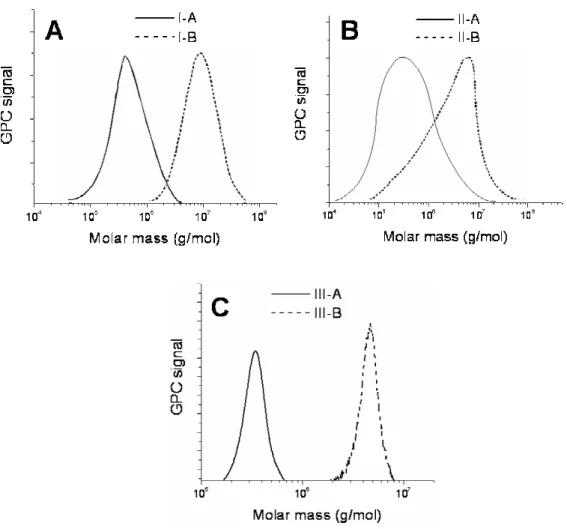
observed for MI(A), the methacrylate-based backbone, is significantly narrower than both AI(A) and AI(F). This is attributed to the absence of a reactive hydrogen in the growing chain that can participate in chain transfer to polymer side reactions which result in branches.
Subsequent grafting of PBA side chains from each backbone was successful as evidenced by the shift to higher molecular weights (Figure 2.1). The brush traces obtained have similar characteristics to their respective backbones, such that BA(A) and BM(A) peaks are narrower than that of BA(F). There is still a slight shoulder present in the high molecular weight region of the BA(A) curve, reflecting the backbone characteristic. The trace for BA(F) is still very broad, with emphasis on the lower molecular weight region, which again highlighted the prevalence of termination during backbone polymerization.
35
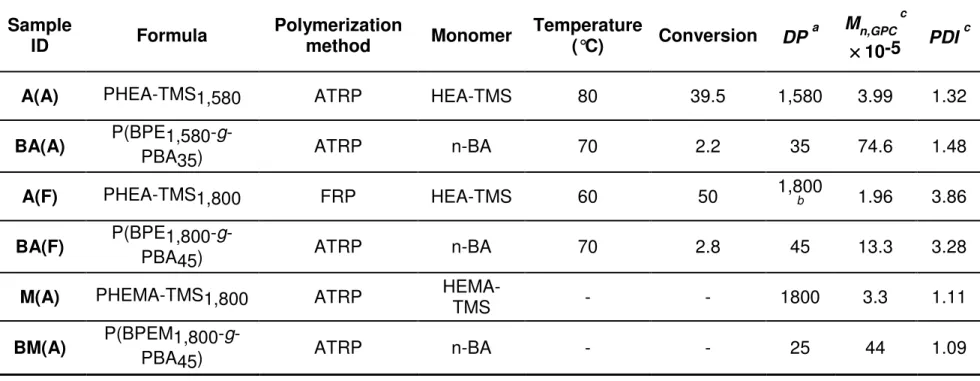
Table 2.1. Reaction conditions and characterization of PBA brush polymers.
Sample
ID Formula Polymerization method Monomer Temperature (°C) Conversion DP a Mn,GPC c
×××× 10-5 PDI c
A(A) PHEA-TMS1,580 ATRP HEA-TMS 80 39.5 1,580 3.99 1.32
BA(A) P(BPE1,580-
g-PBA35) ATRP n-BA 70 2.2 35 74.6 1.48
A(F) PHEA-TMS1,800 FRP HEA-TMS 60 50 1,800 b 1.96 3.86
BA(F) P(BPE1,800-PBA45) g- ATRP n-BA 70 2.8 45 13.3 3.28
M(A) PHEMA-TMS1,800 ATRP HEMA-TMS - - 1800 3.3 1.11
BM(A) P(BPEM1,800-
g-PBA45) ATRP n-BA - - 25 44 1.09
a: Obtained from gravimetry
2.2.4. Branching characterization by AFM
Molecular imaging of individual molecules by an AFM can resolve some of the issues both discussed and experienced in previous sections as it allows direct quantitative analysis of both distribution and length of branches along the backbone. Single molecule films were prepared by spincasting dilute chloroform solutions (~0.01%wt.) onto freshly-cleaved mica. Dense films were prepared using the Langmuir-Blodgett deposition. Each polymer film was transferred to freshly-cleaved mica at a controlled low pressure of 0.5 mN/m. The same procedure was used for the preparation of films of each polymer brush encapsulated in a matrix of linear PBA.
All of the films were imaged using a Multimode Atomic Force Microscope in tapping-mode. Silicon cantilevers with resonance frequencies of about 160 kHz, spring constants of 5.0 N/m, and radii less than 10 nm were used. Specially developed computer software was to obtain length measurements from the captured micrographs. Histograms were constructed from the height data obtained from the Nanoscope software (version 5.12).
37
backbone.1 The density of each film is affected by the width of the brushes. BM(A) has the narrowest width at 21 nm and BA(F) the widest at 70 nm. Thus, all of these factors combined facilitate molecular imaging and image analysis of molecular dimensions and branching topology.1
2.2.4.1. Molecular characterization by AFM
Length analyses were carried out using the dense monolayer film. It can be concluded from the results that molecules BA(A) and BM(A) are better defined than BA(F). Sample BA(F) demonstrates significantly broader length distribution, further highlighting the shortcomings of FRP, i.e. the prevalence of side reactions such as termination and disproportionation, throughout the polymerization (Figure 2.3). When comparing ATRP samples BA(A) and BM(A), the latter shows narrower length distribution than BA(A). These results are consistent with the GPC-MALLS data (Table 2.1 and Figure 2.1). However, one can see that the number average contour length Ln of BA(A) (240±10 nm) is shorter than expected (Ln,theo=380 nm), i.e. the
distribution is skewed towards shorter lengths (Figure 2.3) even when only selectively measuring the linear molecules present in the film. Thus, only a small percentage of the chains are at the target Mn ~5×10⁵ g/mol. In the case of BA(F), the
average contour length Ln (115±9 nm) is significantly shorter than theoretically
calculated (Ln,theo=430nm), which again highlights the shortcomings of FRP. The
molecular imaging. In addition, this could be due to the fact that AFM measures length and GPC hydrodynamic volume.58 For the poly(alkyl methacrylate)-based BM(A), the measured Ln (440±10 nm) is as expected (Ln,theo=430nm). Thus, it can
be concluded that little to no termination and side reactions such as chain transfer to polymer occurred during the polymerization reaction. A summary of the results are presented in Table 2.2.
39
40
Table 2.2. Length and branching analysis results for poly(alkyl acrylate) and poly(alkyl methacrylate)-based PBA brush polymers.
Sample ID Ln (nm) a PDIb Brush width (nm) Mn cx 10 (g/mol) -6 λλλλ (nm
-1) d x
104 λλλλb e x 103 ββββf x 10-3
BA(A) 24010 1.40.2 402 91 9.90.7 0.120.01 8.30.5
BA(F) 1159 1.90.6 704 21 141 0.180.04 5.60.9
BM(A) 44010 1.10.2 211 31 1.10.1 0.014 0.002 71 7
a: Number-average contour length b: Polydispersity Index, PDI = Lw/Ln
c: Number-average molecular weight by AFM-LB technique4 d: Number of branches per unit length
41 2.2.4.2. Degree of branching analysis by AFM.
From cursory inspection of the images, one can quickly detect three different molecular topologies present in both BA(A) and BA(F) and, to a significantly lesser extent, in BM(A): linear, branched, both LCB and SCB, and overlapping linear chains (Figure 2.2A–2.2C). To ensure that the branches observed were indeed chemically-formed structures, brush molecules were strongly diluted with linear PBA (10 wt.-%,/,90 wt.-%), which is a good solvent for the PBA brushes (Figure 2.2D– 2.2F). The excluded volume repulsion between the encapsulated brushes results in the extended conformation of brush backbones, while further separating individual molecules from each other.65 Such methodology reduces the number of physically overlapping entities to almost zero, ensuring that the branched molecules observed are a result of chemical linkages. As can be seen in Figure 2.2, it is clear that there are indeed randomly-branched, predominantly Y-shaped, molecules of chemical origin present in BA(A) and BA(F). In addition to LCB, one can also see SCB, manifested as knots along the backbone.
Figure 2.4 shows that majority of the species present in all of the samples are linear molecules with a small fraction of overlapping linear chains. Especially for the poly(alkyl methacrylate)-based sample BM(A), practically all the molecules present are linear chains with very few branched entities observed, with numbers significantly lower than BA(A) and BA(F) (Figure 2.4). As mentioned earlier, this is largely a consequence of the BM(A) chemical composition, that is methacrylates do not have a tertiary (3°) hydrogen available for chain transfer to polymer to occur.28, 46 Instead, methacrylates are prone to chain transfer to monomer reactions, which do not result in branched chains.67, 68 Impurities present in the methacrylate monomer and disproportionation reactions are the likeliest sources for which chain transfer can occur in poly(alkyl methacrylates).31
In the case of poly(alkyl acrylate)-based samples, the occurrence of random branching in both BA(A) and BA(F) is expected regardless of the polymerization technique. Acrylate monomers have a 3° hydrogen available for abstraction and thus, side reactions, such as chain transfer to polymer can occur easily by means of intermolecular transfer, intramolecular transfer or “backbiting”, or β-fragmentation at higher reaction temperatures.26, 28, 30, 31 And additional side reactions, such as disproportionation, and/or termination during various stages of the polymerization can also yield in long-branched molecules and short linear chains respectively.
43
monitored and therefore, had some variation in temperature (A(A): T=80°C vs. A(F): T=60°C) and conversion (A(A): 40% vs. A(F): 50%), no definitive conclusion about which polymerization method produces unwanted branching can be made at this point.
methods for synthesizing macromolecules of high quality and definition. Results are summarized in Table 2.2.
Figure 2.4. Distribution of the topologies present in poly(alkyl acrylate) and poly(alkyl methacrylate)-based brushes. Majority of the molecules present are in all three are linear chains. However, both (A) BA(A) and (B) BA(F) have more branched structures that are chemical in origin compared to more linear chains in (C) BM(A). The difference in heights from one sample to the other can be attributed to tip variations.
2.2.5. Branching characterization by GPC-MALLS
45
(conformation plot). A more quantitative branch ratio g across the entire molecular weight spectrum is possible as long as there is an area of overlap in the molecular weight ranges of the linear standard and the samples to be analyzed.
The branching characteristics of acrylate-based backbones AI(A) and AI(F) were studied using GPC-MALLS with PMMA (Mn=460,000 g/mol, dn/dc=0.086
mL/g)70 as a linear reference standard. The PMMA-460k is used here strictly to illustrate the deviation from linear polymer behavior in a good solvent since there is no exact linear standard available for the backbones under study. Therefore, the quantification of branch ratio was not attempted here. Figure 2.5A shows the log Rg
vs. log Mn for AI(A), AI(F), and 460k. As can be seen, the slope of
PMMA-460k (ν=0.558±0.009) is consistent with Flory theory for a linear chain under good solvent conditions.71 For AI(A) and AI(F) the slopes are significantly less, at ν=0.363±0.001 and ν=0.487±0.004 respectively. In addition, there is an upward
curve observed at the higher molecular weight region of the AI(F) line. These are indications of branched structures. GPC-MALLS, however, does not give information about the shape of the branched macromolecules. The presence of branches in AI(A) is corroborated by 13C NMR data and molecular visualization of the brush macromolecules, and will be discussed in the next sections.
From the plot of the branch ratio g versus molecular weight, it can be seen that the viable molecular weight overlap range between PMMA-460k and the poly(alkyl acylate)-based backbones is quite narrow, only Mn~7.2 x10⁵–8.7x10⁵
drawing conclusions about the branching characteristics of AI(A) and AI(F) as the difference in branch ratio between the two polymers is actually very small (g~0.06-0.07). As such, it is very difficult to draw a solid quantitative conclusion regarding the branching characteristics of AI(A) and AI(F), because of the linear standard used and the narrow range of values obtained from the analysis.
Figure 2.5. Conformation plot of poly(alkyl acrylate)-based backbone AI(A) and AI(F). (A) The slopes of the lines for AI(A) and AI(F) are less than ν~0.6 (Flory exponent for an ideal linear chain in a good solvent) as observed for PMMA-460k. (B) Plot of the branch ratio, relative to PMMA-460k.
2.2.6. 13C NMR branching analysis
One of the conventional methods for branch analysis, 13C NMR was used to study AI(A), and the results were compared with that obtained from GPC-MALLS. The 13C NMR experiments (1H-decoupled, DEPT, and quarternary carbon) carried out on the acrylate backbone (in CDCL3) were acquired using a 500 MHz Bruker DRX 500.
47
present in the poly(alkyl acrylate) pendant group are observed at around chemical shifts ~ 20, 40, 62, and 170 ppm, relative to TMS. Signals from the backbone carbons are very broad and contain multiple peaks within the main peak ( ~34, 41, 173 ppm), indicating the presence of numerous isomeric configurations in AI(A).72 A solvent peak (CDCL3) is present at ~80 ppm. Lovell, et.al. observed a quaternary carbon (Cq) signal at ~ 47-48 ppm for poly(n-butyl acrylate) and poly(2-ethylhexyl acrylate) chains synthesized free-radically.46, 53 But because AI(A) has a slightly different chemical environment than the aforementioned poly(alkyl acylates), the Cq signal for AI(A) may be shifted, and may possibly be covered by signals from other more abundant carbons at ~40 ppm. Peak assignments are summarized in Table 2.3.
there is a peak present at ~41 ppm, which is attributed to the branched carbon present in AI(A).
49
Table 2.3. 13C NMR peak assignments.
2.2.7. Conclusions and Future work
Molecular imaging of branching in linear poly(alkyl acrylate)-based macromolecules synthesized by ATRP and FRP was carried out successfully using AFM. In agreement with GPC-MALLS and 13C NMR measurements, AFM reveals well-defined molecules in the ATRP-made polymers (BA(A) and BM(A)) and poorly-defined molecules in the FRP sample (BA(F)). Quantification of the degree of branching in each model system was achieved through this simple and direct method.
There are limitations in the methodology for analyzing branching by AFM. One of the major limitations is the additional modification necessary to make the molecules visualizable by AFM. If side-chain grafting is impossible, there are other
Peak δδδδ, ppm Assignment
A 21 Pendant methyl
B 40 Pendant methine
C 62, 63 Pendant methylenes
D 34 Backbone methylene
E 170 Pendant carbonyl away from the backbone F 173 Pendant carbonyl next to the backbone
G* ~41 Backbone methine
51
though at the expense of much lower resolution.16, 17 Another shortcoming of this method is that the analysis is only limited to the imaged molecules instead of the entire sample as is the case for the conventional techniques previously discussed. This can lead in incomplete branching statistics, although one can argue that the ability to analyze only relevant species is, in fact, more of an advantage than a limitation. Also, SCB quantification can be challenging due to the decreased resolution for chains shorter than 3-4 carbon lengths. Further complications arise if the macromolecules form loops and/or kinks on the surface. Because these structures have comparable junction heights with SCB, this can result in a higher degree of branching, a distinct possibility in the analysis of BA(A) which has substantially more chains with knots than BA(F).
Regardless of these issues, branching analysis by AFM has numerous advantages as an analytical technique as it allows for direct visualization and verification of molecular topology. Furthermore, branch quantification, both average branch values and branch distribution across lengths/molecular weight, are possible without any complex mathematical relations, assumptions about a material’s properties, and perfect linear standards. Thus, branching analysis by molecular imaging by AFM is an excellent complementary technique to the more conventional analytical methods, such as 13C NMR and GPC-MALLS, used to study branching in polymers.
Future work in this project includes:
temperature and/or monomer conversions, and the subsequent visualization of products from the various synthetic conditions in conjunction with 13C NMR and GPC-MALLS analyses.
(2) Determination of the predominant branching pathways in ATRP: the incorporation of markers at chain ends may help in determining the primary mechanism by which branching occurs in ATRP, i.e. macromonomer formation and addition versus intramolecular CT.
2.3. Conformation of gradient brushes18
Advances in polymerization techniques, especially living anionic and other controlled radical polymerization, have made preparation of polymer molecules with controlled composition and Mn possible. However, it was not until just recently that
53
Gradient copolymers are a new class of materials complementary to random, statistical, and block copolymers (Scheme 2.2A). Some of the more interesting properties of these polymers are broad glass transition temperatures Tg, lower shear
moduli, and longer elongation capability.75 Their unique properties make them attractive candidates for many industrial applications, including blend compatibilizers and stimuli-responsive materials.
Well-defined gradient molecules can be synthesized by ATRP either spontaneously or forcefully though the later method is preferred because it allows for broader compositional range.75, 76 Despite the synthetic capabilities, characterization of the chemical composition, i.e. the sequence of the monomeric units, is still lacking. Molecular visualization can be used for both visualization and profile analyses of these gradient copolymers. For this particularly study, gradient samples with different grafting densities were synthesized via spontaneous copolymerization of methyl methacrylate (MMA) with the ATRP initiating group, 2-(trimethylsilyloxy)ethyl acrylate (HEA–TMS), as well as n-butyl acrylate (n-BA) with the 2-(trimethylsilyloxy)ethyl methacrylate (HEMA–TMS) initiator. In order to visualize and characterize these materials using AFM, these gradient copolymers were decorated with PBA side chains, grafted from each of the initiating moieties (Scheme 2.2B).
2.3.1. Theoretical behavior of gradient brushes upon adsorption
certain grafting density, not all the side chains present can adsorb onto the surface due to space constraints. Thus, a large fraction of the side chains segregate along the backbone above the substrate surface, creating a bulky head region as seen in Scheme 2.5. Moreover, in this region, the repulsive interactions between the side chains will cause the backbone to stretch to full extension. However, when the grafting density is decreased, that is, more spacers such as MMA are incorporated, there will come a point when there will be enough room on the surface to accommodate all the side chains. This creates a flat and less distinct tail region. In addition, the reduced repulsion between the side chains results in the contraction of the backbone.
55 2.3.2. Visualization and length analysis
Single molecules of three gradient brushes were visualized and characterized by AFM: IA-1, IA-2, and IIA-1. Spincast films of each molecule were visualized using a Multimode Atomic Force Microscope in tapping-mode and silicon cantilevers with resonance frequencies of about 160 kHz, spring constants of 5.0 N/m, and radii less than 10 nm. Specially developed computer software were used to obtain for length measurements from the captured micrographs.
Molecules IA-1 and IA-2 are composed of MMA and HEA–TMS at 1:1 and 3:1 ratios respectively. Molecule IIA-1 is composed of BA and HEMA–TMS at a ratio of 5:1. Figure 2.7 shows height micrographs of all 2 brush molecules. GPC results are summarized in Table 2.4.
Statistical analysis of the brushes was undertaken.18 As expected, the measured contour lengths of all samples reflected the flexibility of the backbones due to the incorporation of spacer groups. The length per monomeric unit lm values
of the molecules were less than the all-trans extended length of lm≅0.25.1, 18 Since
the calculated values are within statistical error of each other, it was difficult to obtain a linear correlation between the gradient density and molecular lengths. However, there was a decreasing lm trend from IA-1, IA-2, and IIA-1, a reflection of the
57
Table 2.4. Summary of molecular characterization results of gradient brush copolymers. (Reprinted with permission from 18. © 2005 American Chemical Society.)
GPC-MALLS / GC AFM
Sample
ID Composition Backbone Nbb Mnx 10, g/mol -5 PDI DPSC a Ln a (nm) Db (nm) lmc (nm) PDId
IA-1 MMA/HEA-TMS (1:1) 515 3.27 1.32 40 90 ± 7 14 ± 3 0.175 ± 0.02 1.27 ± 0.03
IA-2 MMA/HEA-TMS (3:1) 450 2.52 1.29 30 75 ± 2 14 ± 1 0.167 ± 0.02 1.27 ± 0.02
IIA-1 n-BA/HEMA-TMS (5:1) 390 2.56 1.37 38 64 ± 3 15 ± 1 0.164 ± 0.02 1.24 ± 0.03
a:Degree of polymerization of PBA side chains determined from GC b: Number-average contour length
c: Average width of side chains measured by AFM d: Length per monomeric unit of backbone, Ln/Nbb