PHYSICAL CHARACTERIZATION OF CHITOSAN FLOCS AND ASSESSMENT OF MICROBIAL REDUCTIONS WITH THE USE OF CHITOSAN ACETATE AS A CLOTH
FILTER AID
Hemali H. Oza
A thesis submitted to the faculty at the University of North Carolina at Chapel Hill in partial fulfillment of the requirements for the degree of Master of Science in the Department of Environmental Sciences and Engineering in the Gillings School of Global Public Health.
Chapel Hill 2019
iii ABSTRACT
Hemali H. Oza: Physical Characterization of Chitosan Flocs and Assessment of Microbial Reductions with the use of Chitosan Acetate as a Cloth Filter Aid
(Under the direction of Mark D. Sobsey)
iv
ACKNOWLEDGEMENTS
I would like to thank my advisor, Dr. Mark Sobsey, for his guidance, support, and encouragement over the past five years, during my undergraduate and graduate studies. I would also like to thank my committee members, Dr. Michael Fisher and Dr. Louise Ball, for their support, valuable contribution to this project, and advice over the years. I would like to thank Ellie Holmes, Collin Knox Coleman, and Juan Camacho for always lending a helping hand in and out of lab and for providing the support and guidance throughout my project.
I would also like to thank my dedicated team of undergraduates, Megan Miller, Sara Lafontaine, Shruti Patel, and Bec Edward. Their work in lab during the year made this research possible and enjoyable!
Additionally, I would like to thank Dr. Mark Wiesner, Dr. Nathan Bossa, and Amalia Turner from the Civil and Environmental Engineering Department in the Pratt School of Engineering at Duke University for allowing me to use their facilities and for providing valuable insight and contributions to this research project.
I would like to thank the UNC Odum Institute for aiding with statistical analysis. I would also like to thank The UNC Gillings Innovation Lab awards, which provided valuable funding sources for much of the chitosan research.
v
TABLE OF CONTENTS
List of Tables ... vii
List of Figures ... viii
List of Abbreviations ... x
Chapter 1: Introduction ... 1
Chapter 2: Literature Review ... 6
2.1 Household and Point-of-use Water Treatment Technologies ... 6
2.2 Filtration as a POU ... 10
2.3 Cloth Filtration ... 11
2.4 Coagulation ... 13
2.5 Chitosan ... 17
2.6 Filtration and Chitosan ... 19
2.7 Particle Size Measurement Methods ... 21
2.8 Mastersizer 3000 by Malvern ... 23
2.9Objective ... 25
Chapter 3: Methods ... 27
3.1 Chitosan ... 27
3.2 Cloth Filtration ... 27
3.3 Overview of experimental evaluation methods ... 27
3.4 Water Source ... 28
vi
3.6 Chitosan Treatment and Filtration... 30
3.7 Filter Cloth Decontamination ... 32
3.8 Microbial Sampling Points ... 33
3.9 Microbiological Methods for Bacteria Enumeration in Experiments ... 33
3.10 Microbiological Methods for Virus Enumeration in Experiments... 34
3.11 Physical-Chemical Parameters ... 35
3.12 Physical Size Analysis of Floc Particles ... 35
3.13 Statistical Analysis ... 37
Chapter 4: Results ... 38
Chapter 5: Discussion ... 62
5.1Log10 E. coli, MS2 and Turbidity Reduction Performance of Chitosan Acetate and Cloth Filtration ... 62
5.2 Chitosan Mechanisms ... 71
5.3 Prior Work ... 72
5.4 Limitations ... 75
5.5 Future Work ... 77
Chapter 6: Summary and Conclusions ... 79
Appendix A: Preliminary Experiments ... 81
Appendix B: Previous Work ... 84
Appendix C: Certificate of analysis for food grade chitosan acetate ... 86
Appendix D: Raw LRVs for E. coli KO11 and MS2 coliphage ... 87
Appendix E: Raw Log10 Reductions for Turbidity and pH ... 88
vii
LIST OF TABLES
Table 1.1 The five categories of household drinking water services as defined by JMP…………3
Table 2.1 WHO performance targets for bacterial, viral, and protozoan Log10-reductions to meet specified levels of protection….……….6
Table 2.2 Laboratory vs. field based studies of commonly used POU technologies………...8
Table 2.3 Parameter conditions for microbial experiments.….……….26
Table 2.4 Parameter conditions for particle size analysis experiments…….………....26
Table 3.1 Experimental parameters that included two different challenge waters, 0 and 10 mg/L concentration of chitosan acetate, and three different floc stirring conditions………..31
Table 3.2 The three stirring conditions used, standard, intermediate, and minimal, were defined by various mixing and settling conditions………...32
Table 3.3 Mastersizer 3000 by Malvern settings for chitosan Acetate coagulation- flocculation and sedimentation experiments using three stirring conditions………36
Table 4.1 Quality parameters and values for raw water samples used in experiments………….38
Table 4.2 LRVs and associated 95% confidence intervals for E. coli KO11 and MS2 coliphage per challenge water type, stirring condition, and various points of water sampling………39
Table 4.3 Raw Turbidity values for each sampling point by stirring condition and test water….46 Table 4.4 Raw pH values for each sampling point by stirring condition and test water………...47
Table 4.5 Percent change in pH and Log10 reduction in turbidity and associated 95% confidence intervals for the two types of challenge waters, three different stirring conditions, and filtration alone. Changes in pH and Log10 reductions from pre-treatment and filtration together……….47
Table 4.6 Comparisons and estimated mean differences in average LRVs of E. coli KO11, MS2 coliphage, and turbidity for comparison parameters listed…………51
Table 4.7: Average particle size results and 95% confidence intervals from the last 30 data points of the particle sizer for each triplicate experiment per challenge water type and stirring condition……….58
viii
LIST OF FIGURES
Figure 2.1 Molecular structures of chitin and chitosan………..18 Figure 2.2 Schematic of a granulometer illustrating particles scattering light..………22 Figure 2.3 Differences in scattering angles among larger and smaller particles
that pass through the Mastersizer measuring cell. (image from Malvern)………24 Figure 2.4 Mastersizer 3000 by Malvern with red and blue laser beam sources
that aid in the detection of larger and smaller particles (image from Malvern)…………24 Figure 3.1 Cloth filtration apparatus set-up………...28 Figure 3.2 Schematic of test water sampling points throughout an experimental run…………...33 Figure4.1Averages and 95% confidence intervals of E. coli KO11 Log10
Reduction Values (LRVs) in non-pasteurized-sewage amended samples from filtration alone and filtration after 10 mg/L chitosan acetate coagulation
pre-treatment………..40 Figure 4.2 Averages and 95% confidence intervals of E. coli KO11 Log10
Reduction Values (LRVs) in 1% pasteurized-sewage amended samples from filtration alone and filtration after 10 mg/L chitosan acetate coagulation
pre-treatment………..41 Figure 4.3Averages and 95% confidence intervals of MS2 coliphage Log10
Reduction Values (LRVs) in non-pasteurized-sewage amended samples from filtration alone and filtration after 10 mg/L chitosan acetate coagulation
pre-treatment………..43
Figure 4.4 Averages and 95% confidence intervals of MS2 coliphage Log10
Reduction Values (LRVs) in 1% pasteurized-sewage amended samples from filtration alone and filtration after 10 mg/L chitosan acetate coagulation
pre-treatment……….……….45
Figure 4.5 Averages and 95% confidence intervals of Turbidity Log10
Reduction Values (LRVs) in 1% and non-pasteurized-sewage amended samples among three different water flocculation stirring
conditions—standard, intermediate, minimal—and filtration alone…………...………...48
Figure 4.6 Percent change in pH among 1% and non-pasteurized-sewage
amended samples among three water flocculation stirring conditions—standard,
ix
Figure 4.7 Floc size distribution over time with standard stirring procedures
in non-sewage challenge waters (n = 51)………...52
Figure 4.8 Floc size over coagulation-flocculation and sedimentation process
with intermediate stirring conditions (n=61)……….53
Figure 4.9 Floc size over coagulation-flocculation and sedimentation process
with minimal stirring conditions (n=55)………54
Figure 4.10 Floc sizes over coagulation-flocculation and sedimentation processes with standard stirring conditions in 1% pasteurized-sewage amended challenge
waters. (n=63)………55
Figure 4.11 Floc sizes over coagulation-flocculation and sedimentation processes with intermediate stirring conditions in 1% pasteurized-sewage amended
challenge waters. (n=61)………56
Figure 4.12 Floc sizes over coagulation-flocculation and sedimentation processes with minimal stirring conditions in 1% pasteurized-sewage amended
samples. (n = 61)………57 Figure 4.13 Average median (Dx(50)) floc measurements by stirring conditions
and challenge water type over coagulation-flocculation sedimentation
x
LIST OF ABBREVIATIONS
AA Awesome Agar
BSF BioSand Filter
CFU/mL Colony forming unit/milliliter CWF Ceramic water filters
DAL Double Agar Layer
DALY Disability-Adjusted Life Year DD Degree of deacetylation DLS Dynamic Light Scattering DOC Dissolved organic carbon
EPA Environmental Protection Agency GlcNAc N-acetyl-D-glucosamine
GlcN D-glucosamine
HICs High Income Countries
HWTS Household Water Treatment Systems JMP Joint Monitoring Program
LMICs Low- and Middle-Income Countries LRV Log10 Reduction Value
MDG Millennium Development Goal mg/L Milligram per liter
xi PFU Plaque-forming units POU Point-of-Use
PSA Particle Size Analyzer
QMRA Quantitative Microbial Risk Assessment rpm Revolutions per minute
SDG Sustainable Development Goal SLS Static Light Scattering
SODIS Solar Disinfection TSB Tryptic Soy Broth
UV Ultraviolet
UNICEF United Nations International Children’s Emergency Fund WaSH Water, sanitation and hygiene
1
CHAPTER 1: INTRODUCTION
According to the World Health Organization (WHO), approximately 2.1 billion people lacked safely managed drinking water in 2015 (Table 1.1). Safely managed water is defined as drinking water collected from improved water sources that is also located on the premise and free of fecal and priority contaminants (WHO & UNICEF, 2017b). Rural and developing populations are less likely to have access to improved drinking water sources, as evidenced by the 90% of 884 million people living without access to improved drinking water who are located in rural and developing regions (WHO & UNICEF, 2017a; WHO, 2014a). Contaminated water can spread infectious diseases, including diarrhea and other gastrointestinal illnesses. These diseases are caused by a variety of different enteric pathogens, including protozoan parasites such as Entamoeba hystolytica, Cryptosporidium parvum and hominis, and Giardia lamblia; bacteria such
as Escherichia coli, Salmonella spp., Salmonella typhi, the cause of Typhoid fever, Vibrio cholera, the cause of cholera; and viruses such as hepatitis A and E viruses that cause infectious hepatitis as well as noroviruses rotaviruses and astroviruses that cause diarrheal and gastrointestinal illnesses (Kotloff et al., 2012). The lack of access to improved drinking water sources leaves developing and rural communities at a greater risk of being exposed to waterborne diseases (WHO & UNICEF, 2015).
2
2014). The Sustainable Development Goals (SDGs), continue to highlight the gap in service by calling for “universal and equitable access to safe and affordable drinking water by 2030,” (WHO,
2019). A systematic review and meta-analysis of 319 studies, reporting on over 90,000 water samples, found over a quarter of improved source samples contained fecal contamination in 39% of 191 studies; samples collected from rural areas and low-income countries were more likely to be contaminated as compared to samples from wealthier countries (Bain et al., 2014).
3
Table 1.1 The five categories of household drinking water services as defined by JMP.
Service Level Definition
Safely Managed
Drinking water from improved water sources and is located on premises; available when needed; free of fecal and priority contaminants
Basic Drinking water from improved water sources; collection from source does not take more than 30 minutes, roundtrip to collect water (including queuing)
Limited Drinking water from improved water sources; collection from source takes more than 30 minutes, roundtrip to collect water (including queuing)
Unimproved Drinking water from unprotected dug wells or unprotected springs
Surface Waters (No Service)
Drinking water collected directly from rivers dams, lakes, streams, canals, or irrigation channels
Adapted from WHO and UNICEF (WHO & UNICEF, 2017b)
4
Centralized water treatment, conventional piped water systems, and source water policies and regulations are common in high-income countries (HICs) and enable effective treatment and delivery of safe water to households. While larger cities within LMICs often have access to infrastructural resources, communities that experience urban sprawl and rural populations in LMICs may not have these water services in place. In 2015, an estimated 69% of the global population did not have access to piped water sources (WHO & UNICEF, 2017a). Although implementing conventional piped water systems and treatment facilities to deliver safe water to households are the ultimate goals of governments and public health agencies and the preferred means of providing safe water to all populations, many decades are needed to deploy long-term solutions in rural and developing parts of the world. This is because these types of infrastructural investments require technical expertise and large amounts of funding to build and maintain (Babu & Chaudhuri, 2005). Additionally, current water supplies in many LMICs still need further treatment prior to consumption because residual chlorine levels may not be high enough within the distribution system to achieve high quality drinking water (Reller, Mong, Hoekstra, & Quick, 2001; Weber et al., 2019). The responsibility of acquiring, treating, and storing water safely is essentially placed on many of the poorest communities (Sobsey, 2002). As utilities and governments improve service delivery, there is still a need for timely, achievable, and economical solutions to fill the gaps in these setting. Therefore, a focus on drinking water and treatment at the household level has been gaining attention (Thomas Clasen & Schmidt, 2007; Tom Clasen et al., 2015; Fewtrell et al., 2005).
5
6
CHAPTER 2: LITERATURE REVIEW
2.1 Household and Point-of-use Water Treatment Technologies
HWTSs and POUs are technologies that employ processes to physically, chemically, or biologically remove or destroy microbial and/or chemical contaminants in water. Although many POUs are simple to use, affordable, and practical for developing and rural communities, not all technologies deliver the same degree of water quality improvement (Agrawal & Bhalwar, 2011; Sobsey, 2002; Sobsey, Stauber, Casanova, Brown, & Elliott, 2008; WHO, 2011b). WHO has established quantitative performance targets for HWTSs by specifying the Log10 reduction
benchmarks that must be met for bacterial, viral, and protozoan reductions (WHO, 2011b).
Table 2.1 WHO performance targets for bacterial, viral, and protozoan Log10-reductions to meet
specified levels of protection (WHO, 2014b).
: 4 log10 reductions of bacteria, 5 log10 reductions of viruses, and 4 log10reductions of protozoa
: 2 log10 reductions of bacteria, 3 log10 reductions of viruses, and 2 log10reductions of protozoa
: Meets standards of at least two classes of pathogens for the 2-star benchmark7
protection (high pathogen reduction), and one star denotes targeted protection. A zero-star level indicates little or no protection.
Specific performance levels are associated with limiting the burden of disease, measured in Disability-Adjusted Life Years (DALYs). The protection from microbes delivered by a three-star level (highly protective) technology, assuming proper and consistent use, is associated with limiting lost DALYs attributable to water-related disease to below 10-6 per person. Two-star (protective) technologies are associated with limiting lost DALYs to below 10-4 per person (WHO,
2011a, 2016).
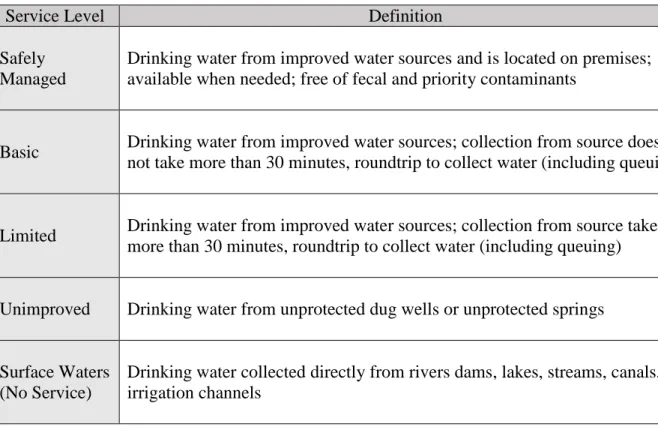
8
In Sobsey et al. (2008), popular POU technologies were documented for their effectiveness at removal of microbial contaminants in both laboratory and field settings. The POUs assessed in the study were ceramic water filters (CWFs), BioSand filters (BSF), solar disinfection (SODIS), free chlorine disinfection, and chemical coagulation with chlorination. The study found that Log10 Reduction Values (LRVs) achieved in field settings were less than half the LRVs
achieved in a controlled laboratory setting, especially among human enteric viruses that are not reduced effectively by POU filtration technologies such as ceramic and BioSand microporous filters, indicating inadequate health protection in practice (Table 2.2) (Sobsey et al., 2008). Table 2.2 Laboratory vs. field based studies of commonly used POU technologies
POU
Technology Pathogen
Field Results (LRV) Laboratory Results (LRV)
Factors influencing performance efficacy Ceramic Water Filters (CWF) Bacteria Viruses Protozoa 2 0.5 4 6 4 6
Pore size, flow rate, filter composition, and metal augmentation (Sobsey, 2002; Brown et al., 2007; Brown, 2007)
Biosand filtration (BSF) Bacteria Viruses Protozoa 1 0.5 2 3 3 5
Filter biological maturation, water dosing conditions, flow rates, water idle time within the sand layer, time between water dosing, granular media size, and
challenge viral agent
(Elliot et al., 2006 and 2008; Stauber et al., 2006; Palmateer et al., 1999)
Solar disinfection (SODIS) Bacteria Viruses Protozoa 3 2 1 5.5+ 4+ 3+
Temperature, turbidity, water depth, oxygenation, light intensity, and
exposure time (Sobsey, 2002; Wegelin et al., 1994; Reed, 1997; Kohn and Nelson, 2007; McGuigan et al., 2006)
Free chlorine disinfection Bacteria Viruses Protozoa 3 3 3 6+ 6+ 5+
Chlorine concentration, contact time, and turbidity (Crittenden et al., 2005; Sobsey, 1989 and 2002)
Coagulation/ chlorination Bacteria Viruses Protozoa 7 2-4.5 3 9 6 5
Turbidity and removal efficiency of chlorine resistant pathogens by
coagulation (Souter et al., 2003; Sobsey, 2002)
9
While there is variation in observed LRVs, studies have noted reductions in adverse health effects, with all five of the listed POUs able to achieve 30-40% reduction in diarrheal disease (Thomas Clasen & Schmidt, 2007; Fewtrell et al., 2005).
The maximum LRVs may be contingent upon different factors, depending on the specific POU technology. For example, LRVs as a result of filtration through CWFs are influenced by pore size, flow rate, filter composition, and metal augmentation while LRVs achieved with the use of BSFs may rely more on filter biological maturation, water dosing conditions, flow rates, filter bed contact time, time between water dosing, granular media size, and challenge viral agent (J. Brown & Sobsey, 2009; Palmateer et al., 1999; Sobsey, 2002; Stauber et al., 2006). SODIS efficacy may be more dependent on total oxygen content, solar exposure time, temperature, turbidity and depth of water. Microbial reductions due to chlorination have been shown to be influenced by turbidity, chlorine demand, and chlorine contact time (Sobsey, 2002).
Simple cloth/saree filtration, specifically, has not been studied extensively for microbial reductions from drinking water. However, size of contaminant particles is known to be a key factor influencing LRVs because pore sizes of cloth filters are relatively large compared to other POU filtration technologies (Colwell et al., 2002; Huq et al., 1983). A research study using simple cloth filtration of surface water sources in Bangladesh observed that cholera bacterial particles have preferential attachment to copepods, small 1-5 mm aquatic organisms, that are large enough to be readily filtered out. Because the copepods were readily removed using the 4-8 layers of cloth filters, cholera bacteria particles were also partially removed, resulting in a 2-Log10 reduction in
10
2.2 Filtration as a POU
While reducing microbial contaminants can be accomplished through an array of methods, practicality of methods may vary among communities and users. For instance, boiling water is an effective way to inactivate microbial contaminants. Dry fire wood and charcoal are two of the many different fuel sources used to boil water. These fuel sources, however, can be expensive or in short supply among the communities that employ this practice. Firewood is also often damp and not readily flammable, especially in South Asia where seasonal monsoons last for months (Colwell et al., 2002). Chemical disinfectants are also effective at inactivating microbes but can be expensive and difficult to dose, and their performance may be influenced by water quality characteristics such as the presence of organic matter, reduced inorganic and organic nitrogen species, and/or reduced transition metals, which can influence chlorine demand. Chemical disinfectants also produce harmful disinfectant byproducts and fail to reduce turbidity (WHO, 2011a).
11
Ceramic water filters (CWFs) are a popular and effective type of POU technology. Similar to granular media filters and BioSand filters, CWFs are effective at removing microbial contaminants as well as reducing turbidity (Abebe, Chen, Sobsey, Gray, & Karanis, 2016). The filters are made of clay and combustible materials such as sawdust, rice, or coffee husks— producing a microporous filter matrix once fired in a kiln. Oftentimes, colloidal silver is added to the ceramic filters to enhance pathogen inactivation. As influent water passes through the CWFs, microbial and other colloidal particles that contribute to turbidity are filtered out, and clarified effluent is produced (Hoepfner, 2018). These filters decrease turbidity levels to as low as 0.2 NTU, meeting WHO standards of <1 NTU; municipal water treatment facilities are required to reduce turbidity to <0.3 NTU (Bartby, 2016). However, high viral removal with CWFs remains unsuccessful, achieving only 0.4 Log10 reductions and potentially failing to achieve the 1-star level
of performance of health protection (Abebe et al., 2016; J. Brown & Sobsey, 2009; Joe Brown & Sobsey, 2010). While there is the potential to improve CWFs, high turbidity levels can limit their effectiveness by clogging the filter pores, potentially reducing the technology’s life span and requiring constant cleaning by users (Mohamed et al., 2015).
2.3 Cloth Filtration
12
household level. Although this HWTS method is widely used and accessible, cloth filtration has been only nominally effective.
A field study in rural parts of Bangladesh reported a 2 Log10 reduction in cholera bacterial
particles by using 4-8 layers of saree cloth as a POU filtration technology. The 4-8 layers of saree cloth created a pore size of about 20 μm. When examining the relationship between Vibrio cholerae and copepods, small crustacean type organisms often found in surface water sources, it
was reported that the bacteria has preferential attachment to copepod surfaces as well as egg cases and oral areas. The attachment of V. cholerae to copepods and the removal of the bacteria-laden copepods through cloth filtration by size exclusion superficially resembles the mechanism of bacterial removal through the use of coagulants prior to filtration (Huq et al., 1983). While the average virus with a 25-90 nm diameter may not be filtered out by cloth with a pore size of 20 μm, V. cholerae’s preferential attachment to copepods allows for bacterial particles to be readily
filtered out. The study also noted that best results were achieved when using slightly worn saree cloth rather than new material; as the worn cloth frays to give agitated threads and fibers that contribute to the trapping and filtration of particles containing cholera bacteria (Vibrio cholerae ) (Colwell et al., 2002).
A study using various layers of engineered fabric recorded 1.4 to 3.0 Log10 reductions of
E. coli as well as an exponential decrease in turbidity with the addition of fabric layers; however,
13
2.4 Coagulation
The process of coagulation-flocculation and sedimentation occurs when positively charged chemical compounds, known as coagulants, are added to water and bind with negatively charged particles, including clay, natural organic matter, microorganisms and other colloidal particles. The binding of coagulants and negatively charged contaminants creates flocs that settle out under the influence of gravity (Bartby, 2016). Coagulation describes the chemical process by which particles collide and remain together, whereas flocculation describes the mechanical process by which coagulated particles form and grow into larger floc particles. Generally, the greater the charge, size, and molecular weight of the coagulant, the more effective the compound is at coagulating contaminants and improving water quality (Shammas, 2005).The two main chemical coagulation mechanisms regarding synthetic polymeric and chemical coagulants are 1) charge neutralization and 2) inter-particle bridging (Shammas, 2005).
14
Coagulation has been used throughout history as a means of improving water quality. The Egyptians and Romans employed the process of alum coagulation as early as 1500B.C. and 77 A.D., respectively, and the English used alum as a coagulant in municipal water treatment in England as early as 1757 (IWA, 2019). Today, conventional water treatment plants typically employ four main processes when treating influent water: 1) coagulation-flocculation 2) sedimentation 3) filtration and 4) disinfection (Bartby, 2016).
Reducing turbidity levels is crucial to improve drinking water quality. Particulate matter such as clay, silt, inorganic and organic matter, and algae contribute to turbidity and can provide pathogens with nutrients and surfaces to adhere to and grown on. These turbidity causing particles can also contribute to pathogenic regrowth and aid in microbial survival by providing “shelter” from disinfectants. These particle-associated pathogens, if consumed, can cause waterborne diseases. While turbidity is not used as a health risk indicator, studies have suggested a strong relationship between turbidity and protozoan removal (USGS, 2019) and the World Health Organization recommends reducing turbidity of drinking water for potential health protection (WHO, 2017b). Benchmarks for turbidity of treated water have dropped from the 1989 standard of 1.0 NTU to current standards of 0.3 NTU; however, to protect against pathogenic contaminants, many water utilities have opted to produce effluent with turbidity levels ≤ 0.1 NTU.
15
2016; Bellamy, Cleasby, Logsdon, & Allen, 1993; Cleasby, 1989; Matilainen, Vepsäläinen, & Sillanpää, 2010; WHO, 2017b).
Inorganic coagulants are more commonly used than organic coagulants in municipal water treatment facilities. These coagulants are generally categorized into those that are aluminum based (aluminum sulfate, aluminum chloride, and sodium aluminate) and those that are iron based (ferric sulfate, ferrous sulfate, ferric chloride, and ferric chloride sulfate). Aluminum and iron based coagulants work by forming a charged poly-nuclear complex; the ions then quickly hydrolyze (Bartby, 2016). Hydrated lime and magnesium carbonate are also commonly used as coagulants, but more so for hard water. Mixing speeds, pH of influent water, and coagulant dosing are all important factors to consider when determining which chemical coagulant hydrolysis species is effective.
While coagulation-flocculation and filtration alone are two possible POU technologies, using the two as a multi-barrier technology has the potential to be more effective at removing pathogenic contaminants (Abebe et al., 2016).
The Procter & Gamble’s PUR packet is one such product that utilizes a multi-barrier approach; the PUR packet contains calcium hypochlorite for disinfection and ferric sulfate, an inorganic coagulant. Users are instructed to pour the packet’s contents into 10 liters of water,
rapidly mix for five minutes, let the water stand until observable settling of the floc is complete, pour the water through a cloth, and let the water stand for 20 minutes for further disinfection. Laboratory studies of the PUR packet plus cloth filtration, using both EPA-model and field-sample water from developing countries with spiked microbes, resulted in ≥ 4-Log10 reductions of polio
and rotavirus and ≥3-Log10 in Cryptosporidium parvum and Giardia lamblia (Souter et al., 2003).
16
different technologies. One technology, the PUR packet followed by filtration, resulted in ≥ 2.9-Log10 reductions in thermotolerant coliforms (Mohamed et al., 2015). The PUR packets have
shown that a multi-barrier approach to POU technologies can be more effective than single-barrier approaches (WHO, 2016).
Although effective at reducing turbidity and promoting the settling out particulate matter and microorganisms, inorganic coagulant performance is highly sensitive to changes in pH, temperature, and ionic strength and must be appropriately and accurately dosed to achieve maximum microbial and particulate matter removal. Specialized instruments and sensors are available in municipal water and wastewater treatment facilities to characterize influent water sources, calculate optimal dosing, and monitor treatment to ultimately ensure effective treatment. With regards to POU applications, these critical process control steps are not feasible, making proper dosing extremely challenging, given the potential for highly variable influent water quality conditions. Furthermore, inorganic coagulants produce harmful sludge byproducts that can be difficult to safely dispose of and can accumulate in the environment. Studies have reported that floc solid residuals from inorganic salts and other aluminum-based inorganic coagulants pose health risks, and the lifetime cumulative intake has been shown to play a role in the development of Alzheimer’s disease and other neurological disorders (Liu, Li, Zhang, Nie, & Wang, 2013; Matilainen et al., 2010). Inorganic coagulants effectively achieve high microbial reductions, but their need for precise dosing, performance variability with dose, and potential toxicity make inorganic coagulants an unattractive choice for POUs where there is a need for technologies that are safe, simple, and practical.
17
in South Asia and West Africa, has been referred to in many religious Hindu scriptures, such as the Vedas (Imran Ali et al., 2011). The Moringa oleifera plant has been observed to have seeds with coagulant properties and has been used for water clarification techniques for generations in rural Indian communities (Imran Ali et al., 2011). A study in rural and low-income Indian communities explored the effectiveness of Moringa oleifera and saree-cloth filtration as a pre-treatment step prior to UV disinfection as a point-of-use water pre-treatment system. The study used surface water samples from peri-urban slums in Chennai, India and assessed the effluent waters for turbidity, organic content by chemical oxygen demand (COD), and coliform bacteria concentration as MPN values. Laboratory studies have achieved 1-2 Log10 bacterial reductions
(Madsen, Schlundt, Fadil, & Omerf, 1987; Nkurunziza, Nduwayezu, Banadda, & Nhapi, 2009). However, various other studies have also documented secondary bacterial re-growth 24 hours after the initial M. oleifera treatment (Madsen et al., 1987; Oluduro & Aderiye, 2007). While the plant-based coagulant did show removal of seeded E. coli in challenge waters in a laboratory setting, M. oeifera was not able to effectively remove coliform from stored village water (Firth et al., 2010).
The effectiveness of S. potatorum and M. oleifera to achieve Log10-reductions in conjunction with
filtration was also studied, and ~2-Log10 reductions for bacteria and ~3-Log10 reductions for
viruses were achieved. While these plant species do have some coagulating effects, there are concerns for bacterial regrowth in treated water with the use of M. oleifera. Furthermore, plant species that can be used as coagulants are not always abundantly and readily available (Babu & Chaudhuri, 2005).
2.5 Chitosan
18
(Figure 2.1). Chitin is the second most abundant polysaccharide in the world and is a primary component of the exoskeletons of crustaceans. Chitosan is produced by chemically de-acetylating chitin using an alkaline treatment to form modified polymers (Figure 2.1).
Figure 2.1 Molecular structures of chitin and chitosan
While chitosan does not readily dissolve in water, acid salts of chitosan do and are easy to chemically derive from chitin. An alkaline treatment deacetylates chitin, exposing amino groups (-NH2). The amino group has a pKa value of ~6.5, which leads to protonation in neutral waters that
19
(DD), ranging from 40% to 98%, is also associated with higher solubility and a higher number of positive charges along the polymeric chain (M. N. V. Ravi Kumar, Muzzarelli, Muzzarelli, Sashiwa, & Domb, 2004).
When added to water, chitosan acts as a coagulant to facilitate the physical removal, by filtration, of viruses, bacteria, and other colloidal particulate matter that is captured onto larger flocs that settle out (Abebe et al., 2016).
The ability of chitosan salts to remove microbial contaminants from water through the coagulation-flocculation and sedimentation procedure is not well documented. Studies have observed an inverse relationship with chitosan DD and required chitosan dose; the higher the DD, the lower the required dose. For example, a DD of 99%, as compared to a DD of 38%, required 10x lower dose of chitosan hydrochloride (Sabina P Strand, Vandvik, Vårum, & Østgaard, 2001).
In terms of safety, chitosan is non-toxic and has been used in a variety of foods, nutritional supplements, cosmetic products, drug therapies, and other medical applications (Majeti N V Ravi Kumar, 2000).
In addition to being biodegradable, non-toxic, and abundant, chitosan pre-treatment is also able to achieve microbial reductions without being significantly affected by pH or coagulant dosing. These unique characteristics make chitosan a strong candidate for use in water treatment, specifically with POUs (Abebe et al., 2016). The effects of coagulation-flocculation and sedimentation procedures and conditions on chitosan floc formation and floc particle size distribution still need to be further explored.
2.6 Filtration and Chitosan
20
Sobsey, Casanova, Ball, & Stewart, 2015). Another study evaluated the bacterial, viral, and turbidity reductions achieved from the use of water-soluble chitosans followed by filtration through CWFs (Abebe et al., 2016). Chemically-defined test waters supplemented with kaolinite clay, E. coli KO11 bacteria, and MS2 coliphage were pre-treated with doses ranging from 5-30 mg/L using three specific chitosan salt types: chitosan hydrochloride (HCl), chitosan acetate (CH3COO-), and chitosan lactate (CH3CH(OH)CO2-). After the coagulation-flocculation and
sedimentation procedures, the supernatant water was poured into the CWFs. The combined effects of the chitosan pre-treatment and physical removal by the CWFs, resulted in mean 4-7.5 Log10
reductions for E. coli KO11 and mean 3-4.5 Log10 reductions for MS2 coliphages, with chitosan
acetate yielding the greatest reduction of the three tested coagulants. Turbidity was also consistently reduced to <1 NTU meeting the turbidity standards set by US EPA and WHO. Based on the WHO HWTS performance targets, the combined efforts of chitosan pre-treatment and CWF filtration met the 2-star level performance of health protection (Abebe et al., 2016).
While many viruses and some other pathogens are too small to be sufficiently filtered out by microporous filters alone, the use of chitosan as a pre-treatment step bas been shown to increase microbial reduction when combined with filtration (Abebe et al., 2016). While use of cloth filtration, in its current state, does remove particle-associated bacteria by size-exclusion to varying degrees, other microorganisms would easily pass through due to their small size. As cloth filtration is already a common practice among many developing and rural communities in South Asia, a chemical coagulation pre-treatment step prior to filtration, could coagulate and flocculate bacteria and viruses to greatly improve microbial and turbidity reductions (Colwell et al., 2002).
21
technologies such as cloth filtration, where the particle size of contaminants being filtered out is critical for maximizing microbial LRVs.
2.7 Particle Size Measurement Methods
The removal of suspended particles after coagulation-flocculation pre-treatment is vital to water treatment in both POU technologies and municipal water-treatment. Contaminant removal performance greatly depends on the size of these suspended particles; however, monitoring and capturing the true size, formation, and transformation of flocs in suspended water has proven to be difficult, but not impossible. Careful quantitative research concerning size distributions and concentrations of flocs in treated water is still lacking. Because flocs are porous and highly irregular, measurements of particle size are not always as accurate as the measurement of sediments, or more solid and regularly shaped particles (Xu, Fitzpatrick, & Gregory, 2008).
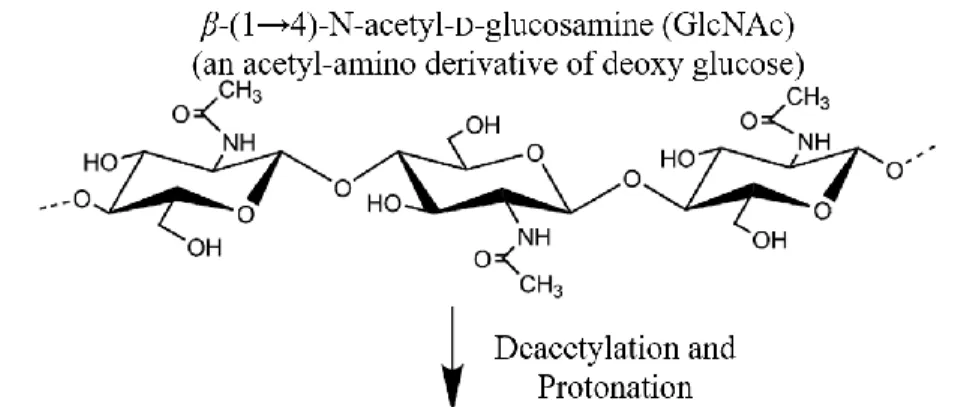
Laser and light scattering methods such as static light scattering (SLS) and dynamic light scattering (DLS) are often used to measure and identify particles that are several micrometers in
22
Figure 2.2 Schematic of a granulometer illustrating particles scattering light (Blott, Croft, Pye, Saye, & Wilson, 2004)
Coulter counters have accomplished particle size characterization. However, this method usually requires physical removal of a sample which could disturb formed flocs. Photography and videography analysis has been used to observe floc suspension and formation (Sun, Weber-Shirk, & Lion, 2016). Photometric dispersion analyzers (PDA) have also been used to measure floc sizes. This technique uses a light beam that passes through a flowing suspension, and the light intensity and the root mean square value of the fluctuating particles are then measured. PDAs are an effective option for showing qualitative changes in floc formation and aggregation (Ramphal & Sibiya, 2014).
23
2.8 Mastersizer 3000 by Malvern
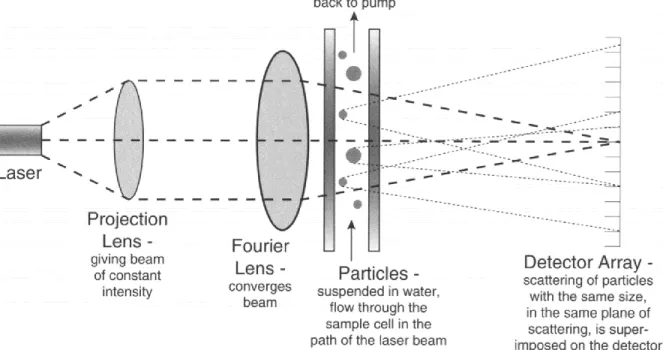
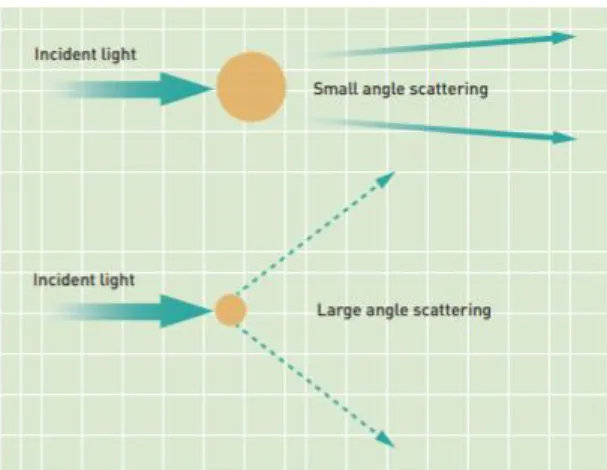
The Mastersizer 3000 by Malvern is a PSA instrument that has the ability to measure particles that range from 0.01 µm – 3,500 µm. The instrument uses laser diffraction measurements which are collected when a laser beam passes through dispersed particulates. The scattered light’s angular variation and intensity are measured and are then analyzed to calculate the size of particles that pass through the measurement cell that created the scattering pattern. As illustrated in Figure 2.3,smaller particles scatter light at a larger angle, and larger particles scatter light at a smaller angle. The Mie theory of light scattering is used to make these calculations and reports the size as a volume equivalent sphere diameter. The Mie theory’s assumption that the particles measured are perfect spheres is a modeling simplification (Malvern, 2013). To achieve one unique number to describe a non-spherical particle, different features can be compared between the irregular particle to be measured and a theoretical spherical particle:
1) equivalent surface area—finding a diameter of a sphere that has the same surface area
as the measured irregular particle
2) equivalent maximum length—finding a sphere with a diameter equivalent to the maximum length of the irregular particle
3) equivalent minimum length—finding a sphere with a diameter equivalent to the minimum length of the irregular particle
4) equivalent volumes—finding a sphere with a volume equivalent to the volume of the irregular particle
These features describe the technique of measuring irregular particles called “equivalent spheres”. The Mastersizer 3000 by Malvern utilizes the fourth technique listed, equivalent volumes
24
Red and blue light sources, as illustrated in Figure 2.4, are used to measure across the entire 10 nm - 3.5 mm size range. The red light aids in the measurement of larger particles while the blue light aids in the measurement of smaller particles.
Figure 2.3 illustrates the how scattering angles differ among larger and smaller particles that pass through the Mastersizer measuring cell. (image from Malvern).
Figure 2.4 illustrates the Mastersizer 3000 by Malvern and the red and blue laser beam sources that aid in the detection of larger and smaller particles (image from Malvern).
25
was able to successfully use the Mastersizer 3000 to analyze aggregate floc sizes formed during chemical coagulation (Lech, Marta, Michal, Harsha, & Krystyna, 2017).
The Mastersizer 3000 by Malvern was chosen to characterize and quantify the floc particle sizes and concentrations two types of test waters treated with 10 mg/L of chitosan acetate and three different stirring conditions during the flocculation process prior to cloth filtration. While other instruments such as a PDA, granulometer, or Coulter counter may have also been an attractive choice, the Mastersizer 3000 PSA instrument was readily available.
2.9Objective
While studies have shown the effectiveness of chitosan as a pre-treatment for POU water treatment technologies, there is still much to be learned about the use of this organic coagulant. Specific dosing for partnered filtration devices, optimal coagulation-flocculation and sedimentation procedures, and floc size distributions and characterizations are all unknown factors of chitosan coagulation-flocculation, preceding filtration.
26
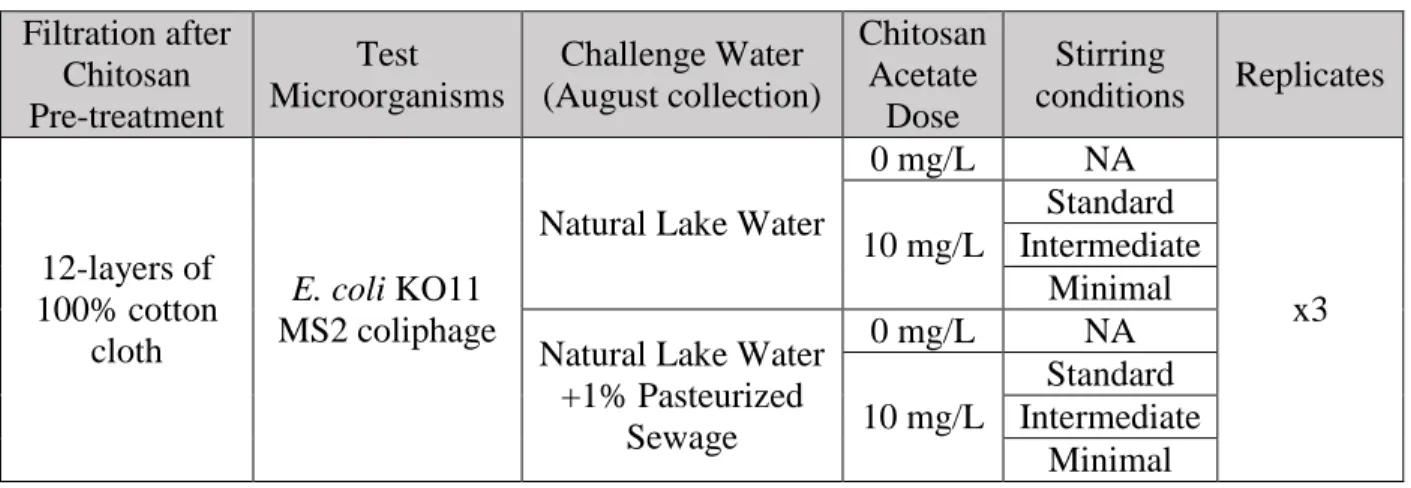
Table 2.3 Parameter conditions for microbial experiments Filtration after Chitosan Pre-treatment Test Microorganisms Challenge Water (August collection) Chitosan Acetate Dose Stirring
conditions Replicates
12-layers of 100% cotton
cloth
E. coli KO11 MS2 coliphage
Natural Lake Water
0 mg/L NA
x3 10 mg/L
Standard Intermediate
Minimal Natural Lake Water
+1% Pasteurized Sewage
0 mg/L NA
10 mg/L
Standard Intermediate
Minimal Table 2.4 Parameter conditions for particle size analysis experiments
Chitosan
Acetate Dose Challenge Water
Stirring conditions
(triplicate samples) Replicates
10 mg/L
Natural Lake Water (August 18, 2018)
Standard
x3 Intermediate
Minimal Natural Lake Water
+ 1% Pasteurized Sewage (March 1, 2019)
Standard Intermediate
27
CHAPTER 3: METHODS
3.1 Chitosan
Chitosan acetate (CH3COO-) (Food Grade Chitosan purchased from Sarchem
Laboratories, Inc. in powder form) was chosen for use in this experiment. This type of modified
chitosan was selected based on the results of previous studies comparing chitosan hydrochloride, chitosan acetate, and chitosan lactate. In that study, the use of chitosan acetate resulted in higher LRVs, ranging from 2.8-4.5 Log10-reduction in MS2 coliphage, compared to other acid-modified
chitosans (Abebe et al., 2016). The DD is 90.3% and the pH is 4.2 (Appendix C). The full chitosan analysis certificate from Sarchem Laboratories Inc. is in Appendix C.
3.2 Cloth Filtration
A 100% cotton linen material (200-count), bought from the bedding section of Wal-Mart, was layered twelve times and used as a filtration device. Twelve layers of the material was chosen based on preliminary experiments from 2017, which evaluated various layers and cloth types, to maximize the removal of test microbes from chitosan coagulated and flocculated water. Each layer was a square piece of 100% cotton linen material; 12 layers of the square material were stacked to create a filter.
3.3 Overview of experimental evaluation methods
28
water, and air dried for 24 hours. The filter effluent water collection containers were also soaked in a bleach solution for 30 minutes and rinsed with deionized water before being scrubbed and washed with soap and finally rinsed again with deionized water. Each container was sterilized with a 70% ethanol solution. After presoaking the cloth filters in deionized water, they were secured to a PVC column by tightly wrapping four to five rubber bands around the column (Figure 3.1). This cloth filter set-up ensured a tight seal that prevented unfiltered influent water from entering the effluent receiving container. The filter-column apparatus was placed over a 2 L beaker used to collect the filtrate.
Figure 3.1 illustrates and details the cloth filtration apparatus.
3.4 Water Source
29
MS2 (ATCC #15597-B1) each with a concentration ≥106 organisms per 100 mL to create influent challenge waters. These test water conditions provided a microbial concentration great enough to measure at most a 6-Log10 reduction, if achieved.
3.5 Challenge Waters
Two challenge waters were used: 1) natural lake water and 2) natural lake water amended with 1% by volume pasteurized sewage. The lake water was collected from University Lake in Chapel Hill, N.C. and primary effluent sewage was collected from the Orange Water and Sewer Authority (OWASA) Mason Farm Wastewater Treatment Plant.
Escherichia coli KO11 was the bacterium used because E. coli is an indicator for pathogenic enteric bacteria. MS2, a male-specific coliphage, was used as the model virus because its molecular characteristics, composition, and physical properties are similar to that of other human enteric viruses of health concern, such as noroviruses, enteroviruses, and astroviruses. Removal of MS2 coliphage is expected to be similar to removal of other human enteric viruses (WHO, 2016). Escherichia coli strain Famp was used as the host for propagation and infectivity
assay of MS2 coliphage.
A ~200 μL scrape of frozen E. coli KO11 culture of 109 colony forming units (CFU)/ 1 mL
30
incubation period, the culture was centrifuged at 3000x gravity for 10 minutes at 4 oC, and the sedimented cells were washed again with phosphate buffer for three successive rounds. The phosphate buffer was made by autoclaving and cooling a solution of 0.125% by volume of phosphate stock buffer (34.0 g of KH2PO4in 500 mL distilled water, adjusted to a pH of 7.2 with
a 1 M NaOH solution, and then diluted to 1 L with distilled water), 0.5% by volume of 0.4 M MgCl2, and deionized water. Approximately 20 mL of the washed E. coli KO11 suspension were
added per 10 liters of challenge water, producing a concentration of ~106 CFU/mL of E. coli KO11.
An entire 1 mL frozen stock sample of MS2 coliphage, with a titer of 1x10¹¹ plaque forming units (PFU) per milliliter, was thawed and spiked into the challenge waters as well. This produced a 106-108 PFU/mL suspension of MS2. The 1% by volume, pasteurized sewage
challenge water was prepared by using the same microbial methods with the addition of raw sewage (collected from OWASA each time per experimental day) that had been pasteurized at 70
oC for 30 minutes in a water bath. For every 2 L of challenge water, 20 mL of pasteurized
primary effluent sewage was added. The pasteurized sewage included the settled and suspended particles. Each filter was dosed with 2 L of a challenge water pre-treated with 10 mg/L of chitosan acetate followed by one of three stirring conditions or challenge water that was not pre-treated with chitosan. The chitosan acetate dose of 10 mg/L was chosen based on preliminary experiments (Appendix A).
3.6 Chitosan Treatment and Filtration
31
mL volume of 2 g/L of chitosan acetate stock solution was measured and added to each 2 L of challenge water. Directly after the addition of chitosan, the water was mixed using a jar-test-flocculator apparatus containing paddle blade stirrers to initiate the coagulation-flocculation processes. Water was stirred initially at 100 RPM for 1 minute and thereafter according to the conditions detailed in Table 3.2 for three different stirring conditions. After the allotted flocculation time, a sample of the post-flocculation treatment influent water was taken from the middle of the influent bucket and one inch below the surface. The collected sample was then used for microbial, physical, and chemical testing. The supernatant water of the two liters of challenge water were passed through the cloth filter apparatus, leaving 100 mL of settled flocs. A sample of each cloth filter effluent was then taken for microbial, physical, and chemical testing.
Each experiment was run in triplicate. Concentrations of E. coli bacteria, MS2 coliphages and turbidity were determined in each sample and then log10 microbial reductions were calculated
based on the differences in log10 concentrations among influent waters, cloth filter effluent
(untreated) waters, post-treated (coagulated-flocculated-settled) waters, and cloth filter effluent (treated) waters.
Table 3.1 Experimental parameters that included two different challenge waters, 0 and 10 mg/L concentrations of chitosan acetate, and three different floc stirring conditions.
Challenge Water Chitosan Acetate Dose
Stirring conditions (triplicate samples)
Natural Lake Water
0 mg/L NA
10 mg/L
Standard Intermediate
Minimal Natural Lake Water
+ 1% Pasteurized Sewage
0 mg/L NA
10 mg/L
Standard Intermediate
32
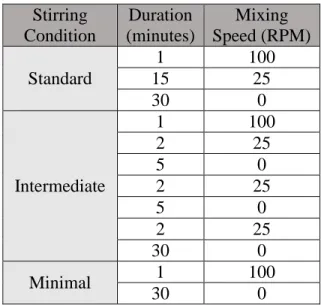
Table 3.2 The three stirring conditions used, standard, intermediate, and minimal, were defined by various mixing and settling conditions.
Stirring Condition
Duration (minutes)
Mixing Speed (RPM)
Standard
1 100
15 25
30 0
Intermediate
1 100
2 25
5 0
2 25
5 0
2 25
30 0
Minimal 1 100
30 0
The three different stirring conditions were chosen to resemble three different levels of mixing. The standard conditions are standard coagulation-flocculation and sedimentation procedures that are robust but not as practical in a field setting. Minimal conditions may be more practical in a field setting but may not facilitate proper floc formation, with just one minute of rapid stirring. An intermediate stirring condition was defined with the aim to create a mixing procedure that facilitated floc formation while still having the potential to be practical in a field setting.
3.7 Filter Cloth Decontamination
33
3.8 Microbial Sampling Points
Log10 concentrations of E. coli KO11 and coliphage MS2 were determined. Log10
reductions were calculated from differences in concentrations for the numbered sampling points listed in Figure 3.2 to assess removal due to the following processes: filtration alone, coagulation-flocculation-sedimentation pre-treatment alone, isolated effects of filtration after pre-treatment, and pre-treatment and filtration together.
Figure 3.2 Schematic of water sampling points throughout experimental run.
3.9 Microbiological Methods for Bacteria Enumeration in Experiments
34
were plated in duplicates. The plates were then inverted and incubated for 18-24 hours at 37°C and after the incubation period, the E. coli colonies on each plate were observed, counted, and recorded.
3.10 Microbiological Methods for Virus Enumeration in Experiments
For the influent and effluent samples, double agar layer plaque assays were used as described in US EPA method 1601 (EPA, 2001). The bottom agar medium of 1.5x TSA was prepared by adding 60 g of TSA per 1 L of deionized water. After autoclaving, the agar was cooled to 50°C in the water bath and 10 mL of Strep/Amp 100x antibiotic stock concentrate (containing 1.5 g/mL streptomycin sulfate and 1.5 g/mL ampicillin sodium salt, dissolved in deionized water, and filtered through a 0.22-μm-pore-size membrane filter) and 2.5 mL of 4 M MgCl2 were added
per liter of 1.5x TSA medium. Then, 12-15 mL of molten agar was plated into 100 x 15mm Petri dishes. The top 0.7x TSA molten agar medium was prepared by autoclaving a mixture of 28 g of TSA dehydrated medium per liter of deionized water. After the mixture was cooled to about 50°C in the water bath, 2.5 mL of 4 M MgCl2 were added. Serial 10-fold dilutions from -1 to -6 were
made of the pre-treatment influent, post-chitosan treatment influent, and post filtration effluent in phosphate buffer for MS2 plaque assay by the DAL method.
The E. coli Famp host for MS2 infectivity assay was prepared by inoculating a scrape (~200
μL) of frozen E. coli Famp culture into 50 mL of TSB with 0.5 mL of Strep/Amp 100x antibiotic
stock and incubating the suspension for 18-24 hours at 37°C. A log-phase E. coli suspension was made by adding 0.5 mL of the E. coli Famp overnight culture and 0.5 mL of Strep/Amp 100x stock
concentrate to 50 mL of TSB and incubating it on a shaker (at 100 rpm) for 2 hours at 37°C. After the allotted time had passed, the log-phase culture was removed from the incubator and the OD520
log-35
phase culture was ready to use. A 5% volume (250 µL) of the log phase E. coli Famp broth culture
and a 1% volume (50 µL) of the Strep/Amp 100x antibiotic stock concentrate solution was added per 5 mL of molten agar medium in each 10 mL glass tube. A 100 µL volume of the sample dilution was added to the 5 mL volume of the molten agar solution, exposed to a sterilization flame, swirled to mix, and then poured onto the bottom agar layer culture plate. After the agar set, the plates were inverted and incubated at 37°C for 18-24 hours. After the allotted incubation time, the MS2 plaques that formed on the lawn of the E. coli host were observed, counted, and recorded.
3.11 Physical-Chemical Parameters
Both turbidity (in NTU) and pH were tested for pre-treatment influent, post-treatment/pre-filtration, and post-filtration effluent for various concentrations of chitosan for both challenge waters. Differences in Log10 reductions of test microbes were calculated. Turbidity was measured
with a turbidimeter (Hach 2100AN Turbidimeter, Hach, Loveland CO) and pH was measured with a pH meter (pH Meter Model 215 Denver Instrument Company) and a combination electrode.
3.12 Physical Size Analysis of Floc Particles
36
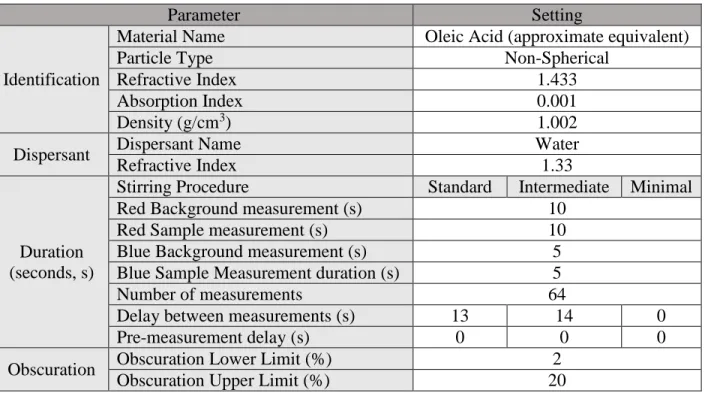
Table 3.3 Mastersizer 3000 by Malvern settings for chitosan acetate coagulation-flocculation and sedimentation experiments using three stirring conditions.
Parameter Setting
Identification
Material Name Oleic Acid (approximate equivalent)
Particle Type Non-Spherical
Refractive Index 1.433
Absorption Index 0.001
Density (g/cm3) 1.002
Dispersant Dispersant Name Water
Refractive Index 1.33
Duration (seconds, s)
Stirring Procedure Standard Intermediate Minimal
Red Background measurement (s) 10
Red Sample measurement (s) 10
Blue Background measurement (s) 5
Blue Sample Measurement duration (s) 5
Number of measurements 64
Delay between measurements (s) 13 14 0
Pre-measurement delay (s) 0 0 0
Obscuration Obscuration Lower Limit (%) 2
Obscuration Upper Limit (%) 20
37
3.13 Statistical Analysis
A linear regression analysis was conducted among E. coli KO11, MS2 coliphage, and turbidity reductions by pooling data points by parameters—challenge water type, dose, and stirring condition, and sampling point. Estimate mean difference, standard error, t-values, p-values, and 95% confidence intervals of Log10 reductions were reported. The last 30 data points per PSA
38
CHAPTER 4: RESULTS
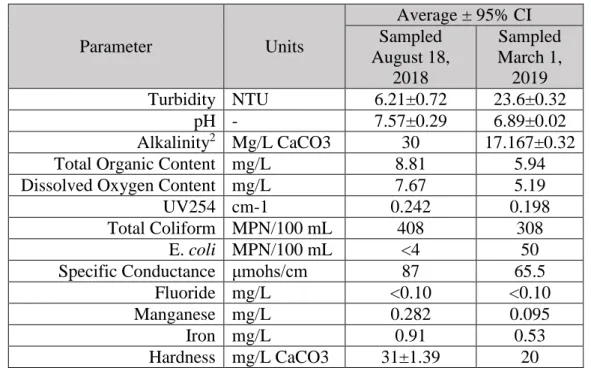
Table 4.1 Quality parameters and values for raw University Lake water samples used in experiments1
Parameter Units
Average ± 95% CI Sampled
August 18, 2018
Sampled March 1,
2019 Turbidity NTU 6.21±0.72 23.6±0.32
pH - 7.57±0.29 6.89±0.02
Alkalinity2 Mg/L CaCO3 30 17.167±0.32
Total Organic Content mg/L 8.81 5.94
Dissolved Oxygen Content mg/L 7.67 5.19
UV254 cm-1 0.242 0.198
Total Coliform MPN/100 mL 408 308
E. coli MPN/100 mL <4 50
Specific Conductance μmohs/cm 87 65.5
Fluoride mg/L <0.10 <0.10
Manganese mg/L 0.282 0.095
Iron mg/L 0.91 0.53
Hardness mg/L CaCO3 31±1.39 20
1Water for microbial experiments and for particle size analysis of test water with no added sewage
was sampled on August 18, 2019. Water used for particle size analysis for sewage-amended test water was sampled on March 1, 2019. Water quality measurements were reported by OWASA.
39
Table 4.2 LRVs and associated 95% confidence intervals for E. coli KO11 and MS2 coliphage per challenge water type, stirring condition, and various points of water sampling, in waters with and without chitosan acetate pre-treatment.
Challenge Water Type Stirring Condition Treatment Sections4
LRV ± 95% Confidence Interval
E. coli KO11 MS2 Coliphage
Non-past. Sewage amended
Filtration Alone 0.10 ± 0.03 0.1 ± 0.03 Standard3
Post CH 1.2 ± 0.3 1.7 ± 0.3 CH to EF 1.9 ± 0.3 1.4 ± 0.6 Effluent 3.1 ± 0.3 3.2 ± 0.6 Intermediate3
Post CH 1.2 ± 0.2 1.5 ± 0.2 CH to EF 2.4 ± 0.8 1.9 ± 0.3 Effluent 3.6 ± 0.8 3.4 ± 0.2 Original3
Post CH 0.8 ± 0.2 1.8 ± 0.4 CH to EF 2.3 ± 0.5 1.1 ± 0.4 Effluent 3.2 ± 0.5 3.2 ± 0.4
1% past. Sewage amended
Filtration Alone 0.1 ± 0.1 0.4 ± 0.3 Standard3
Post CH 1.3 ± 0.3 2.4 ± 0.3 CH to EF 2.1 ± 0.3 1.3 ± 0.3 Effluent 3.4 ± 0.3 3.7 ± 0.3 Intermediate3
Post CH 1.4 ± 0.2 2.4 ± 0.2 CH to EF 2.5 ± 0.5 1.1 ± 0.3 Effluent 4.1 ± 0.5 3.6 ± 0.3 Original3
Post CH 0.9 ± 0.1 1.3 ± 0.2 CH to EF 2.3 ± 0.6 2.3 ± 0.3 Effluent 3.2 ± 0.6 3.5 ± 0.3
3Dosed with 10 mg/L of chitosan acetate pre-treatment using the associated stirring condition 4Post CH = reductions due to chitosan pre-treatment alone; CH to EF = reductions due to filtration
alone after pre-treatment; Effluent = reductions due to pre-treatment and filtration together The average Log10 Reduction Values (LRVs) and 95% confidence intervals for E. coli
40
1) filtration, 2) chitosan treatment, 3) filtration alone after treatment, and 4) chitosan pre-treatment and filtration. Reductions due to filtration only after chitosan pre-pre-treatment were calculated by subtracting chitosan pre-treatment reductions from overall reductions produced by chitosan pre-treatment and filtration together.
Table 4.6 summarizes statistical findings from a linear regression analysis comparing challenge water types, stirring conditions, and LRVs from various sampling points. All raw LRV data can be found in the appendix D.
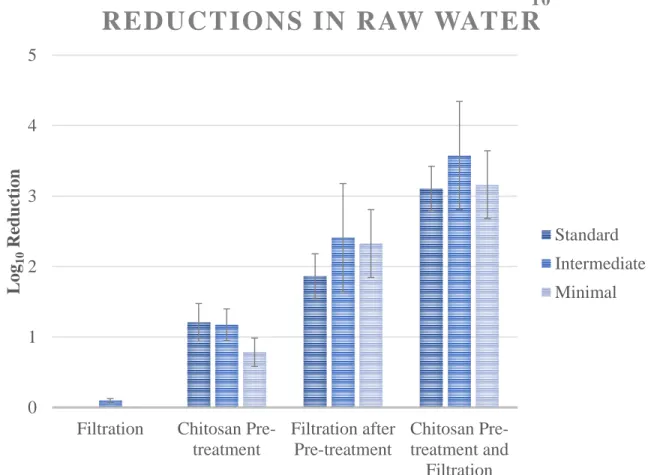
Figure4.1 Averages and 95% confidence intervals (whisker lines) of E. coli KO11 LRVs in non-pasteurized sewage-amended samples from filtration alone and filtration after 10 mg/L chitosan acetate coagulation pre-treatment.
Filtration alone (without pre-treatment) resulted in an average E. coli KO11 LRV of 0.1 ± 0.03 in non-sewage amended water and 0.1 ± 0.1 in sewage-amended water. Chitosan acetate
0 1 2 3 4 5
Filtration Chitosan
Pre-treatment
Filtration after Pre-treatment
Chitosan Pre-treatment and
Filtration
L
og
10
Re
d
u
ction
E. coli
KO11 BACTERIAL LOG
10REDUCTIONS IN RAW WATER
Standard
Intermediate
41
coagulation-flocculation pre-treatment alone in non-pasteurized sewage-amended waters, for the three different stirring conditions resulted in varying LRVs. Minimal stirring conditions produced the lowest LRV (0.7 ±0.201) and intermediate and standard stirring conditions resulted in LRVs slightly above 1.0 (Table 4.2). All three stirring conditions, with non-sewage amended challenge waters, resulted in average bacterial LRVs greater than 3.0. Intermediate stirring conditions resulted in the highest LRV (3.6±0.8), and standard and minimal conditions averaged somewhat lower, with 3.1±0.3 and 3.2±0.5 LRVs, respectively.
Figure 4.2 Average (bars) and 95% confidence intervals (whisker lines) of E. coli KO11 LRVs in 1% pasteurized sewage-amended water samples from filtration alone and filtration after coagulation-flocculation pre-treatment with 10 mg/L chitosan acetate.
E. coli KO11 LRVs in 1% pasteurized sewage-amended water samples appeared to
follow a similar trend as found in non-sewage amended water samples. The minimal stirring
0 1 2 3 4 5
Filtration Chitosan
Pre-treatment
Filtration after Pre-treatment
Chitosan Pre-treatment and
Filtration
L
og
10
Re
d
u
ction
s
E. coli
KO11 BACTERIAL LOG
10REDUCTIONS IN RAW WATER + 1%
RAW SEWAGE
Standard
Intermediate
42
conditions had the lowest average LRV due to chitosan coagulation-flocculation pre-treatment alone (0.9±0.1). Chitosan pre-treatment alone for the standard and intermediate stirring
conditions resulted in average LRVs of 1.3±0.3 and 1.4±0.2, respectively. Average bacterial reductions due to filtration alone, after pre-treatment, ranged from 2.1 – 2.5 Log10, with
intermediate stirring producing the highest average LRV. Bacterial reduction as a result of pre-treatment, intermediate stirring conditions, and filtration in 1% pasteurized sewage-amended raw waters were observed to be 4.1±0.5. The corresponding experiments associated with standard and minimal stirring conditions resulted in somewhat lower reductions, yet still achieved greater than 3 Log10 reductions.
When controlling for all other parameters, average E. coli KO11 LRVs in 1%
43
Figure 4.3 Average (bars) and 95% confidence intervals (whisker lines) of MS2 coliphage LRVs in non-pasteurized sewage-amended samples from filtration alone and filtration after coagulation-flocculation pretreatment with10 mg/L chitosan acetate.
MS2 coliphage LRVs due to filtration (after chitosan pre-treatment) were on average 0.30 LRVs higher than reductions due to chitosan pre-treatment alone (p-value < 0.022), and 1.31 LRVs higher than reductions due to filtration alone (p-value < 0.00001). Reductions due to the combined effects of chitosan pre-treatment and filtration were, on average, 3.21 Log10 reductions
higher than filtration alone (p-value < 0.00001) (Table 4.6).
Average MS2 coliphage reductions followed a similar trend as bacterial reductions in both non- and 1% sewage-amended raw water samples. Filtration alone (no pre-treatment) resulted in average LRVs of 0.1±0.03 and 0.4±0.3 for non- and 1% sewage-amended challenge waters, respectively (Table 4.2). In non-sewage amended challenge waters, pre-treatment alone
0 1 2 3 4 5
Filtration Chitosan
Pre-treatment
Filtration after Pre-treatment
Chitosan Pre-treatment and
Filtration
L
og
10
Re
d
u
ction
s
MS2 BACTERIOPHAGE LOG
10REDUCTIONS IN RAW WATER
Standard
Intermediate
44
produced similar average LRVs among all three stirring conditions, ranging from 1.5 – 1.8 Log10
reductions. However, average MS2 coliphage reductions due to chitosan
coagulation-flocculation pre-treatment in 1% pasteurized sewage amended samples varied, with standard and intermediate stirring samples resulting in average LRVs greater than 2 but minimal stirring samples achieving only about 1 LRV. All average MS2 coliphage Log10 reductions due to
45
Figure 4.4 Average (bars) and 95% confidence intervals (whisker lines) of MS2 coliphage LRVs in 1% pasteurized sewage-amended samples from filtration alone and filtration after chitosan-flocculation pretreatment with 10 mg/L chitosan acetate.
When controlling for all other parameters, average MS2 coliphage LRVs of 1%
pasteurized sewage-amended samples were found to be 0.27 Log10 reductions higher than
non-pasteurized-sewage amended samples, which was significant at a 99% confidence level (p = 0.0040). Additionally, MS2 coliphage LRVs due to filtration alone (but after pre-treatment),
were on average, 0.3 Log10 reductions lower than reductions due to chitosan pre-treatment alone
(p-value < 0.022), and 1.3 Log10 reductions higher than reductions due to filtration alone
(p-value < 0.00001). Reductions due to the combined efforts of chitosan pre-treatment and filtration
were, on average, 3.3 Log10 reductions higher than filtration alone (p-value < 0.00001) (Table
4.6).
0 1 2 3 4 5
Filtration Chitosan
Pre-treatment
Filtration after Pre-treatment
Chitosan Pre-treatment and
Filtration
L
og
10
Re
d
u
ction
s
MS2 LOG
10REDUCTIONS IN RAW
WATER + RAW SEWAGE
Standard
Intermediate
46
Table 4.3 Raw Turbidity values for each sampling point by stirring condition and test water.
Raw Turbidity Values (NTU) Test
Water
Stirring Conditions
Raw Lake
Water Influent
Filtration Alone
Pre-treated Effluent
No Sewage
Standard 3.6 3.6 2.5 0.90
0.31 0.25 0.30
Intermediate 8.6 11.3 2.5 3.7
0.53 0.47 0.48
Original 7.1 7.4 6.2 6.4
0.81 0.90 0.79
Sewage
Standard 5.0 7.2 2.3 1.4
0.80 0.35 0.40
Intermediate 5.9 7.6 3.3 3.2
0.71 0.30 0.55
Original 7.1 8.7 7.6 6.4