EXAMINING PEDESTRIAN CRASH TRENDS AND DATA SOURCES IN NC AND ASSESSING THE EFFECTIVENESS OF A COMMUNITY-BASED INTERVENTION TO
PREVENT PEDESTRIAN INJURY
Laura S. Sandt
A dissertation submitted to the faculty at the University of North Carolina at Chapel Hill in partial fulfillment of the requirements for the degree of Doctor of Philosophy in the Department
of Epidemiology in the Gillings School of Global Public Health.
Chapel Hill 2016
Approved by:
ABSTRACT
Laura S Sandt: Examining Pedestrian Crash Trends and Data Sources in NC and Assessing the Effectiveness of a Community-Based Intervention to Prevent Pedestrian Injury
(Under the direction of Stephen W. Marshall)
Evidence-based pedestrian safety programs are needed to combat rising pedestrian fatality incidence in the US. Research is lacking on the nature of pedestrian injury data sources and intervention development, delivery, and effectiveness. The dissertation aims were to: 1) evaluate how available data sources capture pedestrian injury and how determinants of pedestrian injuries differ across sources, 2) describe the Watch for Me NC intervention—a multifaceted pedestrian safety program involving public engagement, law enforcement, and engineering—and assess program delivery to identify implementation successes and challenges, and 3) estimate enforcement/engineering component effects on driver yielding. We used
statewide North Carolina data sources (police reports, hospital emergency department visits, and death certificates) to analyze temporal and demographic pedestrian injury distributions.
Comparison of injury data sources showed similar pedestrian injury distributions in relation to sex and temporal factors. Emergency data captured 20 percent of actual pedestrian fatalities and police data underrepresented pedestrian injury incidence, particularly among very young and old pedestrians. We used administrative records from ten cities to describe Watch for Me NC
pre-post design with a control group, comparing locations receiving enforcement and
To my parents, Peggy and Mark, who taught me to say, “I think I can, I think I can, I think I can.” If you actually read this dissertation, this may be the last page that makes any sense. And
ACKNOWLEDGEMENTS
Portions of this dissertation (Aim 2) were funded by the National Highway Traffic Safety
Administration (NHTSA) (contracting officer: Leah Walton) and the North Carolina Department of Transportation (NCDOT) (contracting officer: Lauren Blackburn) and were supported by several partner agencies in the Triangle. Dr. Marshall was partly supported by a grant from the Centers for Disease Control and Prevention (CDC) in support of the UNC Injury Prevention Research Center (IPRC). Many current and former Highway Safety Research Center (HSRC) staff contributed to the Watch for Me NC (WFM) intervention development, implementation, and evaluation, including: Nancy Pullen-Seufert, James Gallagher, Seth LaJeunesse, Max
Bushell, Libby Thomas, Dan Gelinne, Charlie Zegeer, Bill Hunter, Rob Foss, Laura Wagner, and Carol Martell. Credit goes to Nelson Holden, Artur Khalikov, Matt Evans, Marissa Miano, Madison Savage, and Bryan Poole for their role in driver yielding data collection and entry. Peter Flucke of WE BIKE, etc., LLC was sub-contracted to lead WFM officer training. Thanks to HSRC colleagues Libby Thomas, Dan Levitt, and Eric Rodgman for their role in the acquisition of the police crash data and supporting documentation, as well as insights during the analysis, particularly in Aim 1. Thanks also to Dennis Falls, of the Carolina Center for Health Informatics, and Katie Harmon, a Graduate Research Assistant at the UNC IPRC, for their role in the
TABLE OF CONTENTS
LIST OF TABLES ... xiii
LIST OF FIGURES ... xv
LIST OF ABBREVIATIONS ... xvi
CHAPTER 1: INTRODUCTION AND BACKGROUND ... 1
1.1 Overview ... 1
1.2 Background ... 2
1.2.1 Magnitude of Pedestrian Crashes and Injuries ... 2
1.2.2 Characteristics and Correlates of Pedestrian Crashes ... 4
1.2.3 Human Behavior and Pedestrian Safety Interventions ... 7
1.2.4 Synthesis of the Literature on Pedestrian Safety Intervention Evaluations ... 15
1.3 Specific Aims ... 24
Aim 1: Characterize the incidence of pedestrian crashes and fatalities in NC and compare the demographic and temporal distribution of crashes reported across different data sources: police reports, ED visit data, and death certificates. ... 25
Aim 2: Quantify the effects (with a focus on the enforcement and engineering components) of a community-based pedestrian safety intervention, Watch for Me NC. ... 26
CHAPTER 2: METHODS ... 29
2.1 Overview of Design ... 29
2.2 Analytic Approaches ... 30
2.2.3 Analytic Approach for Aim 2.3 ... 32
2.3 Data Sources and Collection ... 34
2.3.1 Police-Reported Crash Data ... 35
2.3.2 Emergency Department Data ... 37
2.3.3 Death Certificate Data ... 38
2.3.4 Intervention Program Implementation Data ... 39
2.3.5 Self-Report Data ... 41
2.3.6 Observational Data (Naturalistic and “Staged” Crossings) ... 43
CHAPTER 3: PEDESTRIAN INJURIES IN NORTH CAROLINA, 2007-2012: A COMPARATIVE ANALYSIS USING POLICE, EMERGENCY DEPARTMENT, AND DEATH CERTIFICATE DATA SOURCES ... 47
3.1 Background ... 47
3.1.1 Study Purpose ... 50
3.2 Methods... 51
3.2.1 Data Sources, Case, and Injury Definitions ... 51
3.2.2 Statistical Analysis ... 55
3.3 Results ... 58
3.3.1 Injury Severity ... 59
3.3.2 Demographics ... 59
3.3.3 Temporal and Seasonal Trends ... 63
3.4 Discussion ... 66
3.4.1 Summary and Interpretation of Results ... 66
3.4.2 Comparing ED, Police, and Death Certificate Datasets ... 66
CHAPTER 4: DEVELOPMENTAL FRAMEWORK AND PROCESS EVALUATION OF A COMMUNITY-BASED PEDESTRIAN SAFETY
PROGRAM ... 73
4.1 Background and Objectives ... 73
4.2 Prior Research ... 75
4.3 Program Development ... 79
4.3.1 Timeline and Community Partners ... 79
4.3.2 Application of Health Behavior Models ... 80
4.4 Program Implementation and Process Evaluation Methods ... 83
4.5 Process Evaluation Results ... 84
4.5.1 Individual and Social-Network Education and Outreach ... 84
4.5.2 Organizational Training and Outreach ... 87
4.5.3 Enforcement-based Outreach ... 90
4.5.4 Media and Social Engagement ... 91
4.6 Discussion ... 93
4.6.1 Funding and In-Kind Support ... 93
4.6.2 Inter/Intra Agency Partnerships and Program Champions ... 94
4.6.3 Officer Training and Support ... 95
4.6.4 Scalability and Regional Focus ... 96
4.6.5 Study Strengths and Limitations ... 96
CHAPTER 5: EFFECT OF A COMMUNITY-BASED PEDESTRIAN INJURY PREVENTION PROGRAM ON DRIVER YIELDING BEHAVIOR AT MARKED CROSSWALKS ... 99
5.1 Introduction ... 99
5.1.1 Prior Research ... 100
5.2 Methods... 104
5.2.1 Site Selection ... 104
5.2.2 Data Collection – Staged and Naturalistic Crossings ... 105
5.2.3 Statistical Analysis ... 107
5.3. Results ... 110
5.3.1 Standard and Enhanced Locations ... 110
5.3.2 Intervention Effects ... 113
5.3.3 Effect of Covariates ... 114
5.4. Discussion ... 119
5.4.1 Covariates and Modifiers ... 119
5.4.2 Study Strengths and Limitations ... 121
5.4.3 Conclusion ... 123
CHAPTER 6: DISCUSSION ... 124
6.1 Key Findings ... 124
6.2 Study Strengths ... 127
6.3 Study Limitations ... 128
6.4 Future Research Needs ... 129
6.4.1 Examination of Pedestrian Injury Outcomes in Relation to Roadway Facilities and Features of the Built Environment... 130
6.4.2 Research on Pedestrian Crash and Injury Outcomes In Relation To Socioeconomic Variables ... 138
6.4.3 Analysis of the Association between Watch for Me NC Program Participation and Crash and Injury Outcomes ... 144
6.5 Public Health Implications ... 147
APPENDIX B: EMERGENCY DEPARTMENT DATA VARIABLES ... 153
APPENDIX C: LAW ENFORCEMENT CITATION DATA FORMS ... 154
APPENDIX D: LAW ENFORCEMENT QUESTIONNAIRE ... 155
APPENDIX E: PROTOCOL FOR FIELD DATA COLLECTION ... 159
APPENDIX F: FIELD DATA COLLECTION FORM... 164
LIST OF TABLES
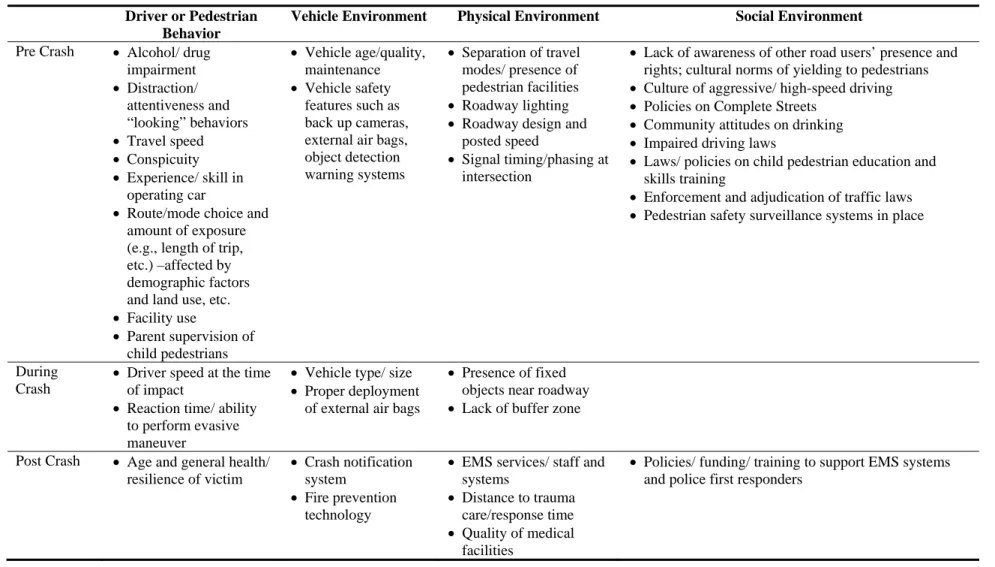
Table 1.1. Haddon matrix of factors affecting injury outcomes in
a pedestrian-motor vehicle crash. ...5
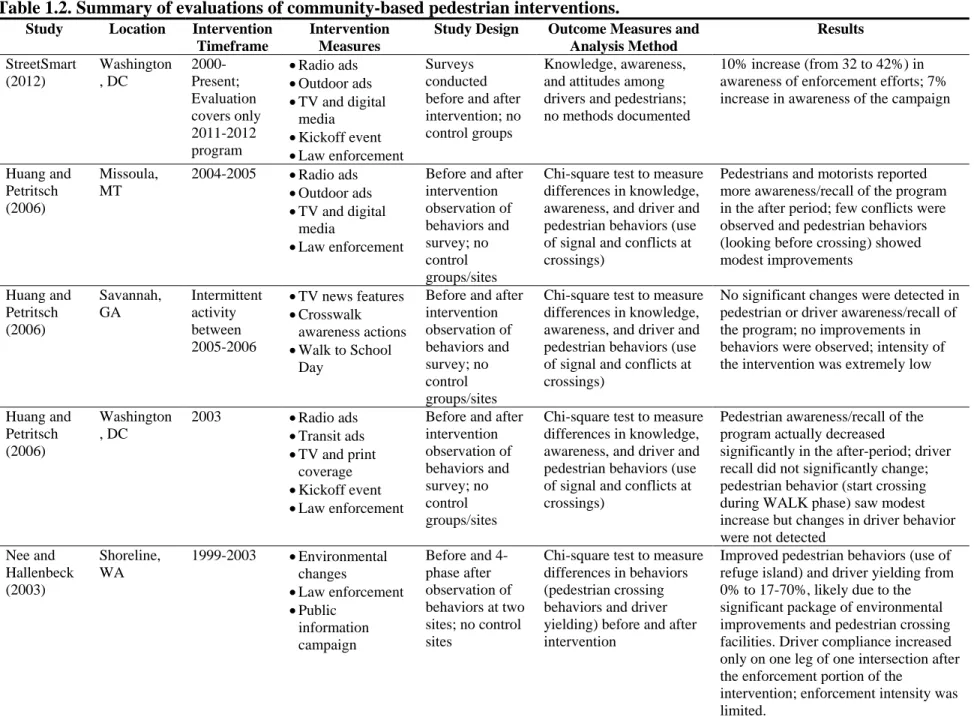
Table 1.2. Summary of evaluations of community-based pedestrian interventions. ...22
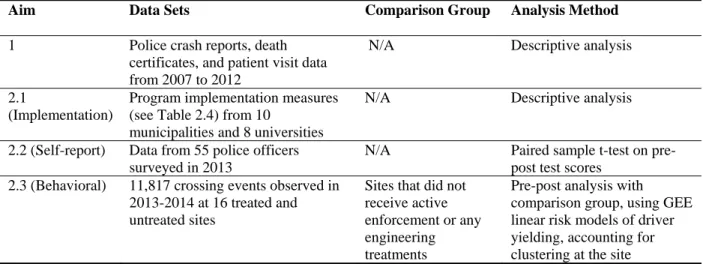
Table 2.1. Summary of analytical approaches ...30
Table 2.2. Summary of dissertation data sources. ...35
Table 2.3. Key analysis variables used from police, hospital, and death certificate data. ...39
Table 2.4. Key analysis program implementation measures/variables for the Watch for Me NC program ...40
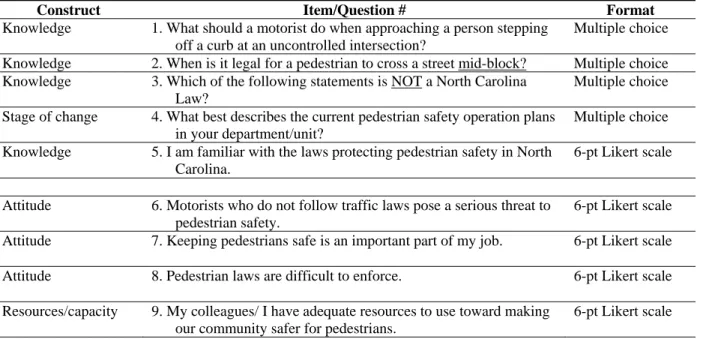
Table 2.5. Summary of questionnaire constructs and items to measure self-reported changes. ...42
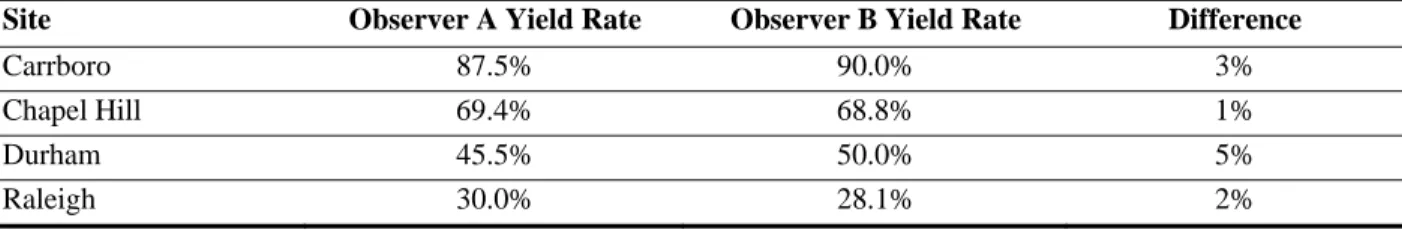
Table 2.6. Driver yielding data coding inter-observer agreement. ...46
Table 3.1. Distribution of pedestrian injury from death certificates, police-reported crashes, and ED-reported patient visits in NC, 2007-2012. ...58
Table 3.2. Driver and pedestrian demographics of police, ED, and death certificate reported pedestrian injury events occurring from 2007-2012 in NC. ...61
Table 3.3. Seasonal and temporal attributes of police, ED, and death certificate reported pedestrian injury events occurring from 2007-2012 in NC. ...64
Table 3.4. Sources of discrepancies between ED and police-reported pedestrian injury incidence ...66
Table 4.1. Summary of key program characteristics and delivery metrics ...78
Table 4.2. 2013-2014 WFM media and materials ...85
Table 4.3. Officer attitudes scores before and after training ...89
Table 5.2. Characteristics of standard (comparison) crossing locations where driver yielding data was collected from 2013-2014 in five NC
municipalities. ...111 Table 5.3. Characteristics of enhanced (treated) crossing locations where driver
yielding data was collected from 2013-2014 in five NC municipalities. ...112 Table 5.4. Difference in the percentage of drivers yielding to pedestrians
before and after the Watch for Me NC program implemented in five NC
municipalities in 2013-2014. ...114
Table 5.5. Association between key covariates and rates of driver yielding to
pedestrians collected at locations in five NC municipalities in 2013-2014. ...115
Table 5.6a. Differences in driver yielding rates by potential effect modifiers, observing staged crossings in 2013-2014 at 16 locations (standard and enhanced)
in NC. ...117 Table 5.6b. Differences in driver yielding rates by potential effect modifiers,
observing naturalistic crossings in 2013-2014 at 13 locations (standard and
enhanced) in NC. ...118 Table 6.1. Police-reported attributes of the roadway where pedestrian crashes
occur in NC, 2007-2012, by injury severity. ...131 Table 6.2. Key analysis variables from linked police and ED data. ...135 Table 6.3. Nature of all pedestrian injuries from ED diagnosis code data,
LIST OF FIGURES
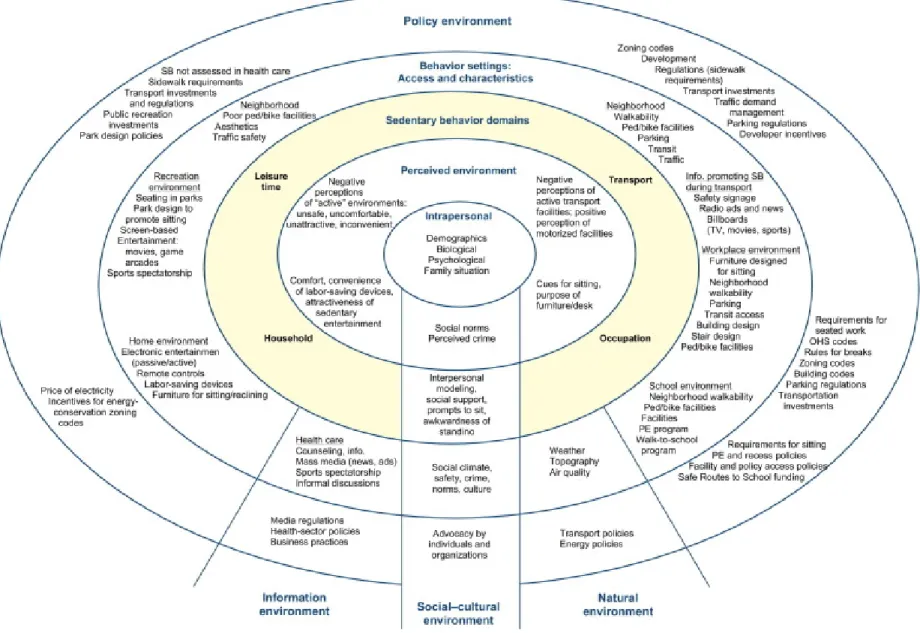
Figure 1.1. Behavioral model of pedestrian-MVC crashes ...8 Figure 1.2. An example socio-ecologic framework: the ecological model of
four domains of active living (Sallis et al. 2006) ...11 Figure 1.3. Health impact pyramid (Frieden 2010) ...12 Figure 3.1. Approach used to screen police-reported, ED, and death certificate
pedestrian fatality or injury cases for eligibility in the study. ...52 Figure 3.2. Police-reported rates of pedestrian crashes by pedestrian and
driver age compared to ED and death certificate reported pedestrian age
for NC crashes occurring from 2007-2012. ...62 Figure 3.3. Police-reported rates of pedestrian crashes by month compared to ED and death certificate reported month for NC crashes occurring from 2007-2012. ...65 Figure 4.1. Timeline of program development and delivery milestones ...80 Figure 5.1. Conceptual model of factors affecting driver yielding to
LIST OF ABBREVIATIONS
AMA Against Medical Advice
ARIMA Autoregressive Integrated Moving Average AVE Advertising Value Equivalency
CCHI Carolina Center for Health Informatics CDC Centers for Disease Control and Prevention CODES Crash Outcome Data Evaluation Systems CMF Crash Modification Factors
DMV Division of Motor Vehicles
ED Emergency Department
FARS Fatality Analysis Reporting System FHWA Federal Highway Administration GEE Generalized Estimating Equations GHSP Governor’s Highway Safety Program HSRC Highway Safety Research Center ICD International Classification of Diseases ICU Intensive Care Unit
IPRC Injury Prevention Research Center MPH Miles Per Hour
MPO Metropolitan Planning Organization MVC Motor Vehicle Crash
MVT Motor Vehicle Transportation
NC DETECT North Carolina Disease Event Tracking and Epidemiologic Collection Tool NCDOT North Carolina Department of Transportation
NCHESS North Carolina Hospital Emergency Surveillance System NHTSA National Highway Traffic Safety Administration
NSC National Safety Council
NVSS National Vital Statistics System
PBCAT Pedestrian Bicycle Crash Analysis Tool RRFB Rectangular Rapid Flashing Beacons SES Socioeconomic Status
SRTS Safe Routes to School
TAC Transportation Advisory Council
TEAAS Traffic Engineering Accident Analysis System TTT Transtheoretical Model, or Stages of Change Theory
US United States
USDOT United States Department of Transportation VMT Vehicle Miles Traveled
CHAPTER 1: INTRODUCTION AND BACKGROUND
1.1 Overview
Risk of pedestrian non-fatal injury or fatality from a motor-vehicle collision (MVC) is a significant and often overlooked problem. Little research has been done to date to examine the epidemiology of pedestrian MVCs (or pedestrian crashes) using contrasting data sources, such as police, crash, and death certificate data. North Carolina is unique among states in that it hosts a statewide Emergency Department (ED) database containing information on pedestrian injury, as well as a statewide database of detailed pedestrian crash data from police reports. These data resources provide a wealth of information regarding the epidemiology of pedestrian crashes, which is useful (but currently under-utilized) for planning public health interventions to address pedestrian crashes.
Additionally, there is limited research available that quantifies the effectiveness of pedestrian injury prevention interventions. A pedestrian safety program in North Carolina, Watch for Me NC (WFM), aims to reduce pedestrian crashes and injuries through a community-based program involving public engagement, law enforcement, and engineering measures. This program provides an opportunity to examine the effectiveness of a multifaceted, theory-driven intervention addressing pedestrian safety. Such research can aid in predicting the likely
The aims of this dissertation were to: 1) evaluate how available data sources capture pedestrian injury and how determinants of pedestrian injuries differs across sources, 2) describe the Watch for Me NC intervention—a multifaceted pedestrian safety program involving public engagement, law enforcement, and engineering—and assess program delivery to identify implementation successes and challenges, and 3) estimate the enforcement and engineering component effects on driver yielding.
The following sections provide a context for this research and summary of prior efforts in these areas, as well as methodologic details on the approach used to accomplish these aims.
1.2 Background
1.2.1 Magnitude of Pedestrian Crashes and Injuries
Fatal and non-fatal injuries from pedestrian crashes are a serious public health concern. According to the latest data available from the National Highway Traffic Safety Administration (NHTSA), in 2013 there were 4,735 pedestrians killed in MVCs in the United States (US) (NHTSA 2015). An additional 66,000 pedestrians were estimated to have been injured in MVCs in the US in 2013. In North Carolina (NC), it is estimated that there are 2,200
pedestrian-involved MVCs each year, leading to between 150 and 200 pedestrian deaths and an additional 500 serious injuries (UNC 2011). As the incidence of non-pedestrian-involved MVCs continues to decline over time, pedestrian fatalities increasingly account for a larger percentage of all traffic fatalities. In 2013, about 14 percent of all traffic fatalities in the US involved
particularly high-risk region of the US and the state. In a 2011 report, the Raleigh-Cary region had the 13th highest pedestrian danger index (a measure of total pedestrian fatalities, fatalities per capita, and walking rates) out of the 52 metropolitan areas in the US with over 1 million people (Ernst 2011).
Injury, and in particular traffic-related injury, is a leading cause of disability, contributing to loss of productive years and accounting for a considerable cost to the US health system, tax payers, and employers (Finkelstein et al. 2006). The National Safety Council (NSC) provides estimates on the economic and comprehensive costs of MVCs, which include costs such as wage and productivity losses, medical expenses, administrative expenses, motor vehicle damage, and employers’ uninsured costs (NSC 2015). Applying NSC inflation-adjusted cost estimates to fatal and injury pedestrian crashes that occurred in NC from 2007 to 2012 results in a calculated economic cost of more than $1.5 billion dollars (not including quality of life costs) over just the six-year span.
Relative to other road users, pedestrians involved in a crash are more likely to experience severe injury, and pedestrian crashes are considered to be the most lethal blunt-trauma
mechanism of injury (Maybury et al. 2010). In a review of more than 500,000 blunt trauma patients in the National Trauma Data Bank from 2001 to 2005 (from all causes, not just
transportation-related), Haider et al. (2009) found that the mean injury severity score, mortality rate, and extremity injury were highest among pedestrians struck by motor vehicles.
In light of the magnitude of pedestrian injuries, the Centers for Disease Control and Prevention (CDC) has recognized transportation-related injuries, and specifically pedestrian safety, as a primary research interest. A key injury research priority is to evaluate the
2009). Similarly, the US Department of Transportation (USDOT) has launched a Safer People, Safer Streets Initiative to do more to address non-motorized traffic injuries and fatalities (FHWA 2014a).
1.2.2 Characteristics and Correlates of Pedestrian Crashes
Regrettably, national trends on pedestrian exposure—such as average annual of number of walking trips made, time spent walking near or crossing streets, or distance walked—are unavailable due to a lack of systematically collected data. This fundamental measure of “denominator” data would be invaluable for the calculation of pedestrian crash or injury rates over time. Additionally, national statistics on non-fatal pedestrian injuries are based on estimates using police reports rather than medical sources, so the information on the actual injuries
Table 1.1. Haddon matrix of factors affecting injury outcomes in a pedestrian-motor vehicle crash.
Driver or Pedestrian Behavior
Vehicle Environment Physical Environment Social Environment
Pre Crash Alcohol/ drug impairment
Distraction/ attentiveness and “looking” behaviors
Travel speed
Conspicuity
Experience/ skill in operating car
Route/mode choice and amount of exposure (e.g., length of trip, etc.) –affected by demographic factors and land use, etc.
Facility use
Parent supervision of child pedestrians
Vehicle age/quality, maintenance
Vehicle safety features such as back up cameras, external air bags, object detection warning systems
Separation of travel modes/ presence of pedestrian facilities
Roadway lighting
Roadway design and posted speed
Signal timing/phasing at intersection
Lack of awareness of other road users’ presence and rights; cultural norms of yielding to pedestrians
Culture of aggressive/ high-speed driving
Policies on Complete Streets
Community attitudes on drinking
Impaired driving laws
Laws/ policies on child pedestrian education and skills training
Enforcement and adjudication of traffic laws
Pedestrian safety surveillance systems in place
During Crash
Driver speed at the time of impact
Reaction time/ ability to perform evasive maneuver
Vehicle type/ size
Proper deployment of external air bags
Presence of fixed objects near roadway
Lack of buffer zone
Post Crash Age and general health/ resilience of victim
Crash notification system
Fire prevention technology
EMS services/ staff and systems
Distance to trauma care/response time
Quality of medical facilities
Policies/ funding/ training to support EMS systems and police first responders
The demographics of pedestrian injuries highlight the vulnerabilities of the young and old to motor vehicle impact. Children age 14 and younger accounted for 4 percent of the pedestrians killed and 15 percent of the pedestrians injured in MVCs in 2013 (NHTSA 2015). In the same year, 19 percent of those killed were adults 65 and older, though this age group made up roughly 14 percent of the US population. Both of these age groups have decreased as a proportion of the total pedestrian fatalities and injuries in recent years. Although pedestrian fatalities involving older adults have declined over the past 10 years, older pedestrians are still more likely to die from their injuries when struck, compared to other age groups. Pedestrians 65 and older have the highest fatality rate per population of any age group (2.0 per 100,000 population; NHTSA 2015). Males are also commonly over-represented in pedestrian injuries and fatalities, accounting for 69 percent of those killed in 2013 (NHTSA 2015). However, we lack data on facility usage by age and sex, so these results must be interpreted with caution.
Studies have also examined the location and timing of pedestrian crashes. One study examined more than 5,000 pedestrian crashes that occurred in California, Florida, Maryland, Minnesota, North Carolina, and Utah (Hunter et al. 1996). It was determined that 32 percent of pedestrian crashes occur at or within 50 feet of an intersection. Of these, 30 percent involved a turning vehicle; another 22 percent involved a pedestrian stepping or running into the
common factors in these crashes as well. While many states systematically fail to collect or discard off-road crash records, crashes occurring in these locations may constitute a significant portion of pedestrian-related crashes. In several studies, parking-lot and driveway-related crashes represented up to 15 to 25 percent of all reported pedestrian crashes (Stutts and Hunter 1999).
1.2.3 Human Behavior and Pedestrian Safety Interventions
In the past two decades, the extent of the burden of pedestrian crashes, coupled with a growing awareness of the health benefits of walking, has given rise to a number of interventions to improve pedestrian safety. Many of the pedestrian safety interventions were developed by communications contractors or local or state transportation agencies seeking to reduce roadway fatalities. Given the origins of these programs and the nature of the funding sources, most interventions had limited involvement from public health staff and were bereft of theoretical underpinnings from the field of behavioral science. Further, due to limited resources and staff capacity, such interventions were rarely formally evaluated using methodologically-rigorous study designs. Part of this dissertation sought to evaluate the enforcement and engineering components of a multifaceted pedestrian safety intervention, Watch for Me NC. This
intervention is unique in that its development was informed by several health behavior change models, described more in Chapter 4. Following is a brief summary of the theoretical
underpinnings of various pedestrian interventions.
Figure 1.1. Behavioral model of pedestrian-MVC crashes. The critical behaviors in the sequence leading to (or avoiding) a crash are:
Search: Both driver and pedestrian/bicyclist scan their environment for potential hazards.
Detection: Each sees the other.
Evaluation: Each recognizes the threat of a collision and the need for action to avoid it. Decision: Each determines what action to take to avoid a collision.
Action: Either pedestrian/bicyclist or driver or both successfully perform(s) the
appropriate action.
Vehicle response: A factor for a motor vehicle or bicycle driver is the response of the
vehicle to the action taken.
environment or other road users may interfere with the ability of pedestrians or drivers to successfully perform each sequence.
This model suggests several means by which pedestrian safety interventions could seek to reduce or prevent crashes:
By eliminating or reducing human errors, such as by increasing road users’ ability to
perform these behaviors (in particularly searching and detecting each other) and
improving their understanding of legally and socially appropriate actions to take, such as yielding to the other or passing safely, etc.
By creating a “safety net” whereby one person in the sequence can compensate for the
errors of another, such as requiring drivers to stop before passing a car that is yielding to pedestrians, in the event that a pedestrian cannot see/detect the passing car in time to avert a crash
By changing the built environment so that a potential crash is less likely or is easier to see
and avoid.
In addition to the Snyder and Knoblauch model, several more general models or theories exist regarding human behavior change that are highly relevant in the context of the pedestrian and driver behaviors. These include the socio-ecological framework, the Health Impact Pyramid, Stages of Change Theory, Social Cognitive Theory, Health Belief Model, and Deterrence Theory as discussed below.
Figure 1.2. An example socio-ecologic framework: the ecological model of four domains of active living (Sallis et al. 2006).
The CDC Health Impact Pyramid, shown in Figure 1.3, uses a similar ecological model (Frieden 2010). The Health Impact Pyramid shows that interventions have an increasing impact on populations as they reach broader system structures. Whereas educational interventions must be consistently and repeatedly applied to have a tangible impact, changing the context (e.g., through community design, policies, and enforcement) requires less individual effort and has a greater population impact than individual education. The CDC considers such contextual changes to be the most effective public health actions. Implementing these changes can be difficult and time-consuming, but once in place their intended benefits are achieved more broadly and with less effort than programs oriented towards the individual.
Individual Education:
Counseling and public
education to avoid high‐
risk behaviors
Encouraging compliance
with traffic laws
Changing the Context for Public Health:
Safer roads and vehicle
design
Designing communities
to promote increased
physical activity
Enacting policies that
encourage public
transit, bicycling, and
walking instead of
driving
Enforcing laws
mandating helmet use
pedestrian safety interventions, decisions in the policy and physical environment should strive to maximize safety considerations. In other words, they should make the safe option the default option. This strategy will create a social and physical environment that will reinforce and support messages targeted at individuals.
The Stages of Change Theory (also known as the “Transtheoretical model” or “TTT”) describes each stage of the continuum of motivation and readiness for individual behavior change:
Pre-contemplation (no intention of change) Contemplation (thinking about taking action)
Preparation (planning to take action),
Action (change lasting less than six months)
Maintenance (change lasting for more than six months), and
Termination (change with no threat of relapse)
The goal of interventions based on the TTT model is to move people to the next stage of change, excluding the termination stage (Prochask et al. 1993). This theory is often applied to other health-related interventions, such as smoking cessation and physical activity programs, but has not been meaningfully applied to pedestrian safety interventions seeking to motivate changes at the individual or organizational level, such as encouraging police agency staff to consider, prepare for, and take action to improve pedestrian safety through targeted enforcement operations.
reinforcement to continue the behavior (Bandura 1986). Under this theory, if some drivers begin to yield to pedestrians at crosswalks, for example, then other drivers could sense that this both appropriate and expected and begin to perform the behavior as well, provided they receive other reinforcements to continue.
The Health Belief Model explains personal behavior change as influenced by the
perceived susceptibility and severity of a health risk, the perceived benefits and barriers to taking action, and internal or external “cues to action” that prompt one to take action (Champion and Skinner 2008). Many existing pedestrian or traffic safety campaigns—whether intentionally or not—build on this model by aiming to educate the public about the magnitude of the problem and the risk and cost of pedestrian crashes. An unintended consequence of interventions that focus heavily on the magnitude of the problem (e.g., everyone is jaywalking and jaywalking is dangerous) may be to underscore the problem as the social norm, giving credence to its
continuation under the Social Cognitive Theory described above.
Deterrence Theory is based on the notion that people are more likely to avoid illegal behaviors when they believe that punishment for the behavior is certain, and will be both swift and severe (Ross 1982). Many traditional traffic safety programs are predicated on this theory. A pedestrian safety effort in Gainesville, Florida, used deterrence theory to influence drivers to yield to pedestrians in crosswalks (Van Houten et al. 2013a). Police officer presence around crosswalks was enhanced and bus wraps and high-visibility media messages reiterate the consequence of ticketing if drivers failed to yield. However, it is unknown whether the
incorporated into tangible elements of the Watch for Me NC pedestrian intervention are provided in Chapter 4.
1.2.4 Synthesis of the Literature on Pedestrian Safety Intervention Evaluations
As stated earlier, while numerous pedestrian safety interventions are known to have been implemented in the US, there are few quality and/or published reports evaluating their
effectiveness using rigorous study designs. Further, the nature of pedestrian interventions is quite diverse, which makes comparability a challenge and can limit generalizability among those interventions that have been adequately evaluated. For the purpose of this dissertation, existing or prior pedestrian interventions have been categorized into the following types: 1) school-based, 2) infrastructure-based, and 3) community-based. The primary recipients of
school-based/curriculum interventions are children. In contrast, infrastructure-based and community-based interventions strive to influence broad populations, although there is often a focus on adult road users. This review briefly mentions the first two categories, but is primarily focused on the latter category (community-based), since this is the approach adopted by the Watch for Me NC intervention, evaluated as part of this dissertation.
School-based interventions typically target school-children and/or care-givers with educational strategies delivered in a school or afterschool care setting. Child-only or school education only pedestrian safety evaluations are abundant (Mulvaney et al. 2006, Rivara et al. 1991, Kendrick et al. 2007, Preusser and Blomberg 1984, Gresham et al. 2001, Hotz et al. 2004, and Dupperex 2002). Most of these studies used a pre/post design to evaluate changes in
schools to the intervention (Dupperrex 2002), and many used control groups or analytic techniques to adjust for potential sources of bias. However, none of these studies examined changes in driver behaviors in relation to child pedestrians or any injury outcomes, and none of the interventions that were evaluated included components such as enforcement of laws.
Infrastructure-based interventions are those that make changes to the built environment to improve conditions for safer pedestrian and motorist movement and interaction. The evaluation of individual infrastructure treatments has been extensively reviewed elsewhere (Fitzpatrick et al. 2006, Harkey et al. 2004, Retting et al. 2003) and crash-based studies are well-documented in the Crash Modification Factors (CMF) clearinghouse (http://www.cmfclearinghouse.org/). Many infrastructure evaluations utilize rigorous research designs, using treatment and control locations to examine changes in crashes before and after the installation of an engineering treatment. Empirical Bayes or fully Bayesian techniques are often used to help account for regression-to-the-mean effects resulting from the tendency to select treatment sites that have high crash frequencies (Persaud et al. 2010). Typically, these studies focus on a single engineering treatment, rather than a comprehensive package of intervention elements, such as engineering, education, and enforcement measures in combination. Crash-based evaluations of pedestrian-related infrastructure may require hundreds or even thousands of locations and many years of before and after data in order to have the sample size sufficient to detect meaningful changes in crashes, since pedestrian crashes at any particular location are relatively rare events in relation to vehicle-only crashes. As a result, most studies are unable to examine changes to specific levels of pedestrian injury and/or fatality resulting from a treatment.
broad population, including adults and possibly children. Most studies focused on evaluating three different types of outcome measurement: knowledge change, behavior change (i.e., stopping at the curb; using crosswalks and signals, driver speed/yielding, etc.), or crash
frequency/rate change. While crash-based studies are considered the “gold-standard” among the highway safety field, at least for infrastructure evaluations, only two crash-based studies
evaluating a community-based pedestrian program were identified through this literature search. Table 1.2 summarizes the literature regarding community-based pedestrian safety programs that have been evaluated using knowledge, behavioral, and/or crash-based measures. Interventions addressing only specific sub-groups (such as children) are not included.
As an example, the StreetSmart program in Washington, DC is one of the longest-running pedestrian education and enforcement programs in the US, in operation since 2000 (Streetsmart 2012). While its intervention approach using enforcement and public outreach has been widely modeled, the intervention has not been scientifically evaluated. Evaluation measures to date have focused on surveys of driver and pedestrian knowledge and awareness of the
intervention activities and messaging. Although the survey results indicate positive changes in these measures, the survey methods have not been published in the peer-reviewed literature, and thus the study and its findings cannot be thoroughly assessed.
pedestrians and drivers at selected intersection crosswalks. For each community, cross-sectional intercept surveys (targeting between 70 and 400 pedestrians and motorists before and after) were conducted at up to six locations. Observations of pedestrian behaviors (e.g., compliance with the signal) and conflicts with drivers were conducted at between 200 and 800 signal cycles at up to eight locations. The study did not describe site selection or characteristics for the observational data collection or survey sampling methods or response rates. Results varied across the three cities, but the nature of the study design limits the applicability of the findings. The study used only two measures in time, had small sample sizes, did not describe any measures to control for potential confounding, and no control locations were used. In addition, poor documentation of the intervention activities, and lack of discussion of the data collection measures and analysis methods prevent any replication of the effort. The authors concluded that additional funding and reliable community champions were needed to ensure the strength of the intervention
implementation.
Van Houten et al. (2013a) performed a more rigorous evaluation of an enforcement-based intervention that was similar in design to their 2004 work. In this instance, they randomized enforcement to 6 of 12 sites and gathered repeated measures of driver and pedestrian behaviors. Time-series regression models were used to examine changes in observed driver and pedestrian behavior at both treated and untreated sites. The study found that driver yielding increased at both treated and untreated sites. The authors suggested that, due to the high-visibility public outreach component of the intervention, the enforcement program effects generalized to crosswalks not targeted for enforcement.
Nee and Hallenbeck (2003) evaluated pedestrian and motorist behavior changes
attributed to an intervention involving engineering, enforcement, and public education. A before and four-phase after design was used at two locations, with no control group. Researchers
observed improved pedestrian behaviors (e.g., use of refuge island) and driver yielding increased from 0 percent at baseline to 17 to 70 percent, depending on the location. The enforcement component of the program was limited and authors attributed much of the change in behaviors to the significant package of engineering improvements made, including improvements to
pedestrian crossing facilities. Similar to Van Houten and Malenfant (2004), data were presented in terms of raw percentages of yielding and it appears that no modeling or work to control for confounders or temporal trends was performed.
widely in their geographic coverage (including Perth, Australia, Manhattan, NY, and Harstad, Norway), their timeframe (1976-1997), and the intervention measures (traffic calming, Safe Routes to School (SRTS), playground improvement, mass media, legislative changes, etc.). However, all studies saw reductions in childhood injuries (ranging from 12 to 54 percent) or improvement in traffic conditions or driver behaviors. The authors concluded that while there is a paucity of well-designed research studies, the available research supports the hypothesis that community-based interventions can effectively reduce the incidence of (child) pedestrian crashes, depending on the complexity of the intervention strategies used.
In a study by Datta et al. (2010), law enforcement officials in Detroit, MI implemented two pedestrian-oriented enforcement campaigns at Wayne State University aiming to educate campus pedestrians on proper use of crosswalks and signal-abidance through the issuance of warnings. Researchers used two sample z-test of proportions to determine the statistical
Zegeer et al. (2008) produced one of the most rigorous, crash-based evaluations of a multifaceted community-based pedestrian safety intervention to date, utilizing a multivariate autoregressive integrated moving average (ARIMA) time-series analysis, along with
nonparametric U tests, to test changes in pedestrian crash rates over time. Three separate comparison groups were used (the adjacent county, a six-county region, and statewide) to help remove the effects of pre-existing trends or temporal confounders. Overall, there was an 8.5 percent to 13.3 percent reduction in pedestrian crash rates during and following the program implementation compared to the untreated groups. A sub-analysis of crash trends in specific “zones” of Miami Beach revealed that the zones with the most intensive intervention activities (Liberty City and South Beach) were the ones with the greatest reduction in crashes, indicating the potential for a dose-response effect.
Table 1.2. Summary of evaluations of community-based pedestrian interventions. Study Location Intervention
Timeframe
Intervention Measures
Study Design Outcome Measures and Analysis Method Results StreetSmart (2012) Washington , DC 2000-Present; Evaluation covers only 2011-2012 program
Radio ads
Outdoor ads
TV and digital media
Kickoff event
Law enforcement
Surveys conducted before and after intervention; no control groups
Knowledge, awareness, and attitudes among drivers and pedestrians; no methods documented
10% increase (from 32 to 42%) in awareness of enforcement efforts; 7% increase in awareness of the campaign
Huang and Petritsch (2006)
Missoula, MT
2004-2005 Radio ads
Outdoor ads
TV and digital media
Law enforcement
Before and after intervention observation of behaviors and survey; no control groups/sites
Chi-square test to measure differences in knowledge, awareness, and driver and pedestrian behaviors (use of signal and conflicts at crossings)
Pedestrians and motorists reported more awareness/recall of the program in the after period; few conflicts were observed and pedestrian behaviors (looking before crossing) showed modest improvements Huang and Petritsch (2006) Savannah, GA Intermittent activity between 2005-2006
TV news features
Crosswalk awareness actions
Walk to School Day
Before and after intervention observation of behaviors and survey; no control groups/sites
Chi-square test to measure differences in knowledge, awareness, and driver and pedestrian behaviors (use of signal and conflicts at crossings)
No significant changes were detected in pedestrian or driver awareness/recall of the program; no improvements in behaviors were observed; intensity of the intervention was extremely low
Huang and Petritsch (2006)
Washington , DC
2003 Radio ads
Transit ads
TV and print coverage
Kickoff event
Law enforcement
Before and after intervention observation of behaviors and survey; no control groups/sites
Chi-square test to measure differences in knowledge, awareness, and driver and pedestrian behaviors (use of signal and conflicts at crossings)
Pedestrian awareness/recall of the program actually decreased
significantly in the after-period; driver recall did not significantly change; pedestrian behavior (start crossing during WALK phase) saw modest increase but changes in driver behavior were not detected
Nee and Hallenbeck (2003)
Shoreline, WA
1999-2003 Environmental changes
Law enforcement
Public information campaign
Before and 4-phase after observation of behaviors at two sites; no control sites
Chi-square test to measure differences in behaviors (pedestrian crossing behaviors and driver yielding) before and after intervention
Improved pedestrian behaviors (use of refuge island) and driver yielding from 0% to 17-70%, likely due to the significant package of environmental improvements and pedestrian crossing facilities. Driver compliance increased only on one leg of one intersection after the enforcement portion of the
intervention; enforcement intensity was
Study Location Intervention Timeframe
Intervention Measures
Study Design Outcome Measures and Analysis Method Results Van Houten and Malenfant (2004) Miami Beach, FL 2-week intervention and 1-year maintenance period (year not known)
Press releases and earned media (TV and print)
Law enforcement
Repeated measure of driver behaviors before, during, and after intervention; 8 treated and 12 non-treated sites
Analysis method not described; raw percentages of driver yielding at each site and measurement wave were provided
Driver yielding went from 3.3% and 18.2% at baseline to 27% and 33.1% at the two treated corridors, respectively. Yielding at the untreated sites rose from 20.5% to 32.1%, which authors
attribute to a spill-over effect of the high-visibility education component.
Van Houten et al. (2013a)
Gainesville, FL
2010-2011 High-visibility law enforcement
Media coverage
Paid media
Signage
Environmental changes
Randomized enforcement to 6 of 12 sites; repeated measures of driver and pedestrian behaviors Time-series regression models of changes in observed driver and pedestrian behavior at 12 sites
Yielding for staged crossings rose from 31.5% to 62%, and yielding for natural crossings rose from 45.4% to 82.7%. Program effects generalized to
crosswalks not targeted for enforcement and were inversely proportional to the distance from the treated sites.
Datta et al. (2010)
Detroit, MI 2008-2009 Environmental changes
Development of action plan
Law enforcement
Education and public outreach
Repeated measure of child pedestrian and adult pedestrian behaviors before, during, and after intervention; pre/post-test of child pedestrian knowledge; no control groups used
Two sample z-test of proportions to determine the statistical significance of any changes in observed child behaviors or pretest/ post-test knowledge; two sample tests of proportions to examine changes in pedestrian behavior before, during, and after enforcement, using Bonferroni Multiple Comparison Correction
Child pedestrian violation rate decreased from 34.79% to 30.35%; increases in the correct response were observed at all schools; pedestrian violations (walking outside the
crosswalk or against the signal) reduced from 17 to 27% immediately after the campaign, with sustained reductions of 8 to 10% several weeks after active enforcement ceased
Zegeer et al. (2008)
Miami-Dade County, FL
1999-2003 16 specific education, enforcement, and engineering countermeasures targeting children, adults, and seniors Before-after evaluation of pedestrian crash rates, using three comparison groups
Multivariate intervention ARIMA time-series analysis, along with nonparametric U tests were used to test changes in pedestrian crash rates over time
County-wide crash rates were reduced from 8.5% to 13.3%, depending on the comparison group used to adjust the model
In general, the literature on community-based pedestrian safety programs includes many promising approaches that, based on the theory reviewed earlier, would likely have positive effects on pedestrian safety. However, few community-based interventions have been
comprehensively documented and rigorously evaluated. Insufficient description of the theoretical foundation for the intervention, and the intensity of its delivery, along with poor control for confounders and other temporal factors, are common weaknesses in the literature. There has been much effort expended on intervention development, particularly school-based interventions aiming to change the knowledge and behaviors of drivers and pedestrians. Less research has been conducted at the broader community level, examining actual changes in driver or pedestrian behaviors benchmarked against pre-intervention behavioral data. Evaluations using changes in crashes and injuries in pedestrians are even more uncommon. In general, the field lacks rigorous evaluation of comprehensive community-based interventions informed by behavioral theory that is required to inform the next generation of intervention development. Traffic safety resources are often targeted towards engineering or technological innovations, often at the cost of research to understand the behaviors of the people who use the roadways.
1.3 Specific Aims
as unintentional collisions between a motor vehicle and one or more pedestrians on a public roadway, resulting in potential or confirmed injury to the pedestrian. The dissertation addressed two major aims; the approach, hypotheses, and rationale of each are described below.
Aim 1: Characterize the incidence of pedestrian crashes and fatalities in NC and compare the
demographic and temporal distribution of crashes reported across different data sources: police
reports, ED visit data, and death certificates.
1.3.1 Aim 1 Approach
For each data set, describe the distribution of pedestrian crashes and fatalities by injury severity, demographic, temporal, and seasonal factors. Analyze data at the crash event level for police-reported data, using the characteristics of the first pedestrian harmed in each crash event. Analyze data at the patient visit level for ED data. Classify crashes by injury severity or patient disposition and compute injury and fatality distributions by demographic, temporal, and seasonal variables. Assess differences in distributions between the various data sets using Chi-square tests of homogeneity, and describe discrepancies in injury frequencies and crash rates.
1.3.2 Aim 1 Hypotheses
H1.1: Pedestrian injury and fatality frequencies would be higher in the ED data relative to the police-reported data.
H1.2: ED and police data would have similar seasonal/temporal distributions but that demographic distributions may differ due to factors influencing event reporting.
1.3.3 Aim 1 Rationale
Pedestrian safety programs are needed to combat the continued rise of pedestrian fatality incidence in the US but information on pedestrian injury trends and risk factors to guide
decision-making is lacking. Some states use linked police and medical data to guide
transportation safety priorities. However, most communities lack access to linked police crash and hospital injury databases. There is a need to understand the differences between available data sources and to understand how each defines and captures pedestrian injury or fatality data. Notably, this study makes use of data sources that are unique in that NC is one of the few states in the nation to have statewide ED data as well as a statewide database of detailed pedestrian crash data based on police reports.
Aim 2: Quantify the effects (with a focus on the enforcement and engineering components) of a
community-based pedestrian safety intervention, Watch for Me NC.
Aim 2.1: Describe the Watch for Me NC intervention and implementation in Year 1 (2012) and Year 2 (2013).
Approach: Describe the intervention strategies, assess program delivery through
measures obtained from intervention implementation records, and identify strengths and challenges in implementing multifaceted interventions to promote pedestrian safety.
Aim 2.2: Assess the effects of the Watch for Me NC intervention on law enforcement officers participating in the capacity-building component of the program, which involved participation in a two-day training course in 2013.
Approach: Quantify changes in law enforcement officer self-reported knowledge,
Aim 2.3: Estimate the effects of the Watch for Me NC law enforcement and (low-cost) engineering improvement program on driver behavior.
Approach: Calculate the average driver yielding rates at treatment and comparison sites before and after the intervention using field observation data.
Aim 2 Hypotheses
H2.1: Various intervention strategies, including public outreach and engagement as well as high-visibility law enforcement, will be implemented and program activities will not be evenly distributed across communities. Communities with staff dedicated to pedestrian transportation and prior commitment to pedestrian initiatives will have greater likelihood of implementing key intervention components, including communication and enforcement, as measured by a range of program implementation records.
H2.2: Officer knowledge, attitudes, and sense of capacity will increase as a result of the training; officers will have an increasingly positive attitude toward conducting pedestrian enforcement and will advance in their stage of change/level of readiness.
H2.3: Driver yielding rates will be higher at the treated sites and will increase over time, in comparison to the baseline and untreated sites. A dose-response effect will be observed at sites that receive more enforcement treatments over time, as more enforcement activity will directly reach a greater population of area drivers.
Aim 2 Rationale
Few studies have evaluated a community-based pedestrian safety intervention using a variety of measures, including intervention implementation records, self-report, and
CHAPTER 2: METHODS
This Chapter describes the design, methods, data resources, and analytical approaches used to accomplish each of the study aims described in Chapter 1. Table 2.1 provides an overview of the analysis methods used for each aim or sub-aim, which are further described in the sections below.
2.1 Overview of Design
For Aim 1 (characterize and compare the nature of pedestrian injury data in three data sources), we performed a descriptive analysis of pedestrian injuries and compared injury
distributions from three primary data sources: police crash reports, emergency department (ED) visits, and death certificate reports. Analyses examined demographic, temporal, and seasonal distribution of crash frequencies and crashes per 100,000 person years by age. Analyses were stratified by injury type, using data available from each data source to categorize injury severity.
In Aim 2.1 and 2.2 (evaluating the intervention delivery), we used multiple methods, including a descriptive analysis of program implementation measures and a paired-sample t-test of law enforcement officer self-reported measures before and after the intervention.
Table 2.1. Summary of analytical approaches.
Aim Data Sets Comparison Group Analysis Method
1 Police crash reports, death certificates, and patient visit data from 2007 to 2012
N/A Descriptive analysis
2.1
(Implementation)
Program implementation measures (see Table 2.4) from 10
municipalities and 8 universities
N/A Descriptive analysis
2.2 (Self-report) Data from 55 police officers surveyed in 2013
N/A Paired sample t-test on pre-post test scores
2.3 (Behavioral) 11,817 crossing events observed in 2013-2014 at 16 treated and untreated sites
Sites that did not receive active enforcement or any engineering treatments
Pre-post analysis with comparison group, using GEE linear risk models of driver yielding, accounting for clustering at the site
2.2 Analytic Approaches
2.2.1 Analytic Approach for Aim 1
information about the injury diagnosis, and the police-reported data contained numerous variables regarding conditions at the time and location of the crash (such as lighting, weather, roadway facilities, traffic conditions, etc.). However, since these variables were not available for comparison across all three data sources, they were not included in the analysis.
For police-reported data, the analysis was conducted at the crash event level, using the characteristics of the first pedestrian harmed in each crash event (assumed to be the most severely injured person) if multiple pedestrians were involved. It therefore undercounts
pedestrians involved in multi-pedestrian crash events. For ED data, analyses were conducted at the patient visit level, using the characteristics of each person involved in any visit to the ED after a crash. Whereas police-reported data tend to undercount injured pedestrians, the ED data tend to overcount injured pedestrians seen in the ED, since multiple visits for treatment of injuries from a single crash event will generate multiple visit records per patient. There is no publicly-available unique patient identifier to facilitate analyses at the level of the patient (rather than the visit).
2.2.2 Analytic Approach for Aim 2.1 and 2.2
The analysis approach for Aim 2.1 was descriptive in nature and summarized the intervention measures implemented as identified in the implementation records described in Table 2.4. Using both the quantitative and qualitative data provided by the partners, we discussed strengths and challenges in implementing behavioral interventions to promote pedestrian safety.
were matched to post-tests for each individual. A t-test procedure compared mean changes in scores, and 95 percent confidence intervals were constructed.
2.2.3 Analytic Approach for Aim 2.3
For this Aim (to assess the behavioral outcomes of the Watch for Me NC program), linear risk models (identity link, binomial residual) were developed to estimate crude and adjusted driver yielding rates, 95 percent confidence intervals, and p-values. Two methods were used to document driver yielding behavior at 16 different locations in five municipalities over a six-month period: observing “naturalistic” pedestrians crossing the road and “staging” crossing attempts using research team members (described more in the Section 2.3). Models were fit for the naturalistic and staged crossings separately. Generalized estimating equations (GEE) with robust (“sandwich”) standard errors were used to account for within-site correlation induced by making repeated observations at the same crossing locations. An independence specification was used for the GEE working correlation matrix. Upon initial inspection of the data, crossings at two standard locations (D-Tobacco and R-South) and one enhanced location (C-Hillsborough) had less than 50 naturalistic crossing events observed; these locations were removed from the naturalistic crossing analysis because there were too few observations to reliably estimate effects at these locations. Therefore the naturalistic analyses were limited to 13 locations, whereas staged analyses used data from all 16 locations. Regression diagnostics were used to identify potential violations of model assumptions, and goodness of fit statistics were examined using the QIC and QICu statistics.
and engineering program components vs. standard locations), time (i.e., pre/post Watch for Me NC intervention), and the time by group interaction.
An “adjusted” model (Model 2) included selected measured covariates from a wide range of covariates thought to impact driver yielding based on a conceptual model (shown in Chapter 5, Figure 5.1). This model adjusted for: time of day (afternoon vs. morning), commute time (peak vs. off-peak), crossing location (uncontrolled intersection vs. midblock crossing),
crosswalk marking type (standard parallel lines vs. high-visibility “continental” style), direction of traffic (one-way vs. two-way), number of traffic lanes (two-lane vs. 3+ lane), posted speed limit (<30 MPH vs. 30+ MPH), and city population (<60K or <=60K). An examination of collinearity was undertaken but none was detected.
model shown in Figure 5.1. Walk Scores® were obtained for the 16 crossing locations and for each municipality as a whole. These two continuous variables were examined in relation to driver yielding rates and to other covariates before being added to the model. The Walk Scores® were found to be strongly correlated with several other variables (including crossing location, direction of traffic, and number of lanes); these variables were removed from Model 3 in favor of the Walk Score® variable to improve model stability and interpretation. The crossing-location specific Walk Score® was centered on the city average Walk Scores®, which was rescaled to support a meaningful interpretation of the intercept term.
2.3 Data Sources and Collection
The data sources used for Aim 1 included police-reported pedestrian-motor vehicle crash (MVC) data, ED data on pedestrian-related visits, and death certificate data.
The data sources used for Aim 2 (to evaluate the delivery and effect of a pedestrian safety intervention focused on changing driver behavior) included law enforcement program
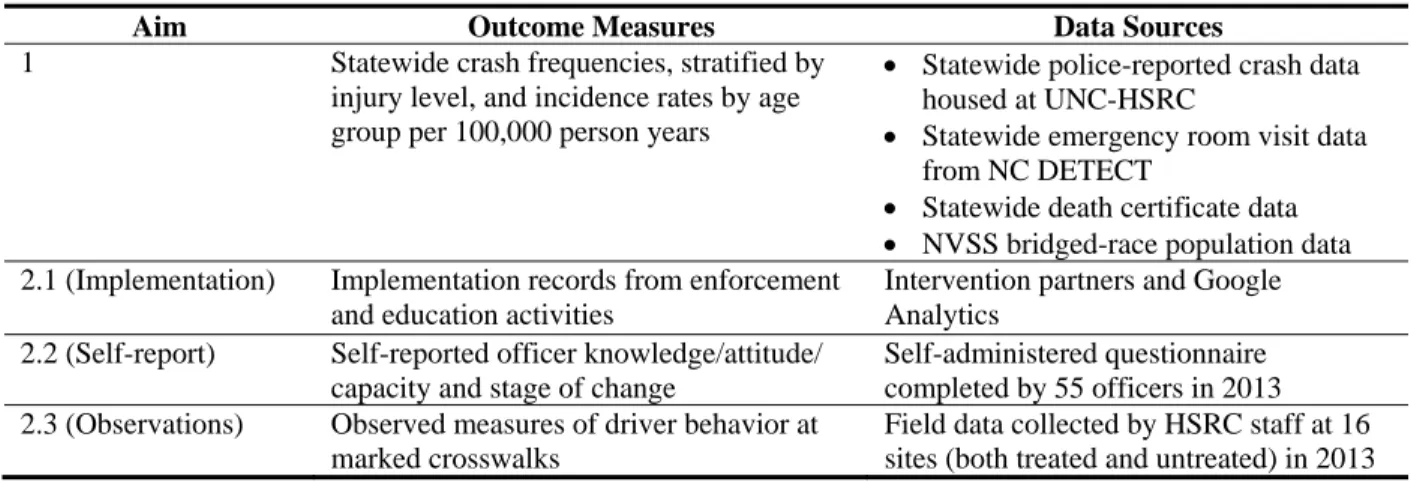
Table 2.2. Summary of dissertation data sources.
Aim Outcome Measures Data Sources
1 Statewide crash frequencies, stratified by injury level, and incidence rates by age group per 100,000 person years
Statewide police-reported crash data housed at UNC-HSRC
Statewide emergency room visit data from NC DETECT
Statewide death certificate data
NVSS bridged-race population data 2.1 (Implementation) Implementation records from enforcement
and education activities
Intervention partners and Google Analytics
2.2 (Self-report) Self-reported officer knowledge/attitude/ capacity and stage of change
Self-administered questionnaire completed by 55 officers in 2013 2.3 (Observations) Observed measures of driver behavior at
marked crosswalks
Field data collected by HSRC staff at 16 sites (both treated and untreated) in 2013
2.3.1 Police-Reported Crash Data
We used police-reported data on pedestrian crashes that occurred between 2007 and 2012 in Aim 1. Police-reported data, housed at the Highway Safety Research Center (HSRC), are also available through the North Carolina Pedestrian and Bicycle Crash Data Tool:
http://www.pedbikeinfo.org/pbcat/index.cfm.
Crash data originated from the NC Division of Motor Vehicles (DMV) Crash Report Form DMV-349, which is completed by law enforcement officers to report MVCs in NC. For a crash to be reportable, it must meet at least one of the following criteria (DMV 2013):
1. The crash resulted in a fatality, or
2. The crash resulted in a non-fatal personal injury, or
3. The crash resulted in total property damage amounting to $1,000.00 or more, or 4. The crash resulted in property damage of any amount to a vehicle seized, or 5. The vehicle has been seized and is subject to forfeiture under G. S. 20-28.2.
or occur after the motor vehicle runs off the roadway but before events are stabilized” (DMV 2013).
Once received from the DMV, crash reports were individually processed by HSRC staff and closely examined, particularly the investigating officer’s sketch and narrative description and information regarding the specific location of the crash. This information was used to first
confirm that the event was correctly coded and does involve a pedestrian hit by a motor vehicle. Then, based on the crash narrative and other form information, a specific crash type was
developed using Pedestrian Bicycle Crash Analysis Tool (PBCAT) and added to the database (Harkey et al. 2006).
Although occasionally more than one pedestrian was involved in the same crash, the database included only one record per crash and includes data on only the first pedestrian struck in the crash, which is typically the pedestrian most harmed by the event. Thus, this dataset under‐
represents the total number of people affected by crashes, though it accurately reports the total number of pedestrian crashes reported to the police. Past studies have estimated that police‐
reported crashes fail to capture a significant portion of pedestrian incidents that occur (Stutts and Hunter 1999). Non-captured incidents may include falls, crashes not involving motor vehicles, or crashes involving motor vehicles that do not meet the DMV criteria above or occur on private property.
which is commonly used to analyze pedestrian fatalities (NHTSA 2011). Because the state DMV data is consistent with the elements contained in FARS but is more readily available (FARS typically has a 2-year lag from the calendar year in which the crash occurs), the FARS fatality dataset was not considered useful for this effort. We analyzed K-type (fatal) crashes separately from non-fatal crashes, and excluded non-injury crashes (O-type) from the analysis. Other relevant variables used in the study are described in Table 2.3. See Appendix A for a complete list of variables available through police-reported crash data.
2.3.2 Emergency Department Data
Aim 1 also used ED data. Statewide ED data from 2007 to 2012 were obtained from NCDetect.org. NC DETECT is North Carolina's statewide syndromic surveillance system, and is considered to be one of the most comprehensive near real-time statewide ED databases in the US (Hakenewerth, et al. 2009). The relevant data fields available through the standard Data Use Agreement and used in this study are listed in Table 2.3. See Appendix B for a complete list of variables available through the NC Detect ED data set.
NC DETECT data were collected by the North Carolina Hospital Emergency
Surveillance System (NCHESS). Staff at the Carolina Center for Health Informatics in the UNC Department of Emergency Medicine (CCHI) review and monitor the quality of the data and develop and manage the NC DETECT database. Inclusion criteria for case reporting include:
Patients treated in the participant ED regardless of their disposition, or
Patients triaged who then leave Against Medical Advice (AMA) or without being seen, or Patients treated in the ED and then admitted to the hospital.
hospitals (99 percent) submitting production-level data daily to NC DETECT (http://ncdetect.org/hospitalstatus.html).
We isolated pedestrian-related cases using International Classification of Diseases, 9th Revision (ICD-9-CM) E-codes (identifying the external cause of injury) pertaining to pedestrian-involved motor vehicle traffic accidents. These included E-codes 810 through 819 with a fourth digit of “7” (pedestrian). While E-coding data is not mandated for NC hospitals, E-codes are available for more than 90 percent of the data. Though the quality of E-coding varies between hospitals, the overall quality and accuracy of E-coding is considered to be very high. Once the data were acquired, additional review of the chief complaint data was conducted to ensure that records included met the intended definition of “pedestrian.”
2.3.3 Death Certificate Data
Table 2.3. Key analysis variables used from police, hospital, and death certificate data.
Domain Police Record Variable ED Variable Death Certificate Variable
Pedestrian Information Age (in completed years)
Sex
Age (in 5-year categories)
Sex
Age (in completed years)
Sex
Driver Information Age n/a n/a
Temporal/Seasonal Characteristics
Date/time of crash ED arrival date and time (in 2-hr blocks)
Date/time of death Injury Characteristics Pedestrian injury
severity (KABCO coded)
Disposition
(discharged, admitted, transferred, died, etc.)
Injury code (ICD-10-CM E-code(s))
2.3.4 Intervention Program Implementation Data
Aim 2.1 required the use of program implementation records regarding the
Table 2.4. Key analysis program implementation measures/variables for the Watch for Me NC program.
Domain Variable(s) Available
Paid Media Number of print materials produced and disseminated by NCDOT and duration of exposure time
Total cost of all printed materials and print and radio ad space purchased and cost/capita reached
Number of times PSAs were aired, radio station sources, and estimated number of impressions
Earned Media Press release dates
Media coverage source and publication date
Media coverage type, length, and slant
Number of impressions (e.g., media circulation) per media coverage
Ad equivalency (value of earned media) per media coverage, or AVE Website Usage Website visits
Unique website visitors
Page views
% new vs. returning visitors
Visit frequency and duration Law Enforcement
Activities
Count of safety operations run by agency
Count and type of warnings and citations administered per operation
Count of enforcement officer hours spent per operation, by agency
Count of safety materials disseminated, by agency Community
Engagement Activities
List of partner agencies
Brief description of community engagement strategies used by partner agencies, including type of event, population reached, frequency, staff involvement, etc.
NCDOT and their media purchasing contractor, MSA Marketing, Inc., provided all information regarding paid media contracting and printing services used from May 2012 to January 2014. For earned media (meaning television, radio, and print news coverage that was not purchased), the Watch for Me NC project team began tracking news articles in May 2012, and routinely searched Lexis-Nexis archives and GoogleNews Alerts from the period of May 2012 to January 2014.