Available online at
http://www.iaeme.com/IJMET/issues.asp?JType=IJMET&VType=7&IType=2 Journal Impact Factor (2016): 9.2286 (Calculated by GISI) www.jifactor.com ISSN Print: 0976-6340 and ISSN Online: 0976-6359
© IAEME Publication
PARAMETER OPTIMIZATION IN
VERTICAL MACHINING CENTER CNC
FOR EN45 (STEEL ALLOY) USING
RESPONSE SURFACE METHODOLOGY
Ajay Kumar, Simranjeet Singh, Sahil Barry, Shivam Bhardwaj Research students, Mechanical Department,
GNI–Mullana, Kurukshetra University, Kurukshetra, Haryana, India
Er. Ajay Sharma, Er. Harpreet Singh Astt. Professor, Mechanical Department,
GNI–Mullana, Kurukshetra University, Kurukshetra, Haryana, India
ABSTRACT
Now days optimal machining parameters are of great concern in manufacturing environments, where economy of machining operations plays a key role in competitiveness in the market. This paper aims at developing a statistical model to optimize the surface parameters such as material removal rate (MRR) and surface roughness (SR).Response Surface Methodology (RSM) experimental design was used for conducting experiment. The experimental study was carried out in a CNC vertical machining center. The work piece material was EN45 (steel alloy).EN45 is widely used in the motor vehicle industry for leaf springs, truncated conical springs, helical springs and many general applications. The tool used was an end mill cutter made of solid carbide of dimensions (10mm×28mm×75L-4F).The experiment were carried out using Three input parameters viz. Feed rate(f) ,Spindle speed(N) and
Depth of cut(dc). The effect of machining parameters on MRR and surface
roughness is evaluated and the optimum cutting conditions for minimizing the surface roughness and maximizing the MRR is determined. The result of the
present experiment shows that the feed rate (f) and depth of cut (dc) are the
highly dominating factors and most significant factors that control the surface roughness and material removal rate as compared to the other parameters.
Key words: RSM, EN45, VMC, Spindle Speed, Depth of Cut, Feed Rate, MRR and Surface Roughness.
Cite this Article Ajay Kumar, Simranjeet Singh, Sahil Barry, Shivam Bhardwaj, Er. Ajay Sharma and Er. Harpreet Singh. Parameter Optimization In Vertical Machining Center CNC For En45 (Steel Alloy) Using Response Surface Methodology. International Journal of Mechanical Engineering and
Technology, 7(2), 2016, pp. 288–299.
http://www.iaeme.com/currentissue.asp?JType=IJMET&VType=7&IType=2
1. INTRODUCTION
With the increase in the precise demand of the modern engineering products, the surface texture has more importantly to be controlled. It is revealed from the study that surface texture greatly influences the functioning of the machined parts. Whatever may be the manufacturing process used, it is not possible to produce smooth surface. In this work, the machining parameters such as depth of cut (dc),
spindle speed (N) and feed rate (f) that affect the surface roughness and the MRR in the milling operation was studied. EN45 is a manganese spring steel with high carbon content. EN45 is used widely in the motor vehicle industry for leaf springs, truncated conical springs, helical springs and spring plates and many general engineering applications. EN45 springs steel is used for manufacturing the main components of cultivator. EN 45 spring steel material is used in the manufacturing of reversible shovel. Response surface methodology is used to plan the experiments and for the process of optimization. The confirmation test was conducted using optimum combination of cutting parameters.From the literature survey, it was under stood that no research work has been reported in VMC of EN45 material to find out the MRR and Surface Roughness. So, in this study, Response Surface Methodology (RSM) is used for the development of optimization of MRR and surface roughness with three different parameters feed rate, spindle speed and depth of cut.EN45 steel finds its typical applications in the manufacturing of automobile and machine tool parts. Because of its wide application EN45 steel has been selected as the work material in this work.
Chemical composition of EN45 ALLOY:
C %
Mn %
P %
S %
Si %
Al %
Ni %
Cr %
V %
Mo % 0.4863 0.7292 0.03974 0.02180 1.838 0.0050 0.0730 0.0459 0.2624 0.1056
2. RESPONSE SURFACE METHODOLOGY
Response surface methodology (RSM) is a collection of mathematical and statistical techniques for empirical model building. By careful design of experiments, the objective is to optimize a response (output variable) which is influenced by several
independent variables (input variables). An experiment is a series of tests, called runs,
in which changes are made in the input variables in order to identify the reasons for changes in the output response. The application of RSM to design optimization is aimed at reducing the cost of expensive analysis methods (e.g. finite element method or CFD analysis) and their associated numerical noise. Response surface method is the most effective method to study the result obtained from factorial experiments. It is an effective tool for modeling and studying the manufacturing problems. It delivers more information with fewer numbers of investigations. It is an investigation strategy for exploring the limits of the input parameters and emerging experiential statistical model for the measured response, by approximating the relationship existing between
the response and input process parameters. The limit of the process parameters has to be defined in response surface method and the first experimentation was done to recognize the machining parameters that affect the MRR and Surface roughness and to discover the range of the selected cutting parameters.
3. METHOD OF EXPERIMENT
Work piece material
The work piece material used for this experiment is EN45 steel alloy. The work piece is shape of rectangular slabs with dimensions of (51mm×48mm×14mm). Composition of material was obtained using spectro analysis and is given above. Due to its long life as compared to the mild steel and the wide applications of the EN45 in automobile industry and its surface finish application, this material is selected for the research work.
Experimental Setup
The experiment was conducted at Ambala College of Engineering, Ambala with the following experimental setup, the equipment used was Vertical Machining Center CNC of Siemens series named as VMC 8410.the tool used was a solid carbide tool of the diameter ɸ10mm.The work piece material used was EN45 steel alloy. The operation performed was face milling operation. Parameters used for the experiment were Feed rate, Spindle speed and Depth of cut. The responses considered in this study are surface roughness and material removal rate (MRR).the surface roughness was measured with the help of SRT-8210 surface roughness tester. Material removal rate is used to evaluate machining performance.MRR is expressed as the amount of material removed under a period of machining time. The process parameters are shown in the table 3.1 below.
TABLE 3.1 Process parameters with their values at three levels
Parameter Level 1 Level 2 Level 3 Output parameter
Feed Rate (mm/min) 50 275 500
MRR and Surface Roughness
Spindle Speed (rpm) 700 1350 2000
Depth of Cut (mm) 0.1 0.3 0.5
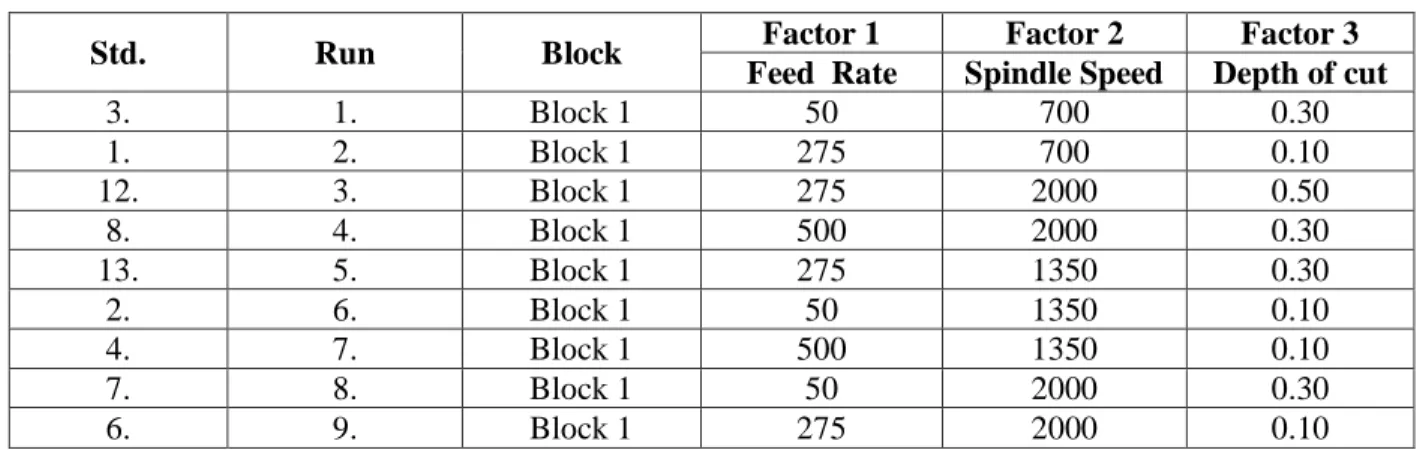
Response Surface Methodology was used for the design of the experimental array with the three different values at different levels. Table 3.2 shows the DOE with actual values.
TABLE 3.2 Actual values of process parameters
Std. Run Block Factor 1 Factor 2 Factor 3
Feed Rate Spindle Speed Depth of cut
3. 1. Block 1 50 700 0.30
1. 2. Block 1 275 700 0.10
12. 3. Block 1 275 2000 0.50
8. 4. Block 1 500 2000 0.30
13. 5. Block 1 275 1350 0.30
2. 6. Block 1 50 1350 0.10
4. 7. Block 1 500 1350 0.10
7. 8. Block 1 50 2000 0.30
Std. Run Block Factor 1 Factor 2 Factor 3 Feed Rate Spindle Speed Depth of cut
9. 10. Block 1 275 700 0.50
5. 11. Block 1 500 700 0.30
10. 12. Block 1 50 1350 0.50
11. 13. Block 1 500 1350 0.50
4. RESULT AND DISCUSSIONS
Response surface methodology indicates the area in the design region where the process is likely to give desirable result simultaneous consideration of multiple responses involves first building an appropriate response surface model for each response and trying to find operating conditions that in some sense of optimizes all response or at least keeps them in the desired range. The milling parameters such as the cutting speed, the depth of cut and the feed rate etc. are the investigated parameter that affects the surface quality and the material removal rate of the milled parts. Table 4.1 represents the experimental results with actual process parameters.MRR is calculated by the equation (1)
MRR= (Wb-Wa)/tm (g/min) (1)
Where, Wb= weight of the work piece before machining (g).
Wa= weight of the work piece after machining (g).
tm= time consumed in machining (min.).
TABLE 4.1 Experimental results with actual values of process parameters.
Std. Run Block
Factor 1 Factor 2 Factor 3 Response 1
Response 2 Feed
rate
Spindle speed
Depth of
cut MRR
S.R(Ra)
3. 1. Block 1 50 700 0.30 0.807 0.278
1. 2. Block 1 275 700 0.10 1.466 1.335
12. 3. Block 1 275 2000 0.50 7.8 0.618
8. 4. Block 1 500 2000 0.30 5.95 1.283
13. 5. Block 1 275 1350 0.30 3.056 1.008
2. 6. Block 1 50 1350 0.10 0.212 0.384
4. 7. Block 1 500 1350 0.10 1.833 0.873
7. 8. Block 1 50 2000 0.30 0.801 0.756
6. 9. Block 1 275 2000 0.10 1.366 0.827
9. 10. Block 1 275 700 0.50 6.366 1.316
5. 11. Block 1 500 700 0.30 6.166 1.342
10. 12. Block 1 50 1350 0.50 1.460 1.218
11. 13. Block 1 500 1350 0.50 9.3 1.303
(a) Effect of the process parameters on the Material Removal rate (MRR)
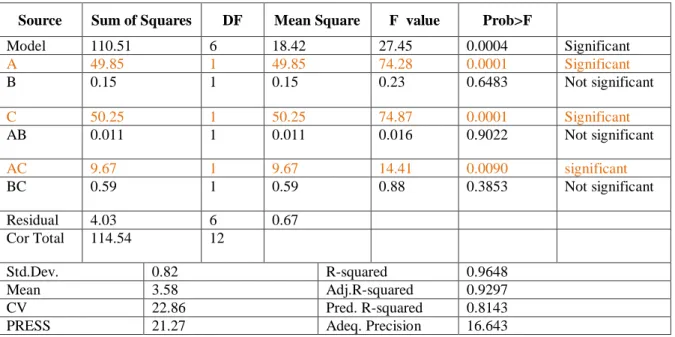
Deign expert 6.0 has been used for the calculation as shown in the above table 4.1.Based on the ANOVA the table4.2 depicts the effects of the process variables and the interactions based on the 2FI model for MRR. This model was developed for the 95% confidence level. The model F value 27.45 implies that the model is significant. There is only 0.04% chance that a model “F value” this large could occur due to noise. Values of “Prob>F”less than 0.0005 indicate model terms are significant. By checking the values of F values, it is seen that the factor A, C and AC are the most
significant effect on the MRR. Values greater than 0.1000 indicates the model terms are not significant.
TABLE 4.2 ANOVA for Response Surface 2FI Model for MRR
Source Sum of Squares DF Mean Square F value Prob>F
Model 110.51 6 18.42 27.45 0.0004 Significant
A 49.85 1 49.85 74.28 0.0001 Significant
B 0.15 1 0.15 0.23 0.6483 Not significant
C 50.25 1 50.25 74.87 0.0001 Significant
AB 0.011 1 0.011 0.016 0.9022 Not significant
AC 9.67 1 9.67 14.41 0.0090 significant
BC 0.59 1 0.59 0.88 0.3853 Not significant
Residual 4.03 6 0.67
Cor Total 114.54 12
Std.Dev. 0.82 R-squared 0.9648
Mean 3.58 Adj.R-squared 0.9297
CV 22.86 Pred. R-squared 0.8143
PRESS 21.27 Adeq. Precision 16.643
The “Pred. squared” of 0.8143 is in reasonable agreement with the “Adj. R-squared” of 0.9297.
"Adeq Precision" measures the signal to noise ratio. A ratio greater than 4 is desirable.
The ratio of 16.643 indicates an adequate signal. This model can be used to navigate the design space. Final equation (2) in terms of actual factors:
MRR = ( 3.58+2.50×Feed rate + 0.14 × Spindle speed + 2.15 × Depth of cut - 0.052 × Feed rate × Spindle speed + 1.55 × Feed rate × Depth of cut + 0.38 ×
Spindle speed × Depth of cut). (2)
Figure1 (a) Main factor plots on MRR with varied feed rate.
50.00 162.50 275.00 387.50 500.00
0.21 2.48 4.76 7.03 9.30
A: FEED RATE
M
.R
.R
.
One Factor Plot
The main factor plot on MRR with varied feed rate from 50-500mm/min. at spindle speed =1350rpm and Depth of cut =0.30mm as shown in figure1 (a).
Figure 1(b) Main factor plot on MRR with varied Spindle Speed.
The main factor plot on MRR with varied spindle speed from 700-2000 rpm at feed rate=275mm/min. and Depth of cut=0.30mm as shown in figure 1(b).
Figure 1(c) Main factor plot on MRR with varied Depth of Cut.
The main factor plot on MRR with Varied Depth of cut from 0.10-0.50mm at feed rate= 275mm/min. and Spindle speed= 1350 rpm as shown in fig.1(c).Figure 2 (a) and (b) shows the three dimensional interaction response surface and contour plot for the response MRR in terms of feed rate and depth of cut at spindle speed =1350 rpm. A contour plot plays a very important role in the study of response surface. From the
700.00 1025.00 1350.00 1675.00 2000.00 0.21
2.48 4.76 7.03 9.30
B: SPINDLE SPEED
M
.R
.R
.
One Factor Plot
Warning! Factor involved in an interaction.
0.10 0.20 0.30 0.40 0.50
0.21 2.48 4.76 7.03 9.30
C: DEPTH OF CUT
M
.R
.R
.
One Factor Plot
examination of the contour plot and response surface, it is observed that MRR increases from 1.76g/min. to 5.27g/min. with depth of cut from 0.10-0.50mm with feed rate from 50mm/min. to 500mm/min.
2(a) 2(b)
Figure 2(a) and (b) contour plot for MRR and response surface for MRR.
The figure 3(a) and 3(b) below shows the interaction plots with feed rate and depth of cut with a spindle speed =1350 rpm and normal probability distribution plot residuals respectively. Figure 3(c), 3(d) below shows the residual Vs predicted values, residuals Vs run respectively. It is clear from the figure that all the data points are following the straight line. Thus, the data is normally distributed. It can be seen from figure (c),(d) of figure 3 that all the actual values are following the predicted value and thus declaring model assumptions are correct and within the limits.
3(a) 3(b)
M.R.R.
A: FEED RATE
C : D E P T H O F C U T
50.00 162.50 275.00 387.50 500.00
0.10 0.20 0.30 0.40 0.50 1.76 2.64 3.52 4.39 5.27 0.21 2.48 4.76 7.03 9.30 M .R .R . 50.00 162.50 275.00 387.50 500.00 0.10 0.20 0.30 0.40 0.50
A: FEED RATE C: DEPTH OF CUT
C: DEPTH OF CUT
Interaction Graph
A: FEED RATE
M
.R
.R
.
50.00 162.50 275.00 387.50 500.00
0.12 2.62 5.12 7.62 10.13 C-C+ Studentized Residuals N o rm a l % P ro b a b il it y
Normal Plot of Residuals
-1.51 -0.58 0.34 1.27 2.19
1 5 10 20 30 50 70 80 90 95 99
3(c) 3(d)
Figure 3 (a) Interaction plot, (b) Normal plot of residuals, (c) Residuals Vs predicted plots, (d) Residual Vs run plots.
(b)Effect of the process parameters on surface roughness (Ra)
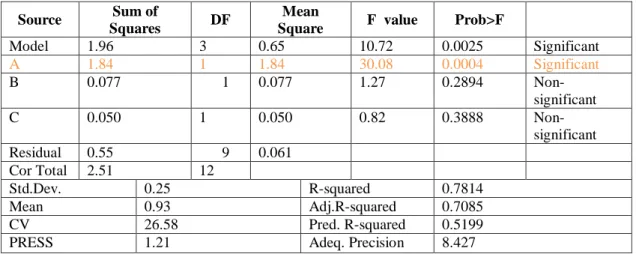
The model F value of 10.72 implies that the model is significant. There is only a chance of 0.25% that “model F -value” this large could occur due to noise. By checking F values P values, it is clear that values of “prob.>F” less than 0.0500 indicates model terms are significant. In this model the term A, (feed rate) has the most significant effect on Surface Roughness. Values greater than 0.1000 indicate that the model terms are not significant.
TABLE 4.3 ANOVA for Response Surface Linear model for Surface Roughness.
Source Sum of
Squares DF
Mean
Square F value Prob>F
Model 1.96 3 0.65 10.72 0.0025 Significant
A 1.84 1 1.84 30.08 0.0004 Significant
B 0.077 1 0.077 1.27 0.2894
Non-significant
C 0.050 1 0.050 0.82 0.3888
Non-significant Residual 0.55 9 0.061
Cor Total 2.51 12
Std.Dev. 0.25 R-squared 0.7814
Mean 0.93 Adj.R-squared 0.7085
CV 26.58 Pred. R-squared 0.5199
PRESS 1.21 Adeq. Precision 8.427
The “Pred. squared” of 0.5199 is in reasonable agreement with the “Adj. R-squared” of 0.7085. “Adj. R-R-squared” measures the signal to noise ratio. A ratio greater than 4 is desirable. The ratio 7.982 indicates an adequate signal. This model can be used to navigate the design space. The final equation (3) in terms of actual factors:
Predicted
S
tu
d
e
n
ti
z
e
d
R
e
s
id
u
a
ls
Residuals vs. Predicted
-3.00 -1.50 0.00 1.50 3.00
0.12 2.62 5.12 7.62 10.13
Run Number
S
tu
d
e
n
ti
z
e
d
R
e
s
id
u
a
ls
Residuals vs. Run
-3.00 -1.50 0.00 1.50 3.00
SURFACE ROUGHNESS (Ra) = (0.68187 + 2.13000E - 003 × Feed rate -
1.51346E-004 × Spindle speed - 0.39562 × Depth of cut) (3)
4 (a) 4 (b)
4(c) 4(d)
50.00 162.50 275.00 387.50 500.00
0.158 0.489 0.82 1.151 1.482
A: FEED RATE
S U R F A C E R O U G H N E S S
One Factor Plot
700.00 1025.00 1350.00 1675.00 2000.00
0.158 0.489 0.82 1.151 1.482
B: SPINDLE SPEED
S U R F A C E R O U G H N E S S
One Factor Plot
0.10 0.20 0.30 0.40 0.50
0.158 0.489 0.82 1.151 1.482
C: DEPTH OF CUT
S U R F A C E R O U G H N E S S
One Factor Plot SURFACE ROUGHNESS
C: DEPTH OF CUT
A : F E E D R A T E
0.10 0.20 0.30 0.40 0.50
50.00 162.50 275.00 387.50 500.00 0.559532 0.752074 0.944615 1.13716 1.3297
4(e)
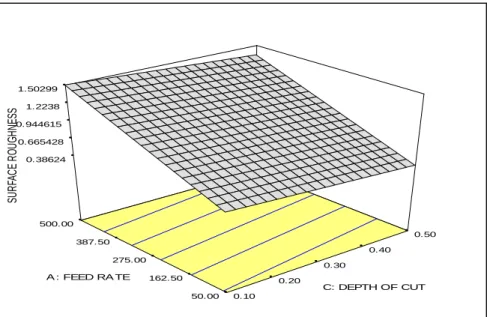
Figure 4: Main plots on Surface roughness (a) with varied feed rate (b) with varied spindle speed (c) with varied Depth of cut (d) Contour plot for surface roughness (e) Response
surface plot for surface roughness.
The main plots on surface roughness with varied feed rate from 50-500mm/min. at spindle speed =1350rpm and Depth of cut =0.30mm is shown in fig.4 (a) and with varied spindle speed from 700-2000 rpm at feed rate=275mm/min. and depth of cut=0.30mm is shown in fig.4 (b) and with varied Depth of cut from 0.10-0.50mm at feed rate=275mm/min and spindle speed=1350 rpm is shown in fig.4(c).The three dimensional interaction response and contour plots as shown in the fig. 4(d) and 4(e) for the response Ra in terms of feed rate and depth of cut. By generating response
surface analysis it is easy to characterize the shape of the surface and locate the optimum with reasonable precision from the examination of the contour plots and response surface, it is observed that Ra increases from 0.572µm to 1.317µm.with feed
rate from 50-500mm/min and depth of cut from 0.10-0.50mm.
5(a) 5(b)
0.38624 0.665428 0.944615 1.2238 1.50299 S U R FAC E R O U G H N ES S 0.10 0.20 0.30 0.40 0.50 50.00 162.50 275.00 387.50 500.00
C: DEPTH OF CUT A : FEED RA TE
A: FEED RATE
Interaction Graph
C: DEPTH OF CUT
S U R F A C E R O U G H N E S S
0.10 0.20 0.30 0.40 0.50
0.158 0.494 0.830 1.167 1.503 A-A+ Studentized Residuals N o rm a l % P ro b a b il it y
Normal Plot of Residuals
-1.33 -0.55 0.24 1.03 1.82
1 5 10 20 30 50 70 80 90 95 99
5(c) 5(d)
Figure 5 (a) Interaction plots, (b) Normal plots of residuals, (c) Residuals Vs Predicted, (d) Residuals Vs Run.
The figure 5(a) and 5(b) above shows the interaction plots with feed rate and depth of cut with a spindle speed=1350rpm and normal probability distribution plot residuals respectively. Figure 5(c), 5(d) below shows the residual Vs predicted values, residuals Vs run plot respectively. It is clear from the figure that all the data points are following the straight line. Thus, the data is normally distributed. It can be seen from figure (c),(d) of figure 5 that all the actual values are following the predicted value and thus declaring model assumptions are correct and within the limits.
CONCLUSION
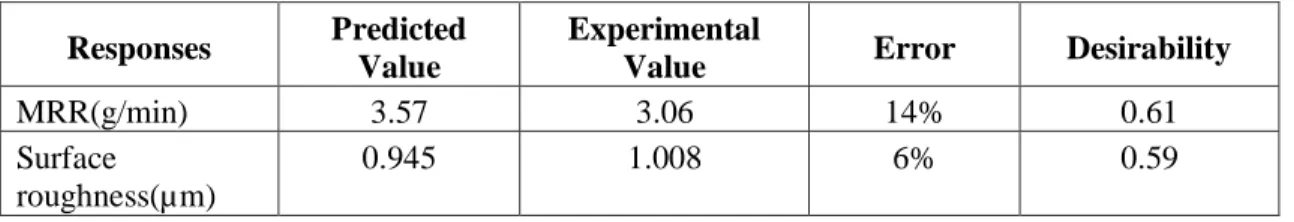
The observed MRR and surface roughness of the experimental result are 2.866g/min and 1.198 µm respectively. Table 5.1 shows the error percentage for experimental validation of the developed models for responses with optimal parameter setting during the milling of the EN45 on vertical machining center VMC. From the analysis from the table 5.2, it can be observed that the calculated error is small. The error between experimental and predicted values for MRR and Surface roughness lies within the 14% and 6% respectively. Obviously, the above experimental result confirms excellent reproducibility of the experiment conclusions.
TABLE 5.1 Multi-optimal parameter settings for MRR and Surface Roughness.
Parameters Units Optimal parameter
FEED RATE mm/min 275
SPINDLE SPEED R.P.M 1350
DEPTH OF CUT Mm 0.30
TABLE 5.2 Experimental validations of the developed models with optimal parameters. Responses Predicted
Value
Experimental
Value Error Desirability
MRR(g/min) 3.57 3.06 14% 0.61
Surface roughness(µm)
0.945 1.008 6% 0.59
Predicted
S
tu
d
e
n
tiz
e
d
R
e
si
d
u
a
ls
Residuals vs. Predicted
-3.00 -1.50 0.00 1.50 3.00
0.37 0.66 0.94 1.23 1.52
Run Number
S
tu
d
e
n
tiz
e
d
R
e
si
d
u
a
ls
Residuals vs. Run
-3.00 -1.50 0.00 1.50 3.00
In this study, the MRR and Surface roughness in parameter optimization in vertical machining center (VMC) for EN45 (steel alloy) was modeled and analyzed through Response surface methodology (RSM).Feed rate, spindle speed and depth of cut have been employed to carry out the experimental study. Summarizing the main features, the following conclusions could be drawn:
The predicted values lies very close to the experimental values reasonably close, with R5 of 3.06(g/min) for MRR and 0.945(µm) of surface roughness.
The error between the experimental values and predicted values at the optimal combination of parameters for MRR and Surface roughness lies within 14% and 6% respectively.
From multi- response optimization, the optimal combination of parameters setting are feed rate =275mm/min. and spindle speed = 1350 rpm and depth of cut =0.30mm for achieving the required maximum Material removal rate (MRR) and minimum Surface roughness.
REFERENCES
[1] Kumar Anish, Kumar Vinod, Kumar Jatinder, "Prediction of Surface Roughness in Wire Electric Discharge Machining (WEDM) Process based on Response Surface Methodology”, International journal of Engineering and Technology, 2(4), pp. 708-719, 2012.
[2] Pawan kumar, Anish kumar and Balinder singh, “Optimization of process parameters in surface grinding using Response Surface Methodology”, International journal of research in mechanical engineering & technology, 3(2), pp.245-252, 2013.
[3] Sumit Raj & Kaushik Kumar, “optimization of MRR and overcut in die sinking Electro-discharge machining of EN45 material using Grey-Taguchi technique”, International journal of Applied engineering Research,10(55),pp.3652-3656, 2015.
[4] Gunaraj V and Murugan N “Application of response surface methodology for predicting weld bead quality in submerged arc welding of pipes” J Mater Process Tech; 88, pp.266–275,1999.
[5] M.R. Soleymani Yazdi, A. Khorram “Modeling and Optimization of Milling Process by using RSM and ANN Methods” IACSIT International journal of engineering and technology, 2(5), pp.474-480, 2010.
[6] Jae-Seob Kwak, " Application of Taguchi and response surface methodologies for geometric error in surface grinding process ",International Journal of Machine Tools & Manufacture ,45, pp.327–334,2005.
[7] Singh Jagtar, Singh Lakhwinder Pal, Kaushik Ankur “Enhancing Wear Resistance of En45 Spring Steel Using Cryogenic Treatment” Friction and wear Research, 1(2), pp.22-26, 2013.
[8] Raj Mohan B V S and Suresh R K. Parameter Optimization In Vertical Machining Center CNC For En45 (Steel Alloy) Using Response Surface Methodology. International Journal of Mechanical Engineering and Technology, 6(8), 2015, pp. 31–45.
[9] Dr. B.V.R. Ravi Kumar. A Review on Importance of Microalloying in Steel.
International Journal of Mechanical Engineering and Technology, 5(2), 2014, pp. 187–193.
[10] Milon D Selvam, G.Karuppusami & A.K.Shaik Dawood, “optimization of machining parameters for face milling operation in a vertical CNC milling machine using genetic algorithm”, IRACST-Engineering science and technology international journal,2(4), pp.544-547, 2012.