PROCEEDINGS
(click on the title to read the text)
Invited paper 1 -
THE SURVEILLANCE OF BRIDGES IN FRANCE
Christian Cremona
Invited paper 2 -
AN OVERVIEW OF PARAMETRIC METHODS FOR NON-STATIONARY
RANDOM VIBRATION MODELING AND IDENTIFICATION
Stilios Fassois
Invited paper 3 -
MINING MACHINERY AND OTHER HEAVY MACHINERY
SURVEILLANCE METHOD CURRENT RESULTS AND FUTURE DEVELOPMENT
Walter Bartelmus
1 -
SUPERSYNCHRONOUS VIBRATIONS CAUSED BY TRANSVERSE ANNULAR
CRACKS IN ROTATING MACHINES A. Vania, P. Pennacchi, S. Chatterton
2 -
ON IMPULSIVE VIBRATION TESTS OF SHROUDED BLADE ROWS
Nicolò
Bachschmid , Emanuel Pesatori, Simone Bistolfi, Michele Ferrante, Steven Chatterton
3 -
USING THE MOVING SYNCHRONOUS AVERAGE TO ANALYSE FUZZY
CYCLOSTATIONARY SIGNALS Q. Leclere,N. Hamzaoui
4 -
DETECTION OF MECANICAL DEFECTS BY NEURAL NETWORKS “Experimental
Analysis”
Bouzouane Bélaid and Hamzaoui Nacer
5 -
OPERATIONAL MODAL MONITORING OF HIGH POWER HYDRO-ELECTRICAL
GENERATORS
Viet-Hung Vu, Marc Thomas and François Lafleur
6 -
AN EXPERIMENTAL BASED ASSESSMENT OF THE DEVIATION OF THE BEARING
CHARACTERISTIC FREQUENCIES
P. Pennacchi, P. Borghesani, S. Chatterton, R. Ricci
7 -
USING ANGULAR SPEED MEASUREMENT WITH HALL EFFECT SENSORS TO
OBSERVE GRINDING OPERATION WITH FLEXIBLE ROBOT
.
François Girardin, Farzad
Rafieian, Zhaoheng Liu, Marc Thomas and Bruce Hazel
8 -APPLICATION OF TEAGER-KAISER ENERGY OPERATOR TO THE ANALYSIS OF
DEGRADATION OF A HELICOPTER INPUT PINION BEARING
Patricia Henríquez, Paul
R. White, Jesús B. Alonso, Miguel A. Ferrer, Carlos M. Travieso
9 -
GEAR FAULT DETECTION USING SUPPORTS VECTOR MACHINE (SVM) &
GENETIC ALGORITHMS: APPLICATION TO AUTOMATED VIBRATION DIAGNOSIS
Ridha.ZIANI, Ahmed. FELKAOUI, Rabah. ZEGADI
10 -
PCA-BASED TECHNIQUES FOR DETECTING CRACKED ROTATING SHAFTS
INCLUDING THE EFFECTS OF TEMPERATURE VARIATIONS J. M. Machorro-López, A.
Bellino, L. Garibaldi, D. E. Adams
11 -
BAYESIAN INFERENCE FOR OUTLIER DETECTION IN VIBRATION SPECTRA
WITH SMALL LEARNING DATASET
Aurèlien Hazan, Michel Verleysena,, Marie Cottrella,
Jérôme Lacaille
12 -
SIMULATION METHODOLOGIES FOR GEAR TRAINS
F.Curà, A.E. Gallinattia
13 -
DYNAMIC BEHAVIOR OF A RIGID ROTOR SUPPORTED BY A NEW THREE-PAD
HYDROSTATIC SQUEEZE FILM DAMPER
A. Bouzidane , M. Thomas, and F. Ghezali
14 -
VIBRATION SIGNAL PROCESSING OF PISTON SLAP AND BEARING KNOCK IN
IC ENGINES Jian Chen, Robert Randall
15 -
BEARING DIAGNOSTICS USING IMAGE PROCESSING METHODS
Renata Klein,
Eyal Masad, Eduard Rudyk, Itai Winkler
16 -
EXTRACTION OF SECOND ORDER CYCLOSTATIONARY VIBRATION
COMPONENTS: THE TIME – FREQUENCY APPROACH
Jacek Urbanek, Jerome Antoni,
Page 1 of 4
PROCEEDINGS
29/07/2014
http://jean.fabri.perso.sfr.fr/sfm/papiers_surveillance/proceedings.htm
Tomasz Barszcz
17 -
IDENTIFICATION OF FREQUENCY-DEPENDENT ELASTIC MODULUS OF
POLYMERIC MATERIAL IN LAMINATED GLASSES
E.-L. Zhang, J.-D. Chazot, J. Antoni
18 -
GEARBOX CONDITION MONITORING AND DIAGNOSTIC USING COHERENCE
FUNCTION
Walter Bartelmus
19-
UNSUPERVISED FUZZY CLUSTERING OF INTERNAL COMBUSTION DIESEL
ENGINE FAULTS USING VIBRATION ANALYSIS
Mnaouar Chouchane , Ezzeddine
Ftoutou
20 -
VIBRATION CONTROL OF ROTATING MACHINES USING ACTUATED BEARING
SEATINGS
Saad S. Alkhfaji and Seamus D. Garvey
21 -
CONDITIONING OF A STATISTICAL INDICATOR FOR THE DETECTION OF AN
ASYNCHRONOUS MACHINE ROTOR FAULTS
Nabil NGOTE Saïd GUEDIRA Mohamed
CHERKAOUI
22 -
A PARAMETRIC APPROACH FOR THE ESTIMATION OF THE INSTANTANEOUS
SPEED OF ROTATING MACHINERY Rodopoulos Konstantinos Yiakopoulos Christos,
Antoniadis Ioannis
23 -
DIRECTIONAL REAL TIME BEAMFORMED MICROPHONE
Lucille Lamotte
Jean-Pierre Goudard
24 -
STFT BASED SPECTRAL KURTOSIS AND ENERGY DISTRIBUTION APPROACH
FOR BALL BEARING FAULT DETECTION IN A VARYING SPEED MOTOR
Marco
Cocconcelli, Radoslaw Zimroz, Riccardo Rubini and Walter Bartelmus
25 -FREQUENCY RESPONSE ANALYSIS OF DIAPHRAGM FOR SMALL EARPHONE
SUPPORTED BY NONLINEAR SPRINGS WITH HYSTERESIS USING FINITE ELEMENT
METHOD Manabu SASAJIMA, Takao YAMAGUCHI, Yoshio KOIKE, Akira HARA, Ken-ichi
NAGAI, Shinichi MARUYAMA
26 –
NON LINEAR RESPONSE IDENTIFICATION : A COMPRESSED SENSING
APPROACH P.Simard
27
-
ENDURANCE TEST-RIG FOR DIAGNOSTICS AND PROGNOSTICS OF ROLLING
ELEMENT BEARINGS
P. Pennacchi, R. Ricci, S. Chatterton, P. Borghesani
28 -
LONG-TERM MONITORING OF A PSC BOX GIRDER BRIDGE: OPERATIONAL
MODAL ANALYSIS, DATA NORMALIZATION AND NOVELTY DETECTION
C. Cremona
A. Cury
29 -
NEW INDICATORS BASED ON CYCLOSTATIONARITY APPROACH FOR
MACHINING MONITORING
M. LAMRAOUI, M. THOMAS , M. EL BADAOUI , I.
ZAGHBANI ,V. SONGMÉNÉ
30 -
FLEET HISTORICAL CASES FOR PREDICTIVE MAINTENANCE Maxime Monnin,
Bouthaina Abichou, Alexandre Voisin, Christophe Mozzati
31 -
PERFORMANCE EVALUATION OF MEASURES FOR THE THERMOGRAPHIC
DETECTION OF MOTOR FAULTS BY MASS UNBALANCE
Hermes Alexander Fandiño
Toro, Julio César García-Álvarez, César Germán Castellanos Domínguez.
32 -
BEARING FAULT DETECTION BASED ON NEAR-FIELD ACOUSTIC
HOLOGRAPHY
P. Coutable J.-H. Thomas J.-C. Pascal F. Eveilleau
33 -
EXTRACTING SENSITIVE INDICATOR FOR EARLY DIAGNOSIS OF ROTATING
MACHINERY Ishak TOUAFEK Ahmed FELKAOUI
34 -
THE EFFECT OF RESAMPLING ON THE ANALYSES RESULTS OF ENSEMBLE
EMPIRICAL MODE DECOMPOSITION (EEMD) H.MAHGOUN, A.FELKAOUI, R.E.BEKKA
35 -
SHM MAIN RESEARCH TOPICS : STATE OF ART AND EXAMPLE OF
APPLICATION ON EDF DIKES
.
Pierre STEPHAN Gautier MOREAU Sylvain BLAIRON
Jean SALIN
36 -
TENSION ESTIMATION OF CABLES WITH DIFFERENT BOUNDARY CONDITIONS
BY MEANS OF THE ADDED MASS TECHNIQUE A. Bellino, L. Garibaldi, A. Fasana, S.
Marchesiello
37 -
STRUCTURAL HEALTH MONITORING USING EMPIRICAL MODE
Page 2 of 4
PROCEEDINGS
29/07/2014
http://jean.fabri.perso.sfr.fr/sfm/papiers_surveillance/proceedings.htm
DECOMPOSITION AND AM/FM DEMODULATION
Roveri, N., Carcaterra, A.
38 -
DAMPING RESPONSE ANALYSIS FOR STRUCTURE CONNECTED WITH A
NONLINEAR COMPLEX SPRING AND APPLICATION FOR A FINGER PROTECTED BY
ABSORBERS UNDER IMPACT FORCES
Takao YAMAGUCHI Yusaku FUJII Toru
FUKUSHIMA Ken-ichi NAGAI Shinichi MARUYAMA
39 -
MONITORING VOLUMETRIC GEAR PUMPS USING CYCLOSTATIONARITY OF
THE DOWNSTREAM PRESSURE SIGNALS
M. Eltabach, S. Sieg-Zieba, T Vervaeke, E.
Padioleau, S. Berlingen
40 -
FEATURES EXTRACTION USING VIBRATION SIGNALS FOR CONDITION
MONITORING OF LIFTING CRANES M. Eltabach, T Vervaeke, S. Sieg-Zieba, E.
Padioleau, S. Berlingen
41 -
AUTOMATIC DIAGNOSIS ON REFRIGERATION COMPRESSORS ASSEMBLY
LINE T Vervaeke, S. Sieg-Zieba, M. Eltabach, E. Padiolleau, S. Berlingen
42 -
ROTATING MACHINERY DIAGNOSTIC USING HIDDEN ARKOV MODELS (HMMS)
Miloud Sedira Ahmed Felkaoui
43 -
VIBRATION ANALYSIS FOR DAMAGE DETECTION IN ULTRA FILTRATION
FIBERS
J. Roussel, P. Ravier, C. Capdessus, M. Jabloun
44 -
FEED BACK EXPERIENCE WITH HYDROELECTRIC POWER PLANT
MONITORING Jean-Luc VASSELIN & Vincent BOUILLET
45 -
FEED BACK EXPERIENCE IN TROUBLESHOOTING OF INDUCTION MACHINES
BY COUPLED VIBRATION & ELECTRICAL SIGNAL ANALYSIS : FOCUS ON
SYNCHRONOUS GENERATORS
.
Jean-Luc VASSELIN & Serge OLLIVIER
46 -
ADVANCED SPECTRAL SELECTION FILTERING (ASSF) Franck LARGETEAU
47 -
ROTARY MACHINES REMAINING LIFE PREDICTION E. Padiolleau, S. Berlingen, M.
Eltabach, T Vervaeke, S. Sieg-Zieba
48 -
COMPARISON OF VIBRATION SIGNAL SEPARATION TECHNIQUES FOR
ROTATING MACHINERY
;
Adam Jablonski*, Tomasz Barszcz, Jerome Antoni
49
- IDENTIFICATION OF A FE MODEL OF BOLTED JOINT’S PARAMETERS UNDER
NORMAL AND SHEAR LOADS
Morteza Iranzad, Hamid Ahmadian
50 -
UPDATING NON-LINEAR FE MODEL OF A BOLTED JOINTMorteza Iranzad, Hamid
Ahmadian
51 -
TECHNICAL AND FINANCIAL RESULTS OF A 7 YEARS OF CONDITION
MONITORING ON WIND FARM
F. Fugon, F. Wery
52
- A PRACTICAL PROCEDURE FOR ANGULAR RESAMPLING APPLIED TO
MOTION MEASUREMENTS ON A MOTORBIKE VALVE TRAIN
Alessandro Rivola, Marco
Troncossi
53 -
EXPERIMENTAL MODELING OF WIENER FILTERS ESTIMATED ON AN
OPERATING DIESEL ENGINE
Julie Drouet, Quentin Leclere, Etienne Parizet
54 -
DIAGNOSING SHAFT’S DAMAGE BY ENGINE ANGULAR SPEED FLUCTUATIONS
D. Boungoua;F.Guilleta;M. El Badaoui P.Lyonnet R. Toscano
55 -
TWO METHODS OF BLIND SOURCE SEPARATION EXPLOITING ONLY THE
HIGHER ORDER STATISTICS
Hanany Ould Baba, Jérôme Antoni, Vincent Robin
56 -
DIAGNOSTIC RAPIDE DES MACHINES A PISTONS PAR L'ACYCLISME:
APPLICATION AUX GROUPES DIESEL
Saiah Hamid,
57 -
H
vORDER TRACKING E. Sekko, Cecile Capdessus, Y. Sidibe, Z. Daher
58 -
NON-STATIONARY ACOUSTICAL HOLOGRAPHY BASED ON WAVELET
COEFFICIENT BACK-PROPAGATION
Maalej Fedia , Jérôme Antoni , Haddar Mohamed ,
Fakhfakh Taher, Vincent Lanfranchi
59 -
COMBINING BLIND SEPARATION AND CYCLOSTATIONARY TECHNIQUES FOR
MONITORING DISTRIBUTED WEAR IN GEARBOX ROLLING BEARINGS
G. D' Eliaa, S. Delvecchioa, M. Cocconcellib, G. Dalpiaz
60 -
MODELLING OF LOCAL DAMAGES IN SPUR GEARS AND EFFECTS ON
DYNAMICS RESPONSE IN PRESENCE OF VARYING LOAD CONDITIONS .
Page 3 of 4
PROCEEDINGS
29/07/2014
http://jean.fabri.perso.sfr.fr/sfm/papiers_surveillance/proceedings.htm
Fakher Chaari, R. Zimroz, W. Bartelmus, T. Fakhfakh, M. Haddar
61 -
BLIND SEPARATION OF ACOUSTIC SOURCES FROM THE PRINCIPLE OF
LEAST SPATIAL COMPLEXITY
DONG Bin, Jérôme ANTONI
62 -
CHAOS THEORY AND SIGNAL ANALYSIS FOR THE TOPOGRAPHICAL
SURFACES OF MATERIALS TOOLED BY TURNING MACHINING PROCESS.
Maxence Bigerelle, Jean Marie Nianga, Laurent Dubar and Alain Iost.
63 -
AN UNSCALED PARAMETER TO CHARACTERIZE THEREGULARITY OF A
SIGNAL
G. Guillemot , M. Bigerelle , J. Antoni , and K. Anselme
64 -
CHARACTERIZATION OF COUNTER TECHNIQUE FOR INSTANTANEOUS
ANGULAR SPEED MEASUREMENT:APPLICATION ON GEAR BOX SIGNAL
Wedian Youssef, Francois Guillet and Mohamed Elbadaoui
65 -
IMPACT OF ANGULAR SAMPLING ON MECHANICAL SIGNALS. M. El Badaouia,,
F. Bonnardota
Page 4 of 4
PROCEEDINGS
29/07/2014
http://jean.fabri.perso.sfr.fr/sfm/papiers_surveillance/proceedings.htm
1
Endurance test-rig for diagnostics and prognostics of rolling element bearings
P. Pennacchi, R. Ricci*, S. Chatterton, P. Borghesani
Politecnico di Milano, Dept. of MechanicalEngineering, Via La Masa 1 – 20156 Milan, Italy
Abstract
Detection of faults in roller element bearing is a topic widely discussed in the scientific field. Bearings diagnostics is usually performed by analyzing experimental signals, almost always vibration signals, measured during operation. A number of signal processing techniques have been proposed and applied to measured vibrations. The diagnostic effectiveness of the techniques depends on their capacities and on the environmental conditions (i.e. environmental noise). The current trend, especially from an industrial point of view, is to couple the prognostics to the diagnostics. The realization of a prognostic procedure require the definition of parameters able to describe the bearing condition during its operation. Monitoring the values of these parameters during time allows to define their trends depending on the progress of the wear. In this way, a relation between the variation of the selected parameters and the wear progress, useful for diagnostics and prognostics of bearings in real industrial applications, can be established. In this paper, a laboratory test-rig designed to perform endurance tests on roller element bearing is presented. Since the test-rig has operated for a short time, only some preliminary available results are discussed.
1. Introduction
Rolling element bearings are sensible elements of plants or systems in which they are installed. Since they allow a relative motion between a rotating shaft and a motionless case, it is important to monitor their functioning in order to estimate the health degree and to avoid possible catastrophic damages or undesired standstills of the plant involving, loss of production.
Typical causes of rolling bearing damage are: bad lubrication, mounting defects, operational overload conditions, wear of the bearing components and environmental aggressive conditions. These phenomena can interact among themselves causing an increase of the bearing deterioration. For example, failure of the sealing hat can be accelerated by the abrasive action of dirt, while contaminated lubricant can cause corrosion, rust and pits at the rolling elements, leading to wear and premature fatigue failure. Moreover, if the bearing is affected by passage of current, micro-craters arise in the raceway at the contact area among rolling parts, and sometimes several craters appear in a row around the circumference.
The assessment of the bearing condition is usually performed by analyzing measured signals. Therefore, considering also the small dimension of the bearing, diagnostics based on signal processing is preferable with respect to the model-based one. In literature, a lot of sophisticated techniques have been proposed for the treatment of experimental signals measured on different kind of mechanical components. Envelope analysis is probably the most established technique: introduced for the first time in [1], it allows to obtain both a distribution in the frequency domain and the characterization of the component condition. Subsequently, during years, others techniques have been implemented on purpose or borrowed from other applications for bearing diagnostics. Second order cyclostationary analysis [2], spectral kurtosis [3, 4] and minimum entropy deconvolution [5] are some examples of techniques that allow, by different approach and results, the characterization of the component health.
Unfortunately, these techniques, very effective in the detection of localized faults, provide less clear identification in case of distributed wear. Demonstration of the difficulty in monitoring and diagnostics of distributed wear is the reduced number of papers devoted to this topic [6, 7, 8].
Since the possibility to define the bearing condition during its functioning by means of suitable parameters in has recently encountered an increasing interest in the industrial field for various applications, a laboratory test-rig has been designed and implemented in order to perform experimental endurance tests on rolling element bearing with internal diameter of 20 and 30 mm. In the next section the test-rig is described, whereas in section 3 some preliminary results obtained during a trial endurance test will be presented. In section 4 some conclusion about both the performed and future tests will be drawn.
*
2
2. Experimental test-rig
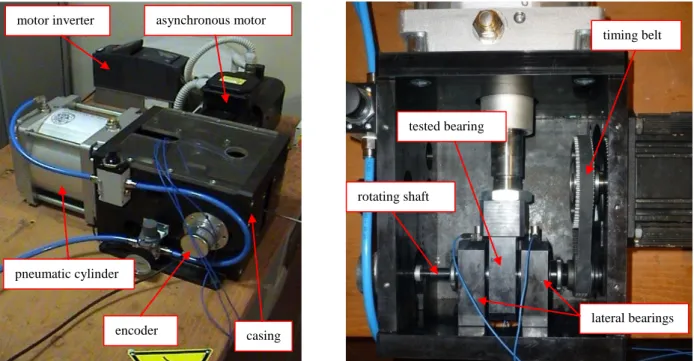
With the aim to perform endurance tests on roller element bearings, a laboratory test-rig has been designed and realized. The implemented test-rig, shown in Figure 1, is composed by a 1.75 kW asynchronous motor able to reach a maximum rotational speed of 2500 rpm, thanks to the speed control performed by means of an inverter. The motor is rigidly fixed to a casing in which a rotating shaft is placed. The rotating shaft, connected to the motor pulley by a timing belt, is supported by two bearings with double row cylindrical rolling elements lodged in two housing fixed on the external structure. In the middle of the rotating shaft, another bearing, with only one row of cylindrical roller elements is placed. As the lateral ones, also the central bearing is lodged in a casing fixed on a stem of a pneumatic cylinder which provide a static load on the bearing under test. The pneumatic cylinder, with a diameter of 200 mm, is able to produce a maximum force of 20 kN. It is important to highlight that the test-rig has been designed with the aim to test bearings with both 20 mm and 30 mm of internal diameter. Therefore two different shafts have been manufactured and different sets of lateral bearings have been provided.
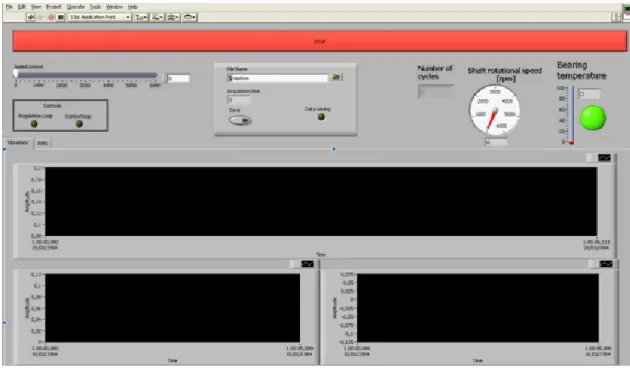
The rotating shaft is connected, by means of a pin, to an encoder which allow to count the number of rotations performed by the shaft and therefore by the bearing under test. Vibration signals are measured over time with the purpose is to characterize the bearing condition as a function of the number of performed cycles and to identify some parameters able to describe its progressive wear in order to realize prognostics. Vibration is measured in correspondence of the bearings: one single-axis accelerometer, with 100 mV/g sensitivity and 0÷10,000 Hz frequency range, has been placed on the housing of each bearing in order to measure vibrations along the radial direction. Together with the vibration signals and the current value of number of rotations performed by the bearing under test, available, as already said, thanks to the installed encoder, also the temperature of the outer ring of the bearing is measured by means of a RTD sensor. Vibration signals, outer ring temperature and counting of the cumulated cycles are continuously measured by means of National Instruments acquisition system but saved on a desktop PC only at regular intervals of 100,000 cycles with a sample frequency of 25 kHz. Also the rotational speed of the shaft is controlled by the PC by means of National Instruments hardware: in this way the rotational speed can be changed during the test according to the requirements of the user. However, in order to analyze consistent data, during the phase of data saving the rotational speed of the shaft is set equal to 1000 rpm (i.e. this represent the reference condition). Both the control and the acquisition tasks are performed by means of a software performed in Labview which user interface is shown in Figure 2.
Figure 1. Experimental test-rig: external view (left) and bearing position (right).
asynchronous motor casing encoder pneumatic cylinder motor inverter timing belt lateral bearings tested bearing rotating shaft
3
Figure 2. Test-rig control and acquisition software.
3. Preliminary experimental results
Since the aim of the experimental campaign is the evaluation of the operating life of the bearing in different operating conditions, the first endurance test is performed with a light load. Since the fatigue load for the selected bearing is 2.75 kN, a load of 3 kN is applied in order to develop the localized damage artificially realized on the bearing inner ring and shown in Figure 3.
The vibration signal acquired on the bearing under test at the beginning of the endurance test is shown in
Figure 4 (a). The main part of the vibration signal is included in the range -25 m/s2÷+25 m/s2. However, the
central part of the signal is characterized by some negative peaks of -70 m/s2. These deviations from the regular trend are due to a transient phenomenon: their structure suggests that they can be related to a stick-slips phenomena more than the damage. The spectrum of the acquired vibration signal is shown in Figure 4 (b): greater peaks are located in correspondence of low values of frequency. The frequency components characterized by high energy, like the two marked in Figure 4 (b), are due to the shaft rotation.
4
Figure 4. Vibration signal measured on the bearing under test after 20,000 cycles (a) and related spectrum (b). In Figure 5 (a), the vibration signal measured after 2.5 millions rotations of the bearing is shown. As it can be noticed, the amplitude of vibration is lower than the one characterizing the first acquisition. In this case,
almost the whole signal is included in the range -20m/s2÷+20 m/s2 and no transitory component is shown.
This reduction in terms of amplitude vibration can be due to a progressive smoothing of the localized damage realized on the bearing inner ring. This amplitude reduction is detectable also in the frequency domain. As it can be noticed by the right plot in Figure 4, in which the spectrum of the acquired signal is shown, the main frequency components have lower amplitude than the previous ones. For example, the component at 532.6 Hz has an amplitude halved with respect to the one of Figure 4 (b). Moreover, even if the majority of the overall energy is still carried by components at low frequencies, an increase of energy at high frequency occurs.
Figure 5. Vibration signal measured on the bearing under test after 2.5 millions cycles (a) and related spectrum (b). The consideration about the smoothing of the initial damage seems confirmed by the vibration signal measured after 5 millions cycles on the bearing under test.The vibration signal, shown in Figure 6(a), is
characterized by a regular amplitude included in the range -15m/s2÷+15m/s2 which is exceeded by only some
isolated peaks. Coherently with the amplitude reduction in the time domain, also the frequency components of the vibration signal spectrum, shown in Figure 6 (b), are characterized by reduced magnitude with respect the previous acquisitions. Ignoring the absolute amplitude, the energy distribution in the spectrum is very similar to the one characterizing the first acquisition.
The vibration signals measured after 7.5 and 10 millions of cycles in correspondence of the bearing under test are respectively shown in left plots of Figure 7 and Figure 8. The vibration amplitude remains of the same order of magnitude of the one previously considered; however, a slight reduction of amplitude for an increasing operating life is highlighted (e.g. the vibration amplitude at 10 millions cycles is lower than the one obtained at 7.5 millions cycles). This reduction could confirm that the passage of the rolling elements in correspondence of the localized fault is progressively smoothing its roughness.
0 5 10 15 20 25 30 -80 -60 -40 -20 0 20 40 60 80 Time [s] A m p li tu d e [ m /s 2] 0 1000 2000 3000 4000 5000 6000 7000 8000 9000 10000 0 0.05 0.1 0.15 0.2 0.25 0.3 X: 532.6 Y: 0.2862 Frequency [Hz] A m p li tu d e [ m /s 2] X: 2474 Y: 0.07144 0 2000 4000 6000 8000 10000 12000 -150 -100 -50 0 50 100 150 Frequency [Hz] P h a se [ °] 0 5 10 15 20 25 30 -80 -60 -40 -20 0 20 40 60 80 Time [s] A m p li tu d e [ m /s 2] 0 1000 2000 3000 4000 5000 6000 7000 8000 9000 10000 0 0.05 0.1 0.15 0.2 0.25 0.3 X: 898.3 Y: 0.1669 Frequency [Hz] A m p li tu d e [ m /s 2 ] X: 532.7 Y: 0.1362 0 2000 4000 6000 8000 10000 12000 -150 -100 -50 0 50 100 150 Frequency [Hz] P h a se [ °] (a) (b) (a) (b)
5
Some additional considerations can be drawn by considering the spectra of the vibration signals shown in right plots of Figure 7 and Figure 8 respectively. Whereas for the acquisition at 7.5 millions cycles there is a distributed reduction of energy, the spectrum of the signal acquired at 10 millions of revolutions highlights a concentration of energy in the 0÷1500 Hz frequency band.
Figure 6. Vibration signal measured on the bearing under test after 5 millions cycles (a) and related spectrum (b).
Figure 7. Vibration signal measured on the bearing under test after 7.5 millions cycles (a) and related spectrum (b).
Figure 8. Vibration signal measured on the bearing under test after 10 millions cycles (a) and related spectrum (b). However, in order to follow and to express synthetically the condition of the bearing during its operating life, some parameters can be used. In rolling bearings, the presence of both localized faults and distributed wear, can lead, during their functioning, to shocks responsible of an increase of energy carried by the vibration signal. For this reason, the parameter usually considered for a first characterization of the condition of a mechanical component is the root mean square (RMS) value. The RMS value as a function of the performed cycles calculated on the vibration signals measured on the bearing under test, is shown in Figure 9. As it is
0 5 10 15 20 25 30 -80 -60 -40 -20 0 20 40 60 80 Time [s] A m p li tu d e [ m /s 2] 0 1000 2000 3000 4000 5000 6000 7000 8000 9000 10000 0 0.05 0.1 0.15 0.2 0.25 0.3 X: 788.5 Y: 0.0939 Frequency [Hz] A m p li tu d e [ m /s 2] 0 2000 4000 6000 8000 10000 12000 -150 -100 -50 0 50 100 150 Frequency [Hz] P h a se [ °] 0 5 10 15 20 25 30 -80 -60 -40 -20 0 20 40 60 80 Time [s] A m p li tu d e [ m /s 2] 0 1000 2000 3000 4000 5000 6000 7000 8000 9000 10000 0 0.05 0.1 0.15 0.2 0.25 0.3 X: 769.3 Y: 0.05846 Frequency [Hz] A m p li tu d e [ m /s 2] 0 2000 4000 6000 8000 10000 12000 -150 -100 -50 0 50 100 150 Frequency [Hz] P h a se [ °] 0 5 10 15 20 25 30 -80 -60 -40 -20 0 20 40 60 80 Time [s] A m p li tu d e [ m /s 2] 0 1000 2000 3000 4000 5000 6000 7000 8000 9000 10000 0 0.05 0.1 0.15 0.2 0.25 0.3 X: 882.9 Y: 0.1341 Frequency [Hz] A m p li tu d e [ m /s 2] 0 2000 4000 6000 8000 10000 12000 -150 -100 -50 0 50 100 150 Frequency [Hz] P h a se [ °] (a) (b) (a) (b) (a) (b)
6
possible to see, the RMS do not change dramatically during the first 10 millions cycles but some variations
are however highlighted. The maximum RMS values, about 2.3 m/s2, are reached during the first cycles: this
is coherent with the greater vibration amplitude shown at the beginning of the endurance test (i.e. Figure 4).
In correspondence of 1.5 million cycles, the RMS decreases to values lower than 1.5 m/s2. After 2 millions
cycles the energy related to the vibration signal restarts to values included between the 1.5 m/s2 and the 2.1 m/s2. The substantial constancy of the RMS value of the vibration signal seems to indicate that the condition of the bearing is not changed significantly during the first 10 millions cycles.
Figure 9. RMS value for vibration signal acquired on the bearing under test as a function of the number of cycles. In order to integrate and confirm the information provided by the RMS, calculated on the vibration signal measured on the bearing under test, the same parameter is calculated for the data gathered by the sensors placed on the lateral bearings. With reference to the test-rig layout (i.e. Figure 1) for the position of the bearings, the RMS trends for the vibration signals measured on the left and right lateral bearings are shown in Figure 10 (a) and (b) respectively. Conversely from the bearing under test, the RMS trends highlights higher variations. Moreover, maximum values of the parameter are obtained in the last 2 millions cycles for the left bearing and in the central part of the plot for the right one. Notwithstanding their differences with the analogous representation for the bearing under test (i.e. Figure 9) the trends calculated for the lateral bearings do not add any information about the condition of the components under investigation.
Figure 10. RMS value for vibration signals acquired on left bearing (a) and right bearing (b) as a function of the number of cycles.
Since RMS value seems to provide scarce information about the bearing condition and considering that in the field of diagnostics of mechanical componentsit is widely accepted that the presence of a localized or distributed damage have different effects depending on the considered frequency band (i.e. not all the frequency bands have the same importance from a diagnostic point of view), the RMS values of vibration signals measured on the bearing under test are calculated for different frequency bands. For this purpose, the
0 2 4 6 8 10 x 106 0 0.5 1 1.5 2 2.5 3 Number of cycles R M S [ m /s 2 ] 0 2 4 6 8 10 x 106 0 1 2 3 4 5 Number of cycles R M S [ m /s 2 ] 0 2 4 6 8 10 x 106 0 0.5 1 1.5 2 2.5 3 3.5 4 Number of cycles R M S [ m /s 2 ] (a) (b)
7
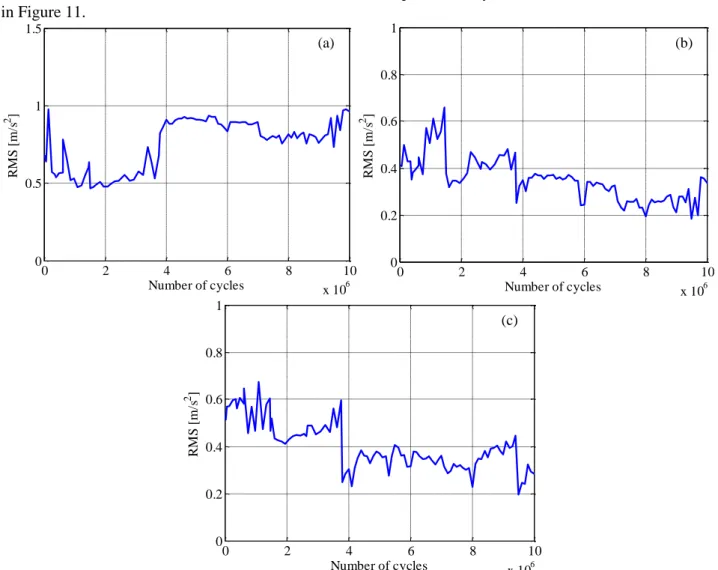
frequency domain has been arbitrarily divided in three equal intervals: 0÷3,333 Hz, 3,333 Hz÷6,666 Hz and 6,666 Hz÷10,000 Hz. The RMS values, as a function of the performed cycles, for the three bands are shown in Figure 11.
Figure 11. RMS value for different frequency bands for vibration signal acquired on bearing under test as a function of the number of cycles: 0-3,300 Hz (a), 3,300-6,600 Hz (b) and 6,600-10,000 Hz (c).
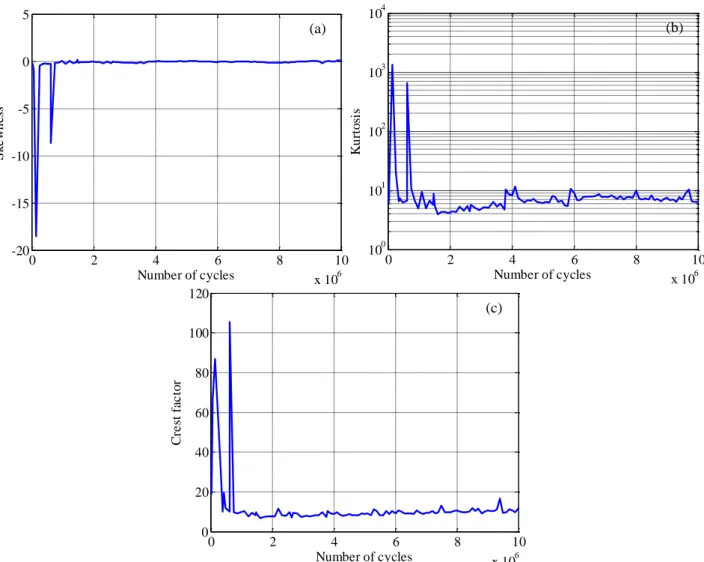
Coherently with the overall parameter, shown in Figure 9, also the RMS calculated for each frequency band are characterized by variations between subsequent acquisitions (i.e. the RMS is not perfectly constant). The calculation of the partial RMS however, allows to highlight some important aspects. The energy in correspondence of the medium and high frequencies (i.e. second and third frequency bands) decrease with the operating cycles. At low frequencies instead (Figure 11 (a)), the behavior of the RMS is opposite: the energy increase significantly just before the 4million cycles and it remains constant. It is important to observe that the increasing of energy in this band is related to its reduction at high frequencies. In other words, the energy seems to move from higher frequency components to the lower ones with the increasing of the operating life of the bearing. The trends shown in Figure 11 seem to suggest that, to describe the condition of the bearing during its functioning, some frequency bands are more suitable than others. In order to complete the analysis of the first data of the endurance test, in Figure 12, skewness, kurtosis and crest factor values, calculated for the vibration measured on the bearing under test as a function of the performed cycles, are shown. The information provided by the three parameters are very similar and not much relevant from a diagnostics point of view. All the parameters achieve high values at the beginning of the endurance test whereas low and about constant values are assumed after 2 millions of cycles. This behavior can be ascribed, as previously discussed, to the progressive smoothing of the initial localized damage.
0 2 4 6 8 10 x 106 0 0.5 1 1.5 Number of cycles R M S [ m /s 2 ] 0 2 4 6 8 10 x 106 0 0.2 0.4 0.6 0.8 1 Number of cycles R M S [ m /s 2 ] 0 2 4 6 8 10 x 106 0 0.2 0.4 0.6 0.8 1 Number of cycles R M S [ m /s 2 ] (a) (b) (c)
8
Figure 12.Skewness(a), kurtosis (b) and crest factor (c) of the vibration signal of the bearing under test as a function of the number of cycles.
4. Conclusions
The aim of the present paper is the analysis of the preliminary data gathered during the initial phase of a rolling element bearing endurance test. The endurance test is the first one (i.e. the trial one) of a more articulated experimental campaign scheduled by the authors in order to evaluate the operating life of bearing, considering also different working conditions in terms of lubrication and applied load. The necessity to evaluate the bearing operating life, starting from its installation or the appearing of the first localized fault, comes from the increasing interest, from an industrial point of view, in the realization of suitable diagnostics and prognostics procedures for this kind of components. For this purpose, a laboratory test-rig has been designed and implemented. The laboratory facility allows to measure vibration signals for an increasing number of performed cycles. These data will be analyzed in different way in order to define parameters able to describe the bearing condition and algorithms suitable for the realization of bearing prognostics procedures.
References
1.Darlow, M.S., Badgley, R. H., Hogg, G. W., Application of high frequency resonance techniques for bearings diagnostics in helicopter gearboxes, Technical Report, US Army Air Mobility Research and Development Laboratory, 1974, pp. 74-77;
2.Antoni, J., Cyclostationarity by examples, Mechanical Systems and Signal Processing, 23, 2009, pp. 987-1036;
3.Dwyer, R. F., Detection of non-Gaussian signals by frequency domain kurtosis estimation, International Conference on Acoustic, Speech, and Signal Processing, Boston, 1983, pp. 607-610;
4.Antoni, J. and Randall, R. B., The spectral kurtosis: application to the vibratory surveillance and diagnostics of rotating machines,
Mechanical Systems and Signal Processing, 20, 2006, pp. 308-331;
5.Wiggins, R. A.: Minimum entropy deconvolution, Geoexploration, 16 (1-2), 1978, pp. 21-35;
6.Ferreira, J. L. A. , Balthazar, J. C., Araujo, A. P. N., An investigation of rail bearing reliability under real conditions of use, Engineering Failure Analysis, 10, 2003, pp. 745-758;
7.Gerdun, V., Sedmak, T., Sinkovec, V., Kovse, I., Cene,B.,Failure of bearings and axles in railway freight wagons, Engineering Failure Analysis, 14 (2997), pp. 884-894; 0 2 4 6 8 10 x 106 -20 -15 -10 -5 0 5 Number of cycles S k e w n ess 0 2 4 6 8 10 x 106 100 101 102 103 104 Number of cycles K u rt o si s 0 2 4 6 8 10 x 106 0 20 40 60 80 100 120 Number of cycles C re st f ac to r (a) (b) (c)
9
8.Choy, F. K., Zhou, J., Braun, M. J., Wang, L., Vibration monitoring and damage quantification of faulty ball bearings, Journal of Tribology, 127, 2005, pp. 776-783.